| August 1, 2023

European Vacation: Your Guide to Roam Like at Home Performance this Summer

Summer is here and with it the August vacation season that most of Europe has been waiting for. We’re here with fresh data from Speedtest Intelligence® to help you know in advance if your phone will be a help or a hindrance on your travels. We’ve examined results from Android devices in the European Union (EU) and the United Kingdom (U.K.) during Q2 2023 and included data on 5G performance to see if “Roam Like at Home” is living up to its promise.

5G boosts European roaming speeds but latency varies 

Speed and latency are two important indicators of online performance. Speed will have a greater effect on streaming content while latency will affect gaming and video chatting. Both come into play while browsing online maps for that hot new gelato place your friends told you about. 

While the EU extended “Roam Like at Home” regulations until 2032, our previous analyses demonstrated that mobile speeds are usually slower when roaming than when exploring your home country. The actual speeds vary dramatically based on roaming agreements between mobile operators, something you can’t really control unless you’re prepared to do the research then shop for a whole new plan before your trip. What you can control is whether you spring for 5G before your big trip. The data below represents the local speeds and multi-server latency for each country as well as those experienced by residents of the named country while roaming in the EU or the U.K. during Q2 2023.

Roaming speeds can’t live up to local performance

Median Mobile Roaming Performance in Europe
Speedtest Intelligence | Q2 2023
Country Local Download (Mbps) Roaming Download (Mbps) Local 5G Download (Mbps) Roaming 5G Download (Mbps)
Austria 59.28 42.77 161.00 80.51
Belgium 48.00 59.86 157.23 124.64
Bulgaria 78.27 48.97 252.75 93.24
Croatia 73.65 47.86 184.29 124.38
Cyprus 56.93 40.83 197.22 64.24
Czechia 46.50 31.96 104.36 72.26
Denmark 118.48 51.74 206.95 115.82
Estonia 64.99 77.51 * *
Finland 78.00 53.43 217.13 106.54
France 61.64 43.46 187.42 95.56
Germany 46.30 39.54 114.07 84.27
Greece 57.41 66.17 143.26 153.28
Hungary 40.44 48.28 85.12 132.98
Ireland 34.49 36.10 98.70 85.38
Italy 36.97 37.68 130.85 99.38
Latvia 59.73 65.13 220.51 146.15
Lithuania 64.70 53.04 * *
Luxembourg 74.86 46.88 * *
Malta 44.56 48.11 109.97 110.80
Netherlands 96.77 37.61 128.04 87.84
Poland 42.14 34.23 78.82 99.51
Portugal 57.86 39.91 212.95 79.88
Romania 43.34 59.59 153.35 99.84
Slovakia 43.16 41.53 139.53 85.16
Slovenia 52.73 49.86 145.83 95.50
Spain 32.33 35.77 85.75 116.48
Sweden 84.00 51.24 160.93 129.43
United Kingdom 40.74 48.06 108.74 98.92

Although EU residents can roam call, text, and surf without additional charges, a drop in speed is an issue while roaming according to Q2 2023 data. Residents from 17 countries showed faster local download speeds than roaming speeds when considering results over all technologies during Q2 2023. The 11 exceptions were Romania (which was much faster roaming), Belgium, Hungary, Estonia, the U.K, Greece, and Spain, which all showed faster roaming speeds, and Latvia, Malta, Ireland, and Italy which showed only slightly improved speeds.  

While roaming speeds varied widely based on country of origin, every country on this list saw much higher median download speeds when roaming on 5G than roaming on all technologies. Despite this uplift, 20 countries showed faster local 5G download speeds than roaming 5G speeds during Q2 2023. The exceptions were Hungary, Spain, and Poland, which all saw faster 5G roaming than locally, while Greece had marginally better 5G roaming than at home, and people from Malta didn’t really see any major difference. Estonia, Lithuania, and Luxembourg did not have enough 5G samples to qualify for analysis.

Latency suffers awfully when roaming

Median Mobile Roaming Latency in Europe
Speedtest Intelligence | Q2 2023
Country Local Multi-server Latency (ms) Roaming Multi-server Latency (ms) Local 5G Multi-server Latency (ms) 5G Multi-server Latency (ms)
Austria 32.19 91.24 30.96 111.08
Belgium 36.51 84.96 31.89 67.61
Bulgaria 31.72 125.60 26.41 124.63
Croatia 39.03 85.25 35.96 80.37
Cyprus 27.90 200.18 23.52 184.68
Czechia 34.72 80.18 30.77 78.72
Denmark 29.47 94.77 28.08 81.85
Estonia 33.10 87.00 * *
Finland 33.67 102.84 32.16 99.14
France 46.97 92.61 44.39 87.49
Germany 41.78 87.19 39.07 77.57
Greece 38.16 137.29 34.63 132.91
Hungary 36.27 85.39 35.06 77.26
Ireland 36.21 116.62 31.70 118.47
Italy 50.87 100.20 49.96 93.87
Latvia 29.88 101.91 26.28 94.70
Lithuania 34.03 107.79 * *
Luxembourg 33.45 67.70 * *
Malta 47.44 146.57 38.69 135.43
Netherlands 33.24 83.25 31.17 79.81
Poland 42.41 108.69 40.25 100.36
Portugal 35.98 123.05 31.62 126.54
Romania 40.65 122.91 34.22 121.21
Slovakia 30.47 80.28 26.39 70.96
Slovenia 30.61 76.68 27.70 75.27
Spain 51.53 112.81 47.11 102.94
Sweden 37.52 114.69 32.97 99.48
United Kingdom 50.45 111.01 46.04 107.59

Residents of every country surveyed had a much higher multi-server latency when roaming during Q2 2023. This is because roaming signals are routed through a user’s home network, making latency a significant issue for Europeans when traveling. The difference was smallest in Italy and France where locals had about a 97% higher latency when roaming compared to at home. On the other end of the scale, residents of Cyprus saw over a 615% higher latency while roaming compared to at home. A high latency means a long response time for any request you send over the internet, perhaps adding more frustration to your vacation than you would want.

The results were similar over 5G with Italy showing the smallest difference between latency while roaming and at home (about 88% greater) and Cyprus having the largest difference (about 685%). Surprisingly, 5G did not reliably improve multi-server latency. 

What this data tells you is that it’s worth upgrading to 5G before a trip if speed is your main concern. Whether 5G will help you with your latency will depend heavily on which country you are traveling from. Regardless, you should expect a high latency while roaming. Plan ahead accordingly.

Outbound roaming speeds vary dramatically

As discussed above, roaming speeds depend heavily on where you are traveling from, where you are traveling to, and what agreements your home mobile operator has with operators in the country you’re visiting. That said, it’s fun to look at what’s possible, so we looked at the very best and very worst roaming speeds in Europe during Q2 2023.

Fastest roaming speeds in Europe

Customers from Italy roaming in Portugal saw one of the fastest median roaming download speeds over 5G in all of Europe during Q2 2023 at 317.94 Mbps. Estonians roaming in Finland saw a 278.69 Mbps median 5G download speed, and Finns in Sweden experienced a median 5G download of 252.57 Mbps. 

Looking at the highest results from all technologies combined, Latvians roaming in Finland experienced a median download speed of 137.49 Mbps, while Greeks saw median download speeds of 129.75 while roaming in Bulgaria and 125.83 Mbps while roaming in Austria.

Slowest roaming speeds in Europe

On the other end of the scale, Slovakian visitors to Poland had one of the slowest median download speeds over all technology while roaming during the same time period at 10.82 Mbps. Polish roamers saw a median download speed of 13.27 Mbps in the U.K. and 14.78 Mbps in Romania. Ten of the 20 slowest roaming speeds on our country-by-country list for all technologies were for Europeans roaming in the U.K. This means that travelers going to the U.K are not only seeing poorer performance, they could also be paying more for the privilege as they do not benefit from “Roam Like at Home” regulations.

Germans in Italy had the slowest median 5G download speed on our list during Q2 2023 at 33.64 Mbps. Austrians in the U.K. saw a median download speed over 5G of 41.57 Mbps, and Portuguese roamers in Spain experienced a median download speed over 5G of 44.18 Mbps.

Whether you choose to roam, pick up a local SIM or eSIM, or simply spend less time online, we hope this information helps you make the most of your vacation. If you have an extra minute between activities, take a Speedtest® to see how your performance compares. 

Ookla retains ownership of this article including all of the intellectual property rights, data, content graphs and analysis. This article may not be quoted, reproduced, distributed or published for any commercial purpose without prior consent. Members of the press and others using the findings in this article for non-commercial purposes are welcome to publicly share and link to report information with attribution to Ookla.

| May 1, 2023

Three Grows from Challenger to 5G Market Leader in the U.K., Ireland, and Austria

In our recent analysis of 5G performance across Europe, we noted that challenger mobile operators often outperform incumbents — strong results from Three across its footprint are proof of that. This article examines the secret sauce behind Three’s performance across three European countries — the United Kingdom, Ireland, and Austria. 

Key takeaways

  • Dedicated 5G spectrum matters. Three’s approach to spectrum is similar across the board — it uses dedicated 5G spectral resources, and it has access to at least 100 MHz contiguous spectrum in C-band, which is the ITU’s minimum technical requirement to meet 5G performance requirements. 
  • Network investment pays off. Three continues to focus on 5G network investment, which in turn helped to drive 5G performance. 
  • Sustainability futureproofs networks. Three looks at several energy efficiency initiatives, including smart network “sleeping mode” and retiring legacy technologies to create a network that’s ready for tomorrow’s demands. 

Three leads on speeds

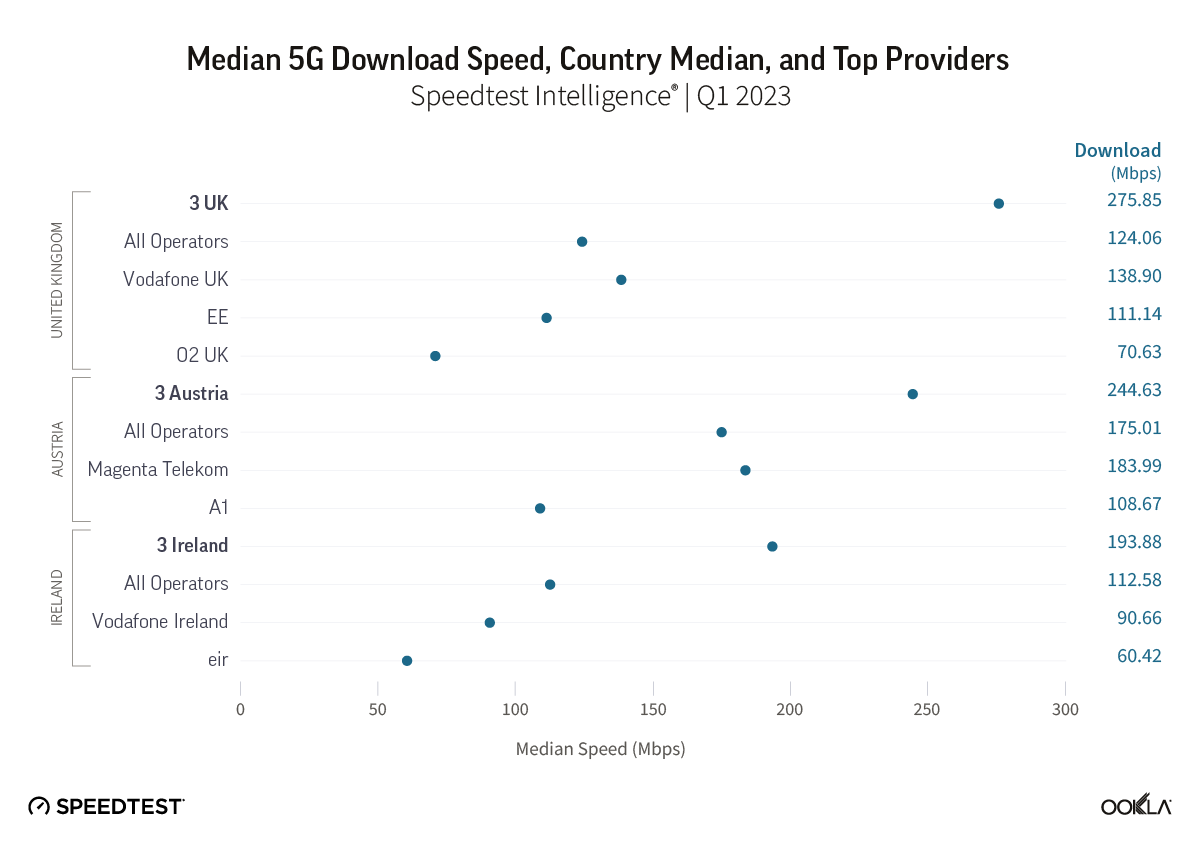
Chart of Median 5G Download Speed, Country Median, and Top Providers

Austria, Ireland, and the U.K. belong to the 5G High Performers cluster, which means that they share many of the characteristics of 5G leaders — markets with median 5G download speeds typically greater than 300 Mbps — having made an adequate spectrum allocation for 5G use and fostered competition between operators, which has helped spur network investment. However, they lag behind 5G Leaders based on their level of network densification. Using Speedtest Intelligence® data, we analyzed 5G performance in Q1 2023 across Austria, Ireland, and the U.K. Three was a leading operator in each of these countries for median 5G download speed. 

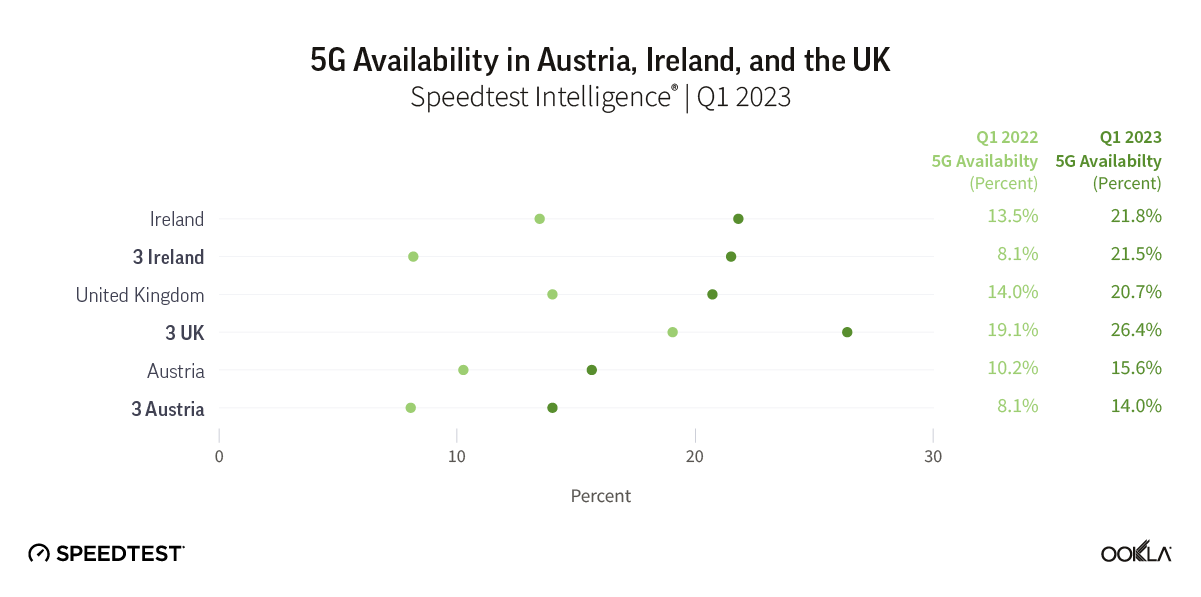
3UK was 2.2 times faster than the median 5G speed for the U.K., 3 Austria surpassed the country-level performance by 1.36 times, while Three Ireland was 64% faster than the median country-level 5G download speed. Three was a late entrant into the telecom scene — having launched 20 years ago in March 2003 — often skipping 2G network rollout and being the first company to introduce “All you Can Eat” plans. 

Three’s approach to spectrum pays off

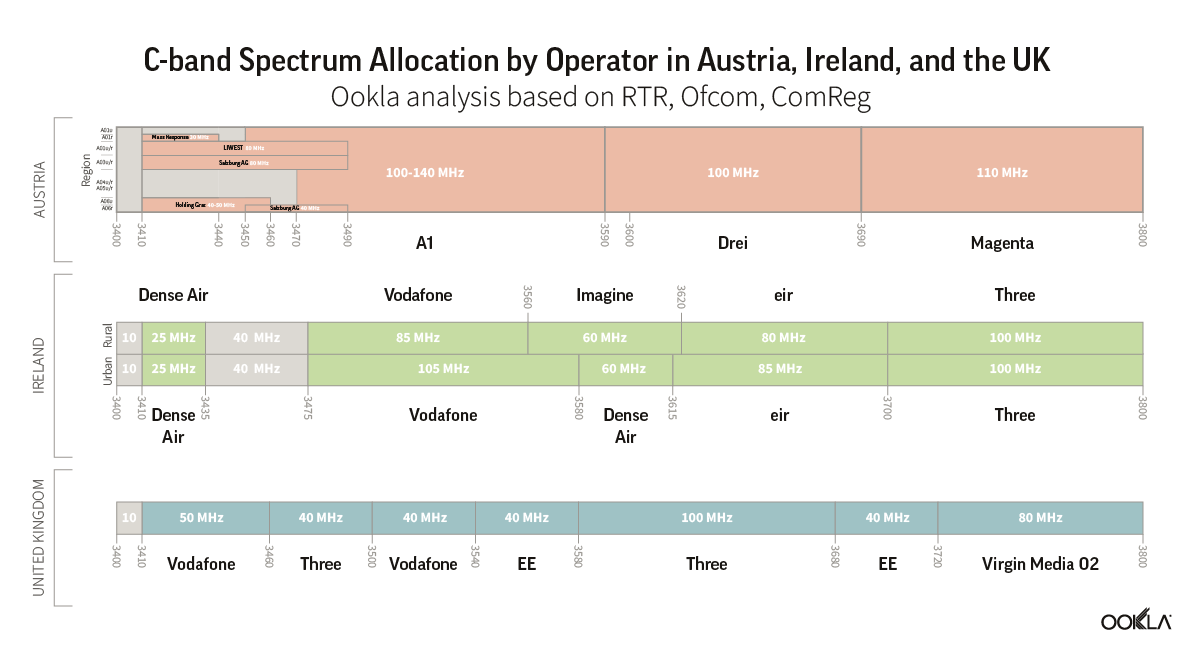
As our previous analysis shows, access to a dedicated 5G C-band spectrum enabled faster download speeds, especially if such spectrum is contiguous. The ITU minimum technical requirements to meet 5G performance requirements identify at least 100 MHz channels per operator. All Austrian operators have access to just that: 3 Austria 100 MHz spectrum and Magenta 110MHz, nationally. A1 has access to a block of 100-140 MHz in C-band, depending on the region. 

Chart of C-band Spectrum Allocation by Operator in Austria, Ireland, and the UK

Three Ireland was the only operator to receive a continuous block of 100 MHz spectrum nationally, both in urban and rural areas. Vodafone and eir have different spectrum holdings: Vodafone has 105 MHz in urban areas and 85 MHz in rural areas, eir 85 MHz (urban) and 80 MHz (rural). Imagine — a wireless broadband provider — holds 60 MHz spectrum in rural areas, Dense Air, 60 MHz in urban and 25 MHz in rural. Furthermore, Three uses a dedicated 5G spectrum instead of Dynamic Spectrum Sharing (DSS), which explains its superior performance compared to other operators. 

In the U.K., Three also holds an advantageous position regarding spectrum ownership — it has a block of 140MHz frequency across several 5G spectrum bands, including a 100 MHz block of continuous spectrum in the C-band. In addition, the operator has been working on adding 10 Gbps backhaul to its sites everywhere to boost the 5G experience. 

5G Availability on the rise

Chart of 5G Availability in Austria, Ireland, and the UK

Our research shows that access to low band spectrum in part impacts the operator’s 5G Availability but affordability and availability of 5G-capable smartphones are essential too. Ireland had top 5G Availability in Q1 2023 at 21.6%, increasing by 8.1 ppts year-on-year. 

The number of 5G subscriptions has been on the rise in Ireland; ComReg reported a total of 988,164 5G mobile subscriptions in Q4 2022 — a 152% year-on-year increase — accounting for 11.1% of all subscriptions in Ireland. Three Ireland’s 5G network covers 85% of the Irish population. To expand the pool of 5G users, in January 2023, Three Ireland, as the first Irish mobile operator, offered 5G to all customers as standard at no additional fee, initially to new customers. Customers need a 5G-enabled device to access the 5G network and be within 5G network reach. Elaine Carey, Chief Commercial Officer (CCO) for 3 Ireland and 3 UK, said offering free 5G across all its mobile plans would provide customers with a “better-connected life.” Currently, Vodafone and Eir only offer 5G to customers with 5G-enabled plans. Our data shows that during Q1 2023, Three’s 5G Availability increased by 5.5 ppt while the country average increased only by 1.9 ppt, proving that the strategy paid off. 

In the U.K., 5G Availability increased by 6.7 ppt, driven by the growing adoption of 5G smartphones and coverage. According to the Ofcom Connected Nations 2022 report, the pool of 5G capable devices increased from around 10% in 2021 to 20% in 2022, while data traffic carried over 5G tripled — from 3% of all traffic in 2021 to over 9% in 2022. In April 2023, as part of the new Wireless Infrastructure Strategy, the government set out its ambitions for all populated areas to be covered by “standalone” 5G by 2030, increasing from 77% of the population already having access to 5G from one provider using 5G NSA. 

In Austria, 5G Availability passed the 15% mark in Q1 2023, up from 10% a year prior. Despite coverage obligations related to network deployment set out by the Federal Ministry for Digital and Economic Affairs (BMDW) in November 2019 as part of the operators’ 5G license, the 5G adoption is lackluster compared to other countries. For example, Drei Austria had to provide 5G coverage to at least 15% of the population in all provincial cities with more than 50,000 inhabitants by the end of 2020 and 40% by the end of 2023. Furthermore, Drei wants to increase its 5G coverage to three-quarters of all households and companies by the end of 2023 and provide 222 previously underserved communities with mobile broadband internet by using additional frequencies in the 700 and 1500 MHz bands for 5G. In September 2022, Drei Austria announced the launch of 5G SA, dubbed 5G+, making it available to 1.3 million homes and businesses. The company also offers mobile internet with a residential bandwidth guarantee, which it claims is the world’s first. 

Network investment continues

Chart of Capex in Austria, Ireland, and the UK

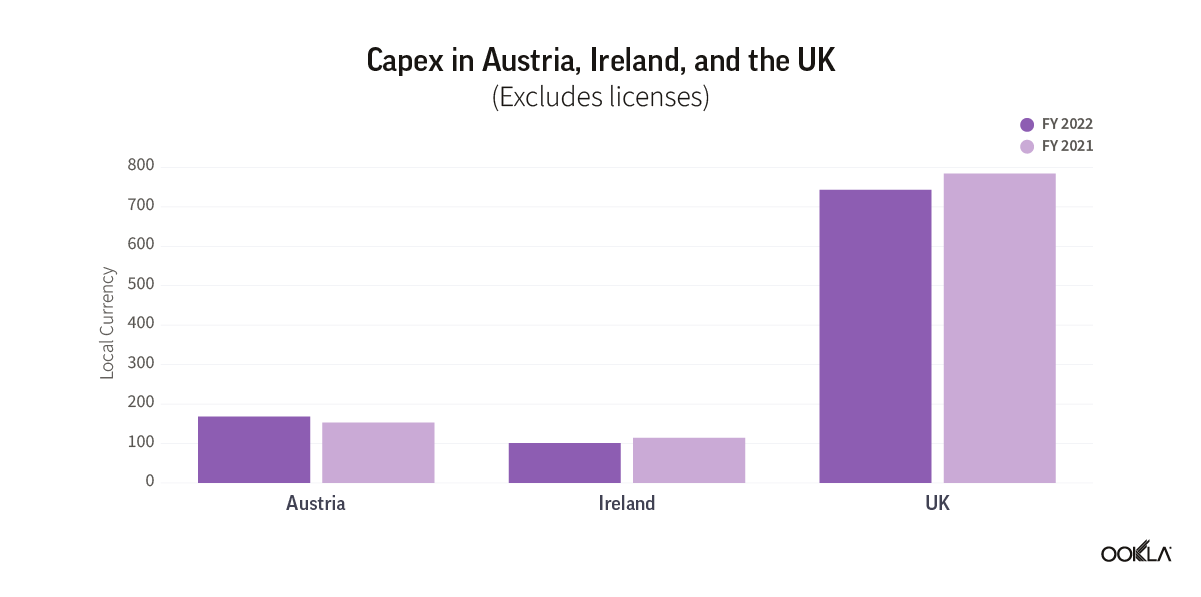
In Ireland, Three worked on an ongoing network transformation program investing over €2 billion, including an €820 million investment in upgrading and expanding the network into Three’s digital transformation. 

In March 2023, Drei announced a total investment program for 5G in Austria of €1.2 billion beyond 2025.”Our largest network offensive in the company’s history, which we announced last year, has got underway. We are investing 1.2 billion Euros in the nationwide expansion of our new 5G network beyond 2025,” said Drei CTO Matthias Baldermann during the 2022 results announcement. In Austria, Drei utilized new spectrum to the full extent, leading-edge equipment, and installed powerful massive MIMO antennas on each site — a new range with the new antenna. As a result, improvement in terms of performance and capacity for customers can be measured in improved consumer satisfaction. 

Three UK has invested over £2 billion to transform its network and IT infrastructure as part of a five-year program. Over the past five years, Three has undergone an immense transformation — it was the first operator to deploy cloud core. There are 19 data centers across the U.K. — compared to the previous three core data centers. With 19 data centers, there is a good balance between what goes in each and what needs to serve the customer more quickly. The edge data center, collocated with other providers, deals with straight internet access and peering to get traffic from the networks to the source. It also comes with additional efficiency in terms of Capex and Opex — the cost of 19 data centers is the same as the three legacy ones.

From tower owners to tenants 

Following the path of a general industry direction, Three has outsourced the management of its network assets. In November 2022, Spanish mobile tower operator – Cellnex Telecom – completed the acquisition of the U.K. telecoms tower assets of Three UK. This was the last one of the multi-country deals signed by CK Hutchinson and Cellnex in November 2020, whereby Cellnex acquired a total of 24,600 towers across the U.K., Italy, Ireland, Austria, Sweden, and Denmark for approximately €10 billion ($10.35 billion). 

Not only performance but energy efficiency is also top of mind 

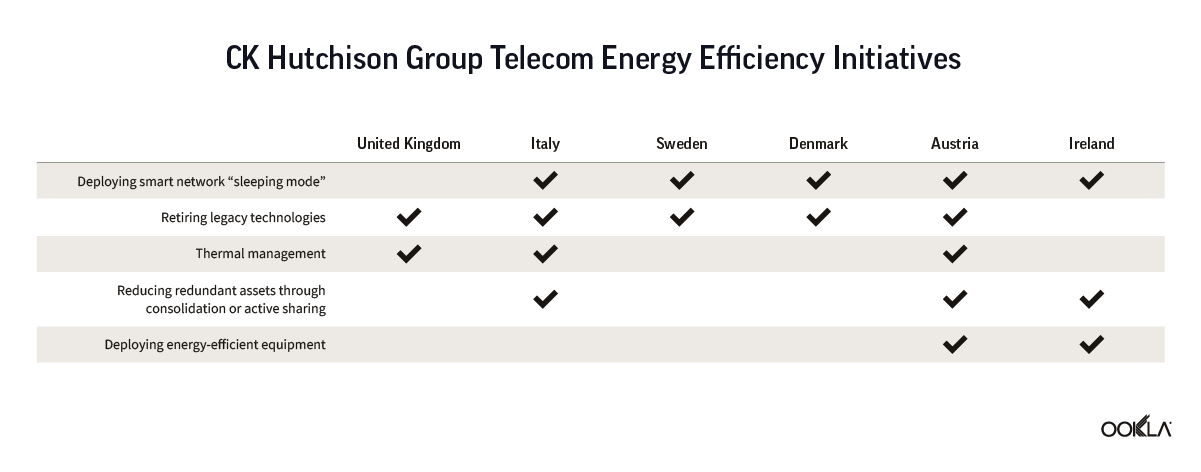
In Ookla’s Take on Telco Trends in 2023, we have predicted that the quest for Net Zero becomes more urgent as cost-cutting and optimizing operations are top-of-mind for telcos in 2023 as energy prices and broader inflation remain high. We are already seeing operators look to sustainable solutions, such as wind and solar farmers, to supply sites with green energy instead of commercial electricity, partially to reduce costs. CK Hutchison Group Telecom 2022 Annual Results showcased a wider range of energy efficiency initiatives deployed across its European footprint.

Chart of CK Hutchison Group Telecom Energy Efficiency Initiatives

Robert Finnegan, Chief Executive of Three Ireland and Three UK, said the company was satisfied with its 2022 financial performance despite the additional impacts of inflation and soaring energy costs. “As part of our sustainability strategy, we continued to invest in energy-saving initiatives across the network infrastructure in 2022, which helped mitigate against energy inflation.” Furthermore, across its footprint, Three has deployed various strategies such as smart network “sleeping mode” and energy efficiency equipment, the retirement of legacy technology, and the reduction of redundant assets through consolidation and active sharing, and thermal management. Three Ireland implemented “proof of concept” for on-site solar generation on mast sites as solar panels are more energy efficient and greener. 

During the Connectivity Insights session at MWC 2023, Iain Milligan, Chief Network Officer of Three UK, shared that the operator is currently undergoing some trials with network vendors to address energy efficiency via a mix of features. From a hardware perspective — they deploy the most recent hardware, which brings efficiency; feature rollout in the radio also brings gains in multiple aspects. Lastly, analytics play an essential role, too, helping to identify peak usage times compared to quieter periods. All of these can bring 60% improvements. 

We will continue to monitor 5G performance progress closely using Speedtest Intelligence. If you want to learn more about how Speedtest Intelligence can help you benchmark your 5G performance against competitors, please inquire here.

Ookla retains ownership of this article including all of the intellectual property rights, data, content graphs and analysis. This article may not be quoted, reproduced, distributed or published for any commercial purpose without prior consent. Members of the press and others using the findings in this article for non-commercial purposes are welcome to publicly share and link to report information with attribution to Ookla.

| December 18, 2022

Stable and Expanding: The State of Worldwide 5G in 2022


5G is no longer a new technology, however, consumers in many countries are still waiting to see the full benefits of 5G (or even to connect to 5G at all). We examined Speedtest Intelligence® data from Q3 2022 Speedtest® results to see how 5G performance has changed since last year, where download speeds are the fastest at the country level, and how satellite technologies are offering additional options to connect. We also looked at countries that don’t yet have 5G to understand where consumers are seeing improvements in 4G LTE access.

5G speeds were stable at the global level

Graphic of 5G median speed performance worldwide.

In 2021, we discussed how an expansion of 5G access led to a decline in overall speed at the global level. This year showed a stabilization in overall speed, even as 5G access broadened, with a median global 5G download speed of 168.27 Mbps in Q3 2022 as compared to 166.13 Mbps in Q3 2021. Median upload speed over 5G slowed slightly to 18.71 Mbps (from 21.08 Mbps) during the same period. According to the Ookla® 5G Map™, there were 127,509 5G deployments in 128 countries as of November 30, 2022, compared to 85,602 in 112 countries the year prior.

South Korea and the United Arab Emirates led countries for 5G speeds

Chart of fastest countries for median 5G download speed

South Korea and the U.A.E. had the fastest median download speed over 5G at 516.15 Mbps and 511.70 Mbps, respectively, during Q3 2022, leading a top 10 list that included Bulgaria, Qatar, Saudi Arabia, Singapore, Kuwait, New Zealand, Bahrain, and Brazil. Bulgaria, Singapore, Bahrain, and Brazil were new to the top 10 in 2022, while Norway, Sweden, China, and Taiwan fell out of the top 10.

Satellite became more accessible but performance slowed

2022 saw a proliferation of fast, low-earth orbit (LEO) satellite internet from Starlink across the world. Q1 2022 saw Starlink speeds increase year over year in Canada and the U.S., with Starlink in Mexico having the fastest satellite internet in North America, Starlink in Lithuania the fastest in Europe, Starlink in Chile the fastest in South America, and Starlink in Australia the fastest in Oceania.

Q2 2022 saw Starlink speeds decrease in Canada, France, Germany, New Zealand, the U.K., and the U.S. from Q1 2022 as Starlink crossed the 400,000 user threshold across the world. Starlink in Puerto Rico debuted as the fastest satellite provider in North America. Starlink outperformed fixed broadband averages in 16 European countries. Starlink in Brazil had the fastest satellite speeds in South America. And Starlink in New Zealand was the fastest satellite provider in Oceania.

During Q3 2022, Starlink performance dipped once again from Q2 2022 in Canada and the U.S., while remaining about the same in Chile. Starlink in Puerto Rico and the U.S. Virgin Islands had the fastest satellite speeds in North America, while Starlink in Brazil again was the fastest satellite provider in South America.

With Viasat, HughesNet, and Project Kuiper set to launch huge LEO constellations in 2023, consumers around the world are poised to have more fast satellite internet options, particularly as the European Commission makes its own play for a constellation and Eutelsat and OneWeb potentially merging.

5G Availability points to on-going challenges

5G Availability measures the proportion of Speedtest users with 5G-capable handsets, who spend a majority of time connected to 5G networks. It’s therefore a function of 5G coverage and adoption. We see wide disparity in 5G Availability among markets worldwide, with for example the U.S. recording 54.3% in Q3 2022, well ahead of markets such as Sweden and the U.A.E., with 8.6% and 8.3% respectively.

Chart of 5G availability in select markets, based on users with 5G-capable handsets

Critical levers for mobile operators to increase 5G Availability include:

  • Increasing 5G coverage by deploying additional base stations
  • Obtaining access to, or refarming, sub-GHz spectrum, to help broaden 5G coverage, as sub-GHz spectrum has superior propagation properties than that of higher frequency spectrum bands.
  • Encouraging 5G adoption among users with 5G-capable handsets.

Speedtest Intelligence points to 5G adoption challenges in some markets, with 5G Availability dropping in Bulgaria, South Korea, the Netherlands, and the U.A.E. As more users acquire 5G-capable devices, operators need to balance their pricing models to ensure users have sufficient incentives to purchase a 5G tariff.

Chart of percentage change in 5G availability in select markets, based on users with 5G-capable handsets

Where 5G continues to fail to reach

Speedtest Intelligence showed 29 countries in the world where more than 20% of samples were from 2G and 3G connections (combined) during Q3 2022 and met our statistical threshold to be included (down from 70 in Q3 2021). These are mostly countries where 5G is still aspirational for a majority of the population, which is being left behind technologically, having to rely on decades-old technologies that are only sufficient for basic voice and texting, social media, and navigation apps. We’re glad to see so many countries fall off this list, but having so many consumers on 2G and 3G also prevents mobile operators from making 4G and 5G networks more efficient. If operators and regulators are able to work to upgrade their users to 4G and higher, everyone will benefit.

Countries That Still Rely Heavily on 2G and 3G Connections
Speedtest IntelligenceⓇ | Q3 2021
Country 2G & 3G Samples
Central African Republic 76.2%
Turkmenistan 58.5%
Kiribati 51.6%
Micronesia 47.4%
Rwanda 41.1%
Belarus 39.7%
Equatorial Guinea 37.7%
Afghanistan 36.7%
Palestine 33.5%
Madagascar 27.5%
Sudan 27.4%
Lesotho 26.5%
South Sudan 26.3%
Benin 26.0%
Guinea 25.5%
Cape Verde 24.3%
Tonga 24.3%
Syria 23.4%
The Gambia 23.4%
Ghana 23.3%
Palau 22.9%
Niger 22.8%
Tajikistan 22.7%
Mozambique 22.4%
Guyana 21.8%
Togo 21.8%
Congo 21.1%
Moldova 20.8%
Saint Kitts and Nevis 20.0%

We were pleased to see the following countries come off the list from last year, having dropped below the 20% threshold: Algeria, Angola, Anguilla, Antigua and Barbuda, Armenia, Barbados, Bosnia and Herzegovina, Botswana, Burundi, Caribbean Netherlands, Cook Islands, Dominica, Ecuador, El Salvador, Ethiopia, Gabon, Grenada, Haiti, Honduras, Jamaica, Liberia, Mauritania, Namibia, Nigeria, Papua New Guinea, Saint Lucia, Saint Vincent and the Grenadines, Sierra Leone, Solomon Islands, Somalia, Suriname, Swaziland, Tanzania, Trinidad and Tobago, Uganda, Ukraine, Uzbekistan, Vanuatu, Venezuela, Yemen, Zambia, and Zimbabwe. While countries like Belarus, Cape Verde, Central African Republic, Guinea, Guyana, Madagascar, Palestine, Rwanda, South Sudan, Tajikistan, Togo, and Turkmenistan are still on this list, they have improved the percentage of their samples on these outmoded technologies when compared to last year by at least 10 points. Palestine improved by more than 50 points. 2G and 3G samples in Kiribati increased 3.2 points when comparing Q3 2022 to Q3 2021.

We’re glad to see performance levels normalize as 5G expands to more and more countries and access improves and we are optimistic that 2023 will bring further improvements. Keep track of how well your country is performing on Ookla’s Speedtest Global Index™ or track performance in thousands of cities worldwide with the Speedtest Performance Directory™.

Ookla retains ownership of this article including all of the intellectual property rights, data, content graphs and analysis. This article may not be quoted, reproduced, distributed or published for any commercial purpose without prior consent. Members of the press and others using the findings in this article for non-commercial purposes are welcome to publicly share and link to report information with attribution to Ookla.

| February 20, 2019

An Expansive Analysis of European Mobile Roaming Speeds and Behaviors

Last year we took a look at how free roaming was working out for EU citizens in terms of speeds and latency. This year we’ve expanded our analysis to all European countries and included data on Wi-Fi roaming behavior. We’ve also added a little insight into how roaming might affect download speeds for visitors to Mobile World Congress (MWC) in Barcelona from February 25- 28, 2019.

Except where noted, this analysis is based on Speedtest data from Android devices on 4G LTE cellular connections during Q3-Q4 2018. We included data on any country with greater than 30 samples in all categories.

Most Europeans experience slower downloads while roaming

Roaming traffic is subject to deals struck between individual mobile operators on how that traffic will be prioritized, so roaming speeds can depend not only on the country of origin but also the country of destination and the plan a subscriber has selected.

Consider the following table where an Albanian experiences a mean download speed of 54.56 Mbps at home and then 38.47 Mbps while roaming elsewhere in Europe. This is expected as a roamer does not usually have a direct relationship with the mobile operator handling their data and calls abroad.

Mean Mobile Download Speeds in Europe
Speedtest Data | Q3-Q4 2018
Country Local Speed (Mbps) Roaming Speed (Mbps) % Difference
Austria 38.23 35.78 -6.4%
Belarus 16.15 19.49 20.7%
Belgium 52.58 35.42 -32.6%
Bulgaria 47.28 32.35 -31.6%
Croatia 43.83 43.60 -0.5%
Cyprus 37.13 20.58 -44.6%
Czech Republic 44.91 13.43 -70.1%
Denmark 48.83 34.89 -28.6%
Estonia 36.43 38.98 7.0%
Finland 39.33 38.20 -2.9%
France 39.94 34.97 -12.5%
Germany 33.77 28.57 -15.4%
Greece 41.35 38.08 -7.9%
Hungary 49.57 28.19 -43.1%
Iceland 69.27 35.58 -48.6%
Ireland 28.23 31.49 11.6%
Italy 32.18 43.12 34.0%
Kazakhstan 22.93 13.80 -39.8%
Latvia 30.88 33.79 9.4%
Liechtenstein 56.48 36.66 -35.1%
Lithuania 41.49 33.43 -19.4%
Luxembourg 50.91 25.08 -50.7%
Malta 56.34 34.27 -39.2%
Montenegro 45.45 49.97 10.0%
Netherlands 56.06 33.86 -39.6%
Norway 68.49 38.69 -43.5%
Poland 28.74 29.71 3.4%
Portugal 32.06 36.95 15.3%
Romania 36.64 30.74 -16.1%
Russia 20.91 20.47 -2.1%
Serbia 43.41 21.64 -50.1%
Slovakia 33.47 31.80 -5.0%
Slovenia 35.51 36.41 2.5%
Spain 36.07 22.37 -38.0%
Sweden 44.87 34.59 -22.9%
Switzerland 47.59 30.36 -36.2%
Turkey 38.19 28.77 -24.7%
Ukraine 26.07 25.48 -2.3%
United Kingdom 30.84 38.76 25.7%

Residents of the Czech Republic will face massive speed disappointment when roaming through the rest of Europe. Other countries with much better speeds at home than abroad include Luxembourg, Serbia, Iceland and Cyprus.

In ten European countries, citizens experience faster mobile downloads while roaming than they do at home. These include: Italy, the United Kingdom, Belarus, Portugal, Ireland, Montenegro, Latvia, Estonia, Poland and Slovenia. Most of these are among the slowest countries on this list, so it would make sense that their citizens would experience better speeds elsewhere in Europe than they do at home.

Europeans are connected to Wi-Fi most of the time

Customers sometimes try to get better speeds and avoid roaming fees (for those outside the E.U.) and data overages by connecting to Wi-Fi. The following table compares the percentage of time spent on Wi-Fi by a resident of a country with that of a visitor to the country.

Percentage of Time Spent on Wi-Fi in Europe
Speedtest Data | Q3-Q4 2018
Country Local Customers Visitors % Difference
Albania 61.9% 59.8% -3.4%
Andorra 73.6% 69.0% -6.2%
Armenia 61.5% 68.1% 10.7%
Austria 65.6% 36.7% -44.1%
Azerbaijan 67.0% 70.7% 5.5%
Belarus 63.9% 58.3% -8.9%
Belgium 71.1% 32.9% -53.7%
Bosnia and Herzegovina 71.9% 66.0% -8.2%
Bulgaria 65.2% 46.8% -28.2%
Croatia 66.1% 41.0% -38.0%
Cyprus 70.9% 58.4% -17.7%
Czech Republic 75.1% 38.9% -48.1%
Denmark 70.4% 52.9% -24.9%
Estonia 61.2% 45.6% -25.4%
Finland 56.6% 47.1% -16.7%
France 60.2% 43.1% -28.5%
Georgia 61.4% 62.2% 1.3%
Germany 72.2% 42.4% -41.3%
Greece 73.5% 52.2% -28.9%
Hungary 71.9% 35.0% -51.3%
Iceland 65.7% 58.2% -11.4%
Ireland 67.2% 52.4% -22.0%
Italy 64.1% 48.9% -23.7%
Kazakhstan 57.7% 64.7% 12.3%
Latvia 60.9% 43.8% -28.1%
Liechtenstein 71.7% 58.2% -18.9%
Lithuania 66.8% 43.3% -35.1%
Luxembourg 63.6% 26.0% -59.1%
Macedonia 65.3% 52.9% -18.9%
Malta 74.3% 58.0% -22.0%
Moldova 67.2% 67.3% 0.2%
Montenegro 63.6% 65.2% 2.5%
Netherlands 73.0% 42.5% -41.7%
Norway 74.7% 59.7% -20.1%
Poland 62.5% 48.1% -23.1%
Portugal 69.1% 54.7% -20.9%
Romania 62.4% 48.7% -21.9%
Russia 58.8% 65.9% 12.2%
San Marino 66.8% 39.7% -40.6%
Serbia 68.6% 61.2% -10.7%
Slovakia 69.6% 35.1% -49.6%
Slovenia 63.3% 26.4% -58.3%
Spain 70.8% 53.0% -25.2%
Sweden 71.8% 44.9% -37.4%
Switzerland 62.4% 47.2% -24.4%
Turkey 61.7% 73.0% 18.4%
Ukraine 61.5% 62.4% 1.5%
United Kingdom 71.3% 54.0% -24.3%

Finland showed the lowest time spent on Wi-Fi by residents at 56.6%. Kazakhstan was second at 57.7% followed by Russia (58.8%), France (60.2%) and Latvia (60.9%). The Czech Republic showed the highest time spent on Wi-Fi by residents at 75.1%. Norway was second at 74.7% followed by Malta (74.3%), Andorra (73.6%) and Greece (73.5%).

When it comes to time spent on Wi-Fi by visitors, Luxembourg had the lowest percentage at 26.0%. Slovenia was second at 26.4% followed by Belgium (32.9%), Hungary (35.0%) and Slovakia (35.1%). Turkey showed the highest time spent on Wi-Fi by visitors at 73.0%. Azerbaijan was second at 70.7% followed by Andorra (69.0%), Armenia (68.1%) and Moldova (67.3%).

Luxembourg saw the largest difference in time spent on Wi-Fi between residents and visitors with visitors using Wi-Fi 59.1% less than residents. Slovenia was close behind at 58.3%, followed by Belgium (53.7%) and Hungary (51.3%). On the other end of the spectrum, visitors to Turkey were on Wi-Fi 18.4% longer than residents followed by Kazakhstan (12.3%) and Russia (12.2%).

Roaming dramatically increases latency in Europe

Because roaming signals are routed through a user’s home network, latency is always an issue in roaming. Speedtest data shows that latency while roaming is a much larger issue for residents of some countries than it is for others.

Comparing European Latency In-Country and Abroad
Speedtest Data | Q3-Q4 2018
Country Local Latency (ms) Roaming Latency (ms) % Difference
Austria 24 83 245.8%
Belarus 32 75 134.4%
Belgium 24 81 237.5%
Bulgaria 24 126 425.0%
Croatia 32 86 168.8%
Cyprus 20 194 870.0%
Czech Republic 24 86 258.3%
Denmark 24 98 308.3%
Estonia 23 78 239.1%
Finland 26 104 300.0%
France 42 87 107.1%
Germany 33 87 163.6%
Greece 27 137 407.4%
Hungary 22 94 327.3%
Iceland 18 163 805.6%
Ireland 34 114 235.3%
Italy 52 116 123.1%
Kazakhstan 35 164 368.6%
Latvia 24 94 291.7%
Liechtenstein 40 90 125.0%
Lithuania 26 108 315.4%
Luxembourg 23 73 217.4%
Malta 18 141 683.3%
Montenegro 18 42 133.3%
Netherlands 26 81 211.5%
Norway 36 109 202.8%
Poland 33 104 215.2%
Portugal 27 102 277.8%
Romania 26 131 403.8%
Russia 42 161 283.3%
Serbia 22 76 245.5%
Slovakia 30 69 130.0%
Slovenia 21 69 228.6%
Spain 45 118 162.2%
Sweden 30 118 293.3%
Switzerland 26 75 188.5%
Turkey 26 115 342.3%
Ukraine 35 116 231.4%
United Kingdom 37 107 189.2%

Residents of Cyprus saw an average latency of 194 ms while roaming in Europe. The country with the second highest latency for residents roaming abroad was Kazakhstan at 164 ms, followed by Iceland (163 ms). Russia (161 ms) and Malta (141 ms). In contrast, Montenegro had a lower latency for residents roaming abroad than Italy did for residents using their mobile phones locally.

Roaming performance at MWC

MWC, the largest mobile conference in the world, has Barcelona teeming with visitors from across the globe all trying to connect to their home networks. During February 2018 we saw an average download speed of 34.31 Mbps while roaming in Barcelona and a mean latency of 201 ms. Visitors from the U.K. saw an average download speed of 49.00 Mbps and a mean latency of 111 ms, while those from Italy averaged a download of 32.88 Mbps and a latency of 128 ms.

What will the performance look like at this year’s conference? Schedule a meeting or come see us in Hall 2 at Booth 2i25 to learn more about our roaming data.

Ookla retains ownership of this article including all of the intellectual property rights, data, content graphs and analysis. This article may not be quoted, reproduced, distributed or published for any commercial purpose without prior consent. Members of the press and others using the findings in this article for non-commercial purposes are welcome to publicly share and link to report information with attribution to Ookla.

| September 7, 2021

5G in Austria: Evaluating Performance Two Years After Launch

Auf Deutsch lesen

Austria has been held up as an example of a pioneer European 5G-market, having announced its 5G Strategy in April 2018, which has since been incorporated in the nation’s Broadband Strategy 2030. This strategy includes a number of 5G targets: commitments to early 5G trials, the rollout of 5G in all state capitals by the end of 2020 (which it has achieved), coverage of all main traffic routes in the country by the end of 2023 and nationwide 5G coverage by the end of 2025. We analyzed Speedtest Intelligence® data from Q1-Q2 2021 to see how performance is tracking two years on from launch. We compared Austrian 5G speeds to those of its regional peers and examined how its operators 5G networks perform across the country.

Key spectrum auctions are opening up Austria’s 5G market

Despite COVID-19 related delays, the Austrian regulator has completed the auction of spectrum in key 5G bands. The first auction in early 2019 saw all three national mobile operators acquire contiguous bands at least equal to the EU’s recommended 80-100 MHz in the C-band. A follow up multi-band auction (which included spectrum in the 700 MHz band) was conducted in September 2020 and included obligations to cover a range of not-spots (areas of zero mobile broadband coverage) and partial not-spots (areas of coverage by only one network operator).

Having access to large contiguous blocks of spectrum in the key C-band will allow Austrian operators to make more efficient use of their spectrum resources and better support high-bandwidth, low-latency 5G use cases. Austria already looks set to advance with standalone (SA) 5G networks, with Drei Austria recently announcing a trial in the capital Vienna and plans to launch a commercial 5G SA network in spring 2022. Notably, operators have complained that the high cost of mobile mast rental has slowed 5G rollout.

Switzerland had the fastest 5G among Austria’s European peers during Q1-Q2 2021

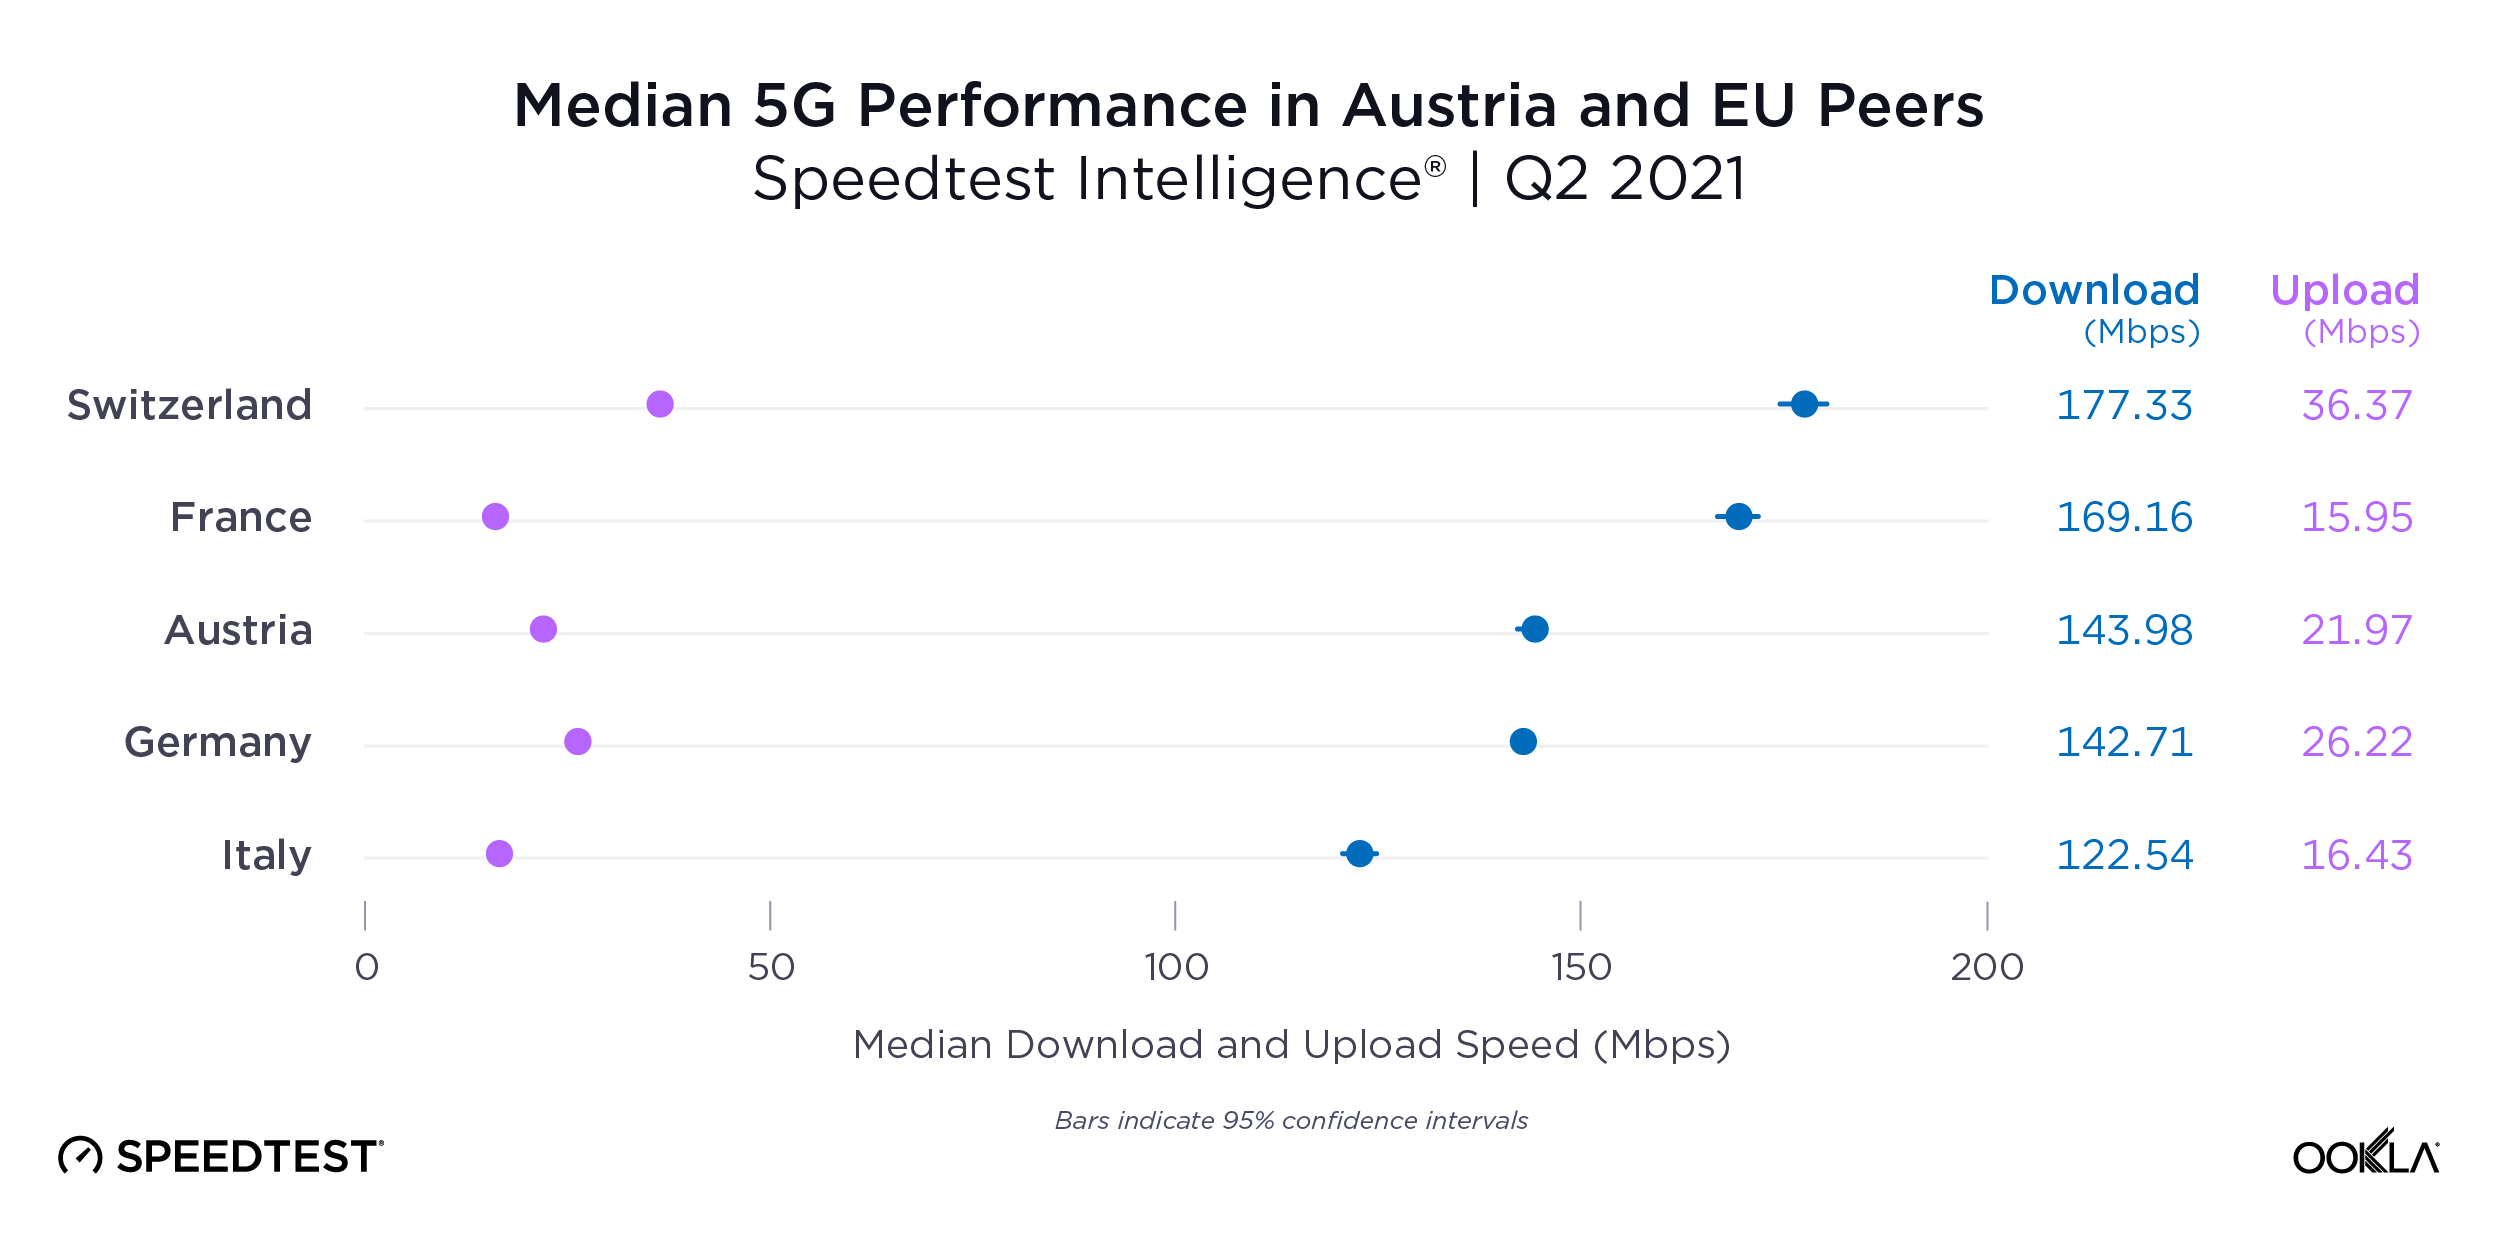
5G performance has seen some wild swings over the past year in Austria and its European peer countries in the region. Switzerland ended Q2 2021 with the fastest median 5G download speed on this list at 177.33 Mbps, followed by France (169.16 Mbps), Austria (143.98 Mbps), Germany (142.71 Mbps) and Italy (122.54 Mbps).
ookla_5g_performance_eu_0921_en-1

Switzerland was also fastest for median upload speed over 5G during Q2 2021 at 36.37 Mbps, followed by Germany (26.22 Mbps), Austria (21.97 Mbps), Italy (16.43 Mbps) and France (15.95 Mbps). We often see 5G speeds decline after the initial launch period as more users adopt the technology, which adds congestion to cell sites. Additionally, the use of Dynamic Spectrum Sharing (DSS) allows operators to expand 5G coverage through the use of existing spectrum bands and incorporates bands at lower frequencies that can lead to slower median speeds.

Drei Austria was the fastest operator in Austria for 5G

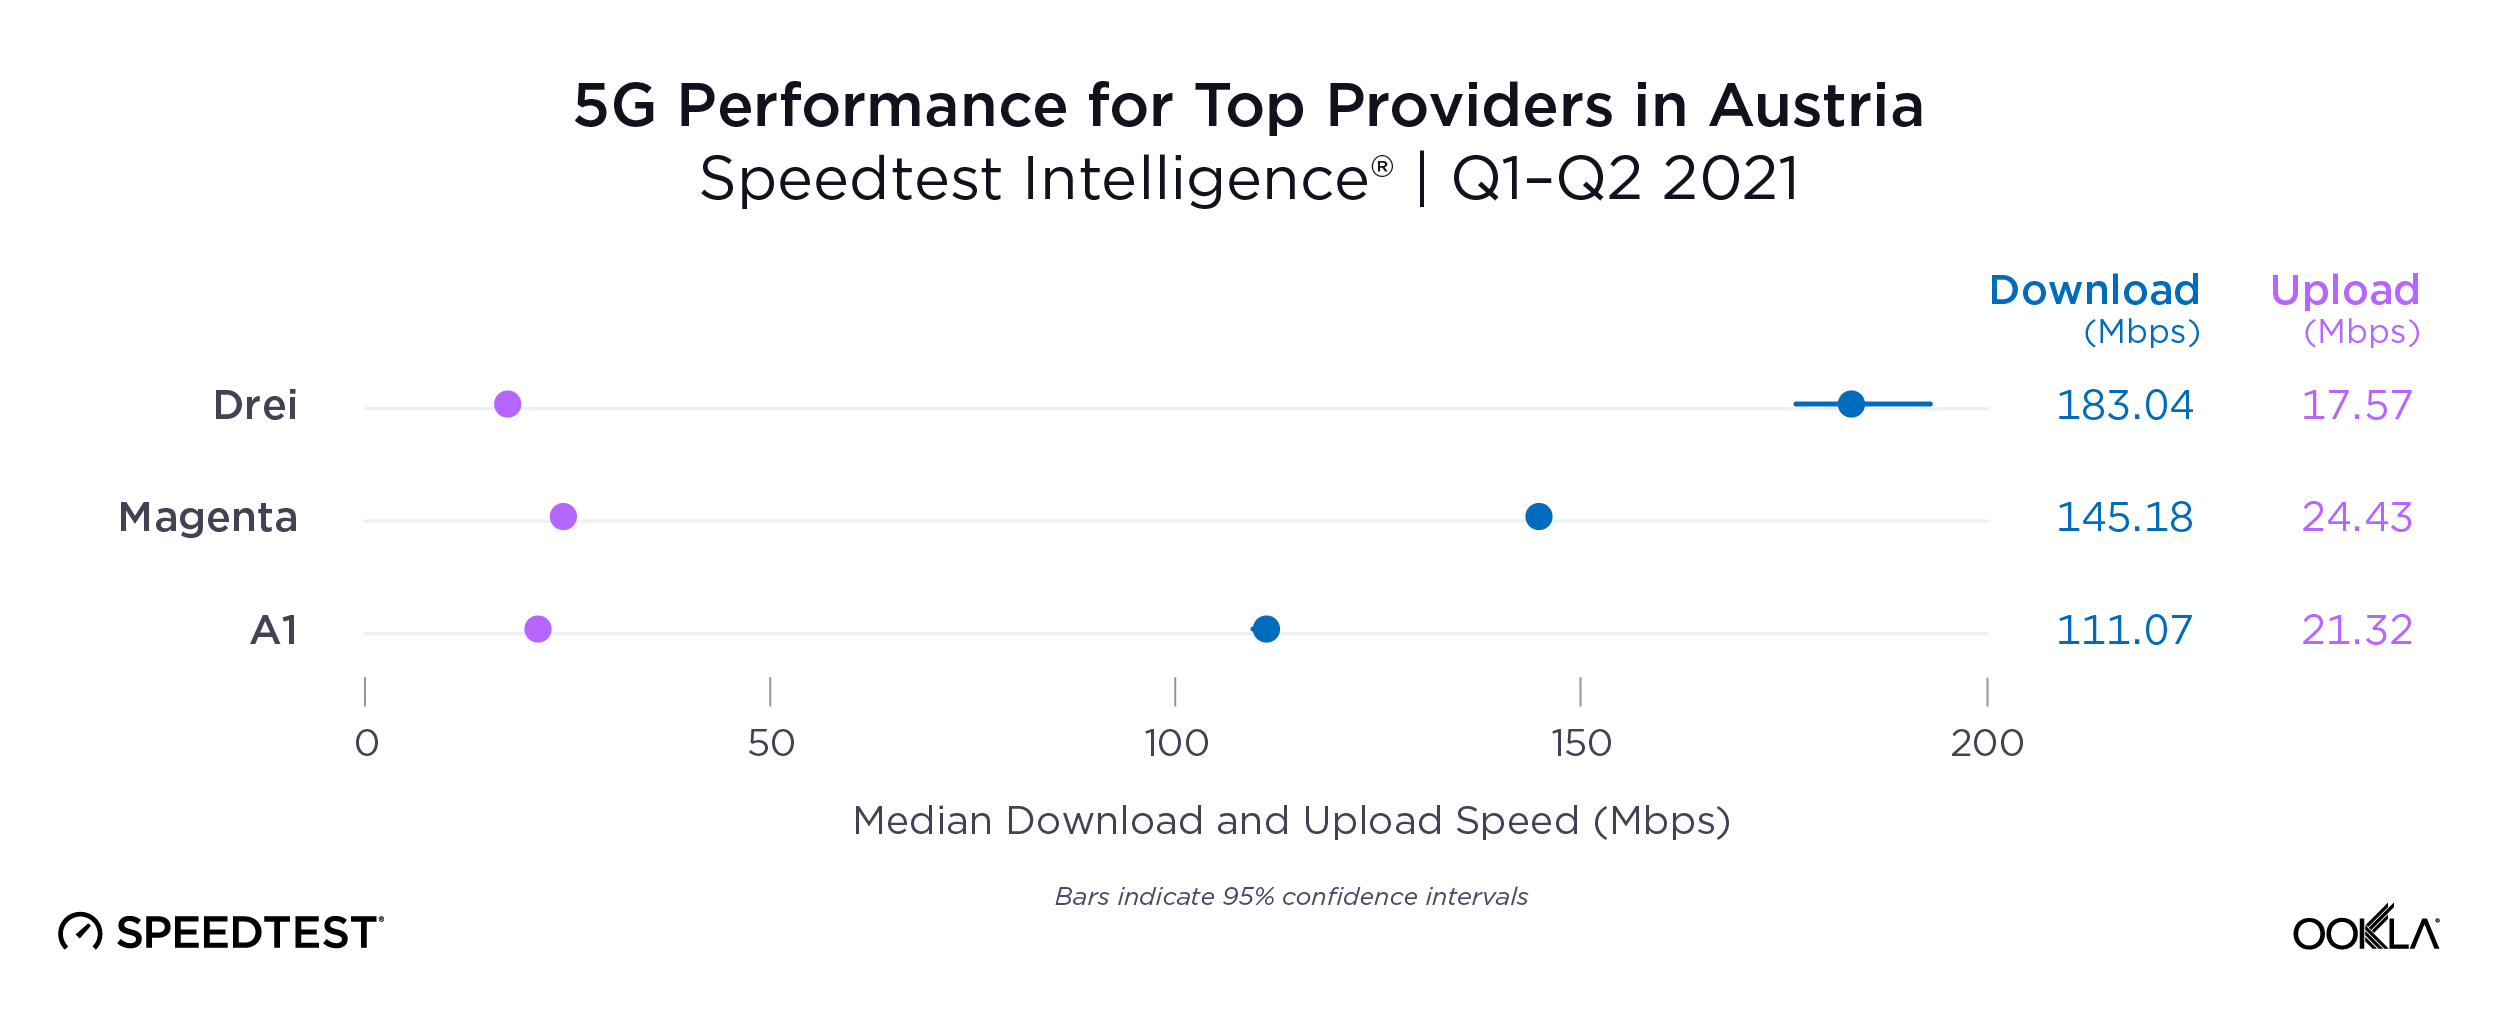
5G performance varied widely among Austria’s top providers during Q1-Q2 2021 but Drei Austria had the fastest median 5G download speed at 183.04 Mbps. Accounting for statistical uncertainty, this was at least 21% faster than the nearest competitor. Magenta Telekom and A1 Telekom had slower 5G download speeds at 145.18 Mbps and 111.07 Mbps, respectively. For median 5G upload speeds, Magenta Telekom placed first at 24.43 Mbps.
ookla_5g_performance_providers_at_0921_en-1

Innsbruck trumps Vienna on 5G download and upload speeds

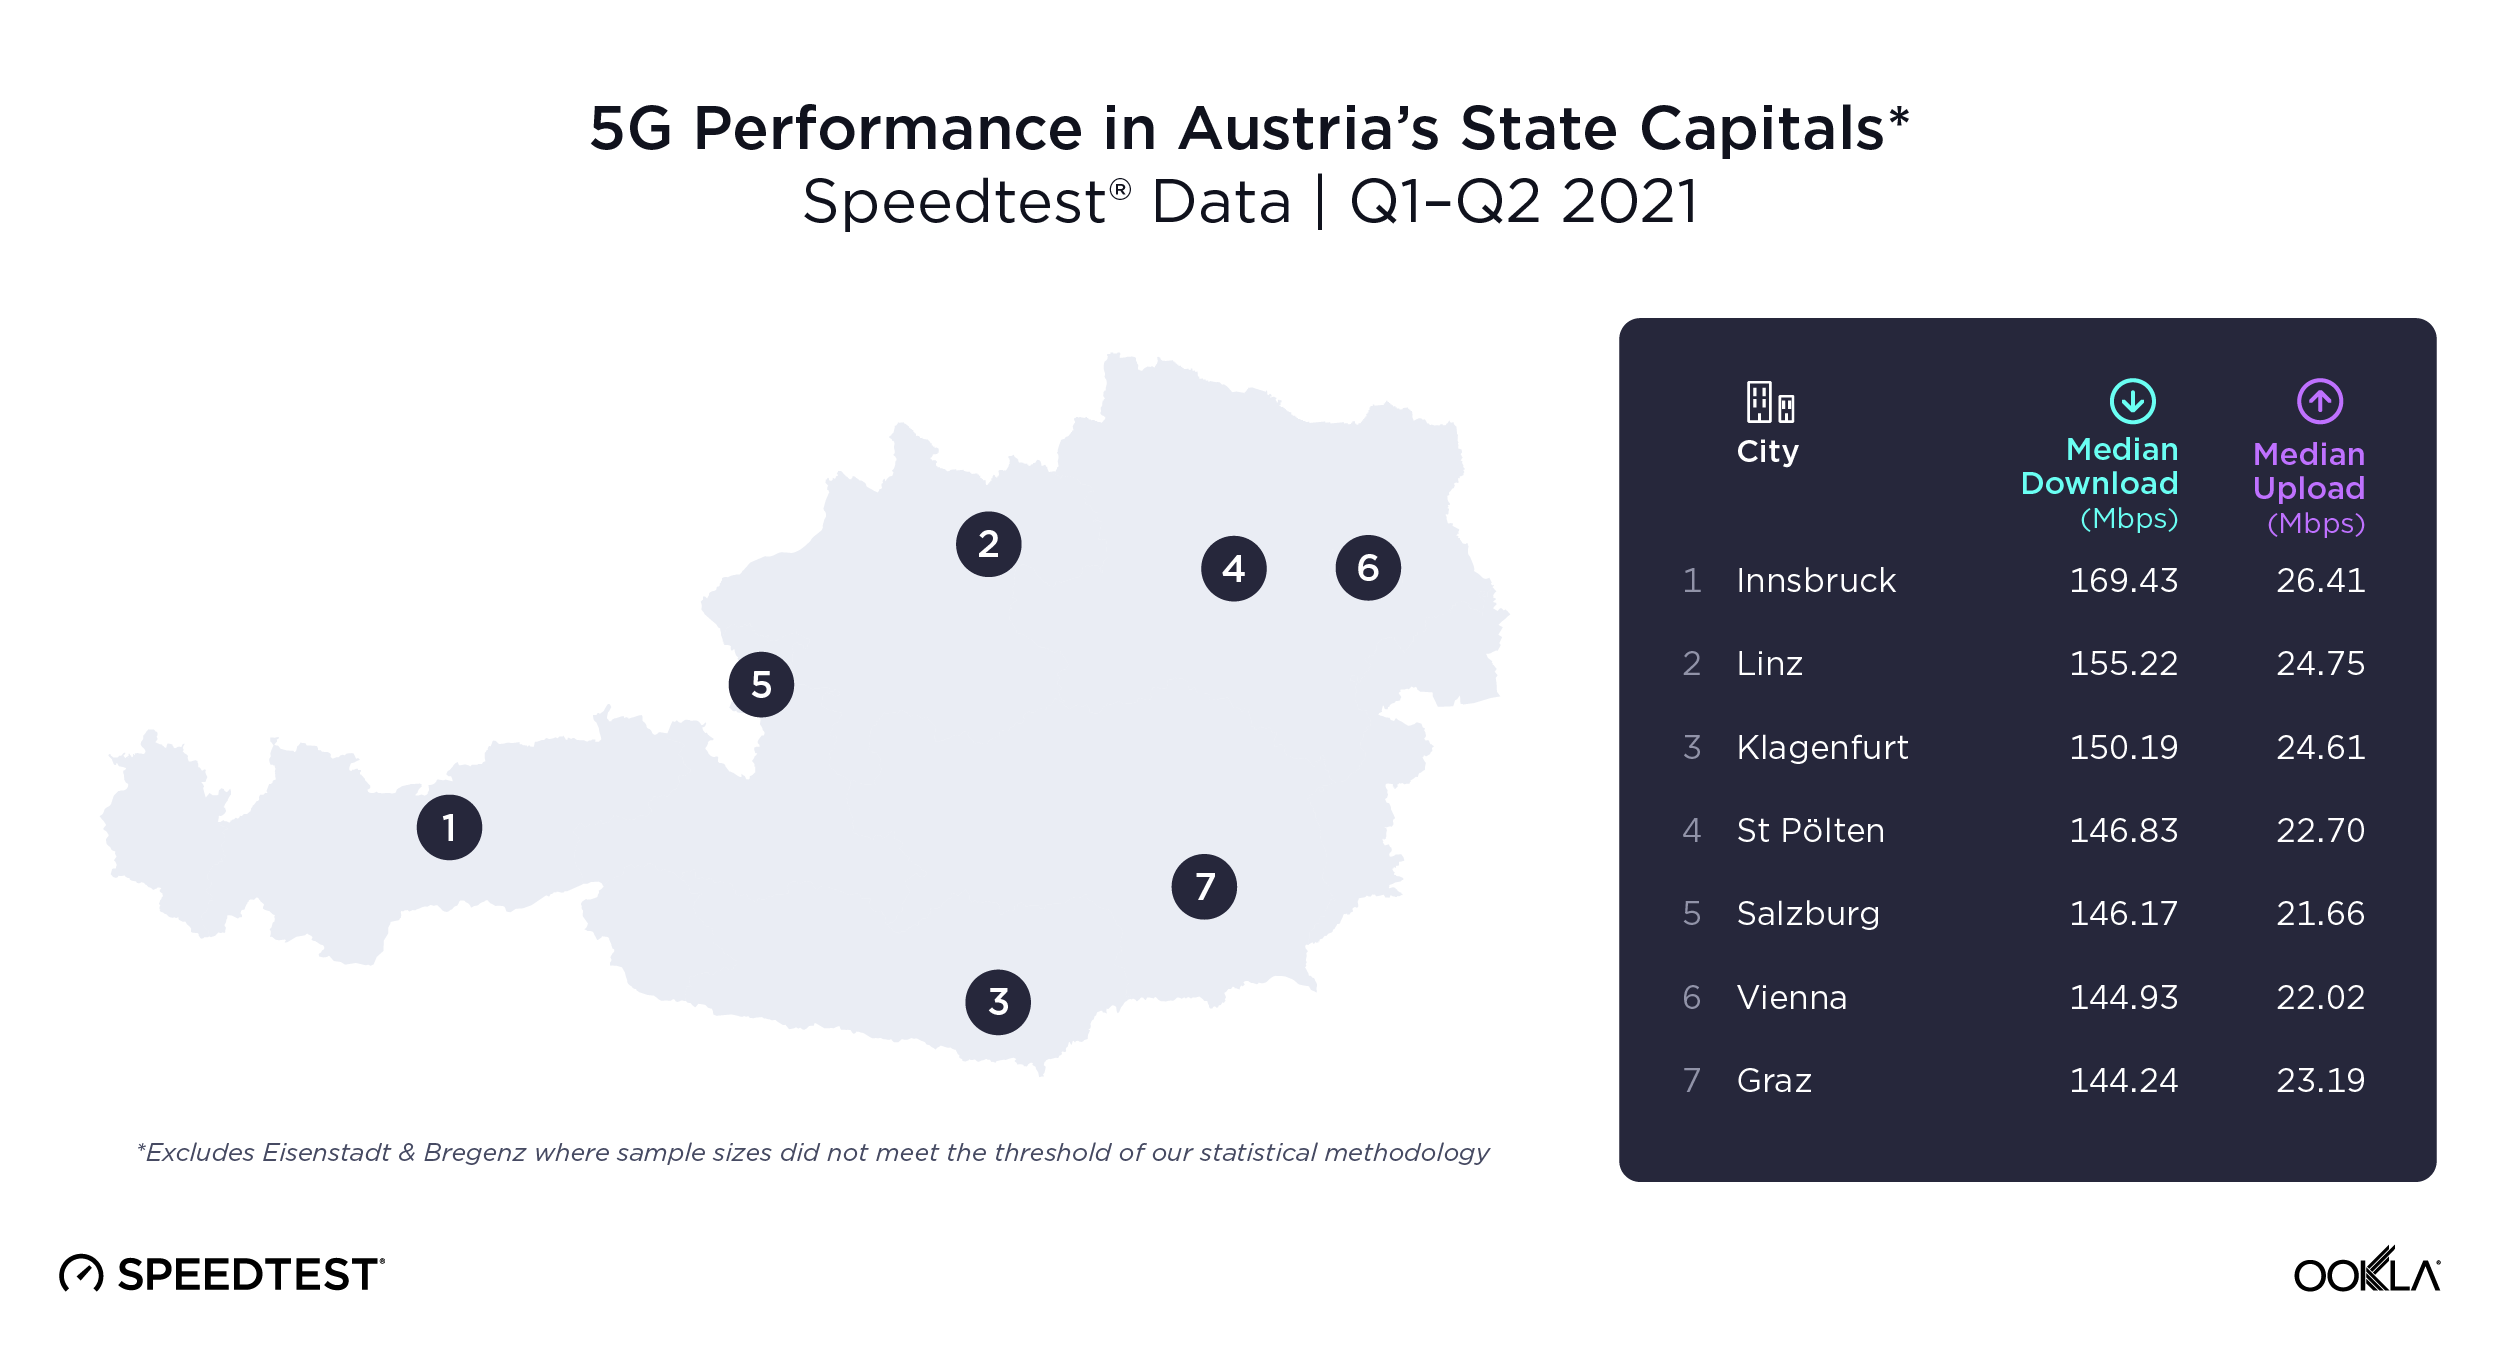
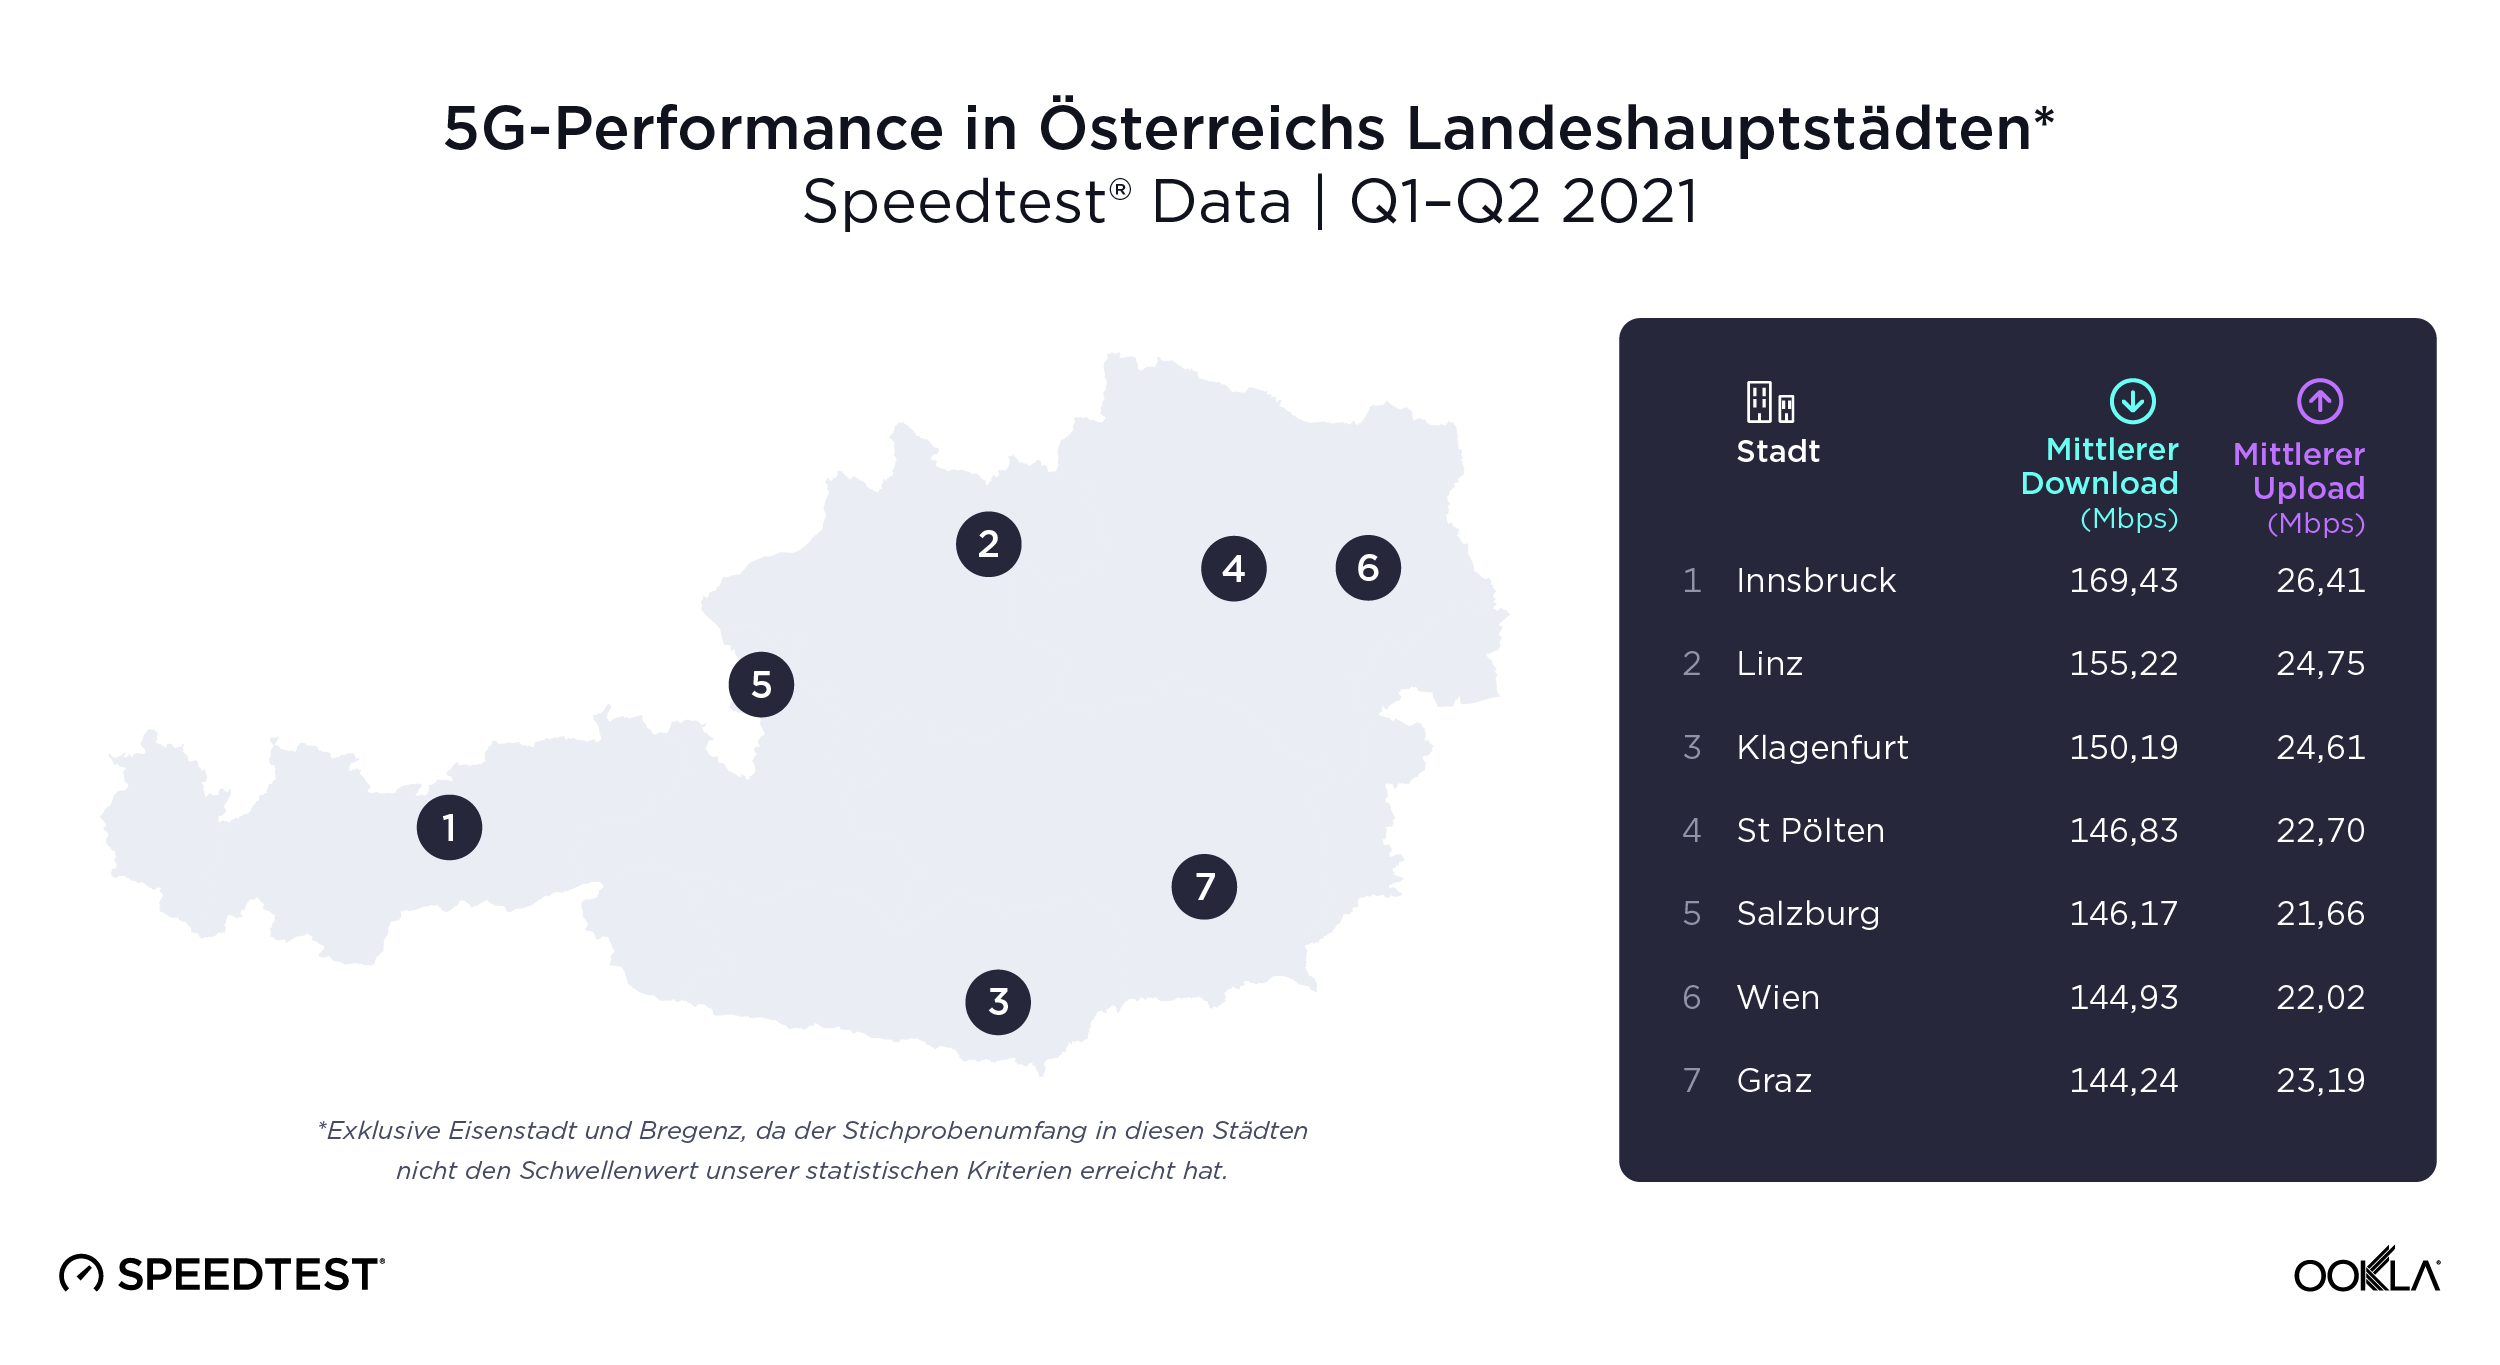
While there was no statistical winner among Austrian capitals, Innsbruck had a median 5G download speed at 169.43 Mbps, which was demonstrably faster than Vienna’s median download speed of 144.93 Mbps. Since there was no clear winner among all state capitals, this indicates operators’ 5G rollouts to date have not prioritized any single state capital, and that they are currently managing the balance between providing 5G capacity with demand on the new network. Within the capital Vienna, Drei Austria’s 5G network showed the fastest performance during Q1-Q2 2021 achieving a median download speed of 193.66 Mbps.
ookla_5g_performance_at_map_0921_en-1

Austria has clearly seen a ramp up in mobile network speeds with the arrival of 5G. We’ll be interested to see if other providers make the necessary investments to catch up to Drei. This could bring up speeds across the country and improve Austria’s standing relative to its peers in the Speedtest Global Index, where it ranked 31st for mobile speed in July 2021. Learn more about how Speedtest Intelligence can help you benchmark your 5G performance against competitors.


5G in Österreich im Performance-Test zwei Jahre nach dem Start

Österreich gilt als einer der 5G-Pioniermärkte in Europa. Bereits im April 2018 verkündete Österreich seine 5G-Strategie, die inzwischen in die nationale Breitbandstrategie 2030 integriert wurde. Diese Strategie enthält eine Reihe von 5G-Zielen: eine Verpflichtungen zu ersten frühzeitigen 5G-Tests, die mittlerweile bereits umgesetzt Einführung von 5G in allen Landeshauptstädten zum Zeitpunkt Ende 2020, die Abdeckung aller Hauptverkehrswege des Landes bis Ende 2023 und eine landesweite 5G-Versorgung bis Ende 2025.

Zwei Jahre nach dem kommerziellen 5G-Start in Österreich haben wir unsere Speedtest Intelligence® Daten aus Q1-Q2 2021 analysiert, um zu sehen, wie sich die Performance von 5G im Land entwickelt hat. Wir haben untersucht, wie die 5G-Netze der Betreiber im ganzen Land abschneiden, und die 5G-Übertragungsraten jenen vergleichbarer europäischer Länder in der Region gegenübergestellt.

Frequenzauktionen machen Weg frei für Österreichs 5G-Markt

Trotz COVID-19-bedingter Verzögerungen hat die österreichische Regulierungsbehörde die Versteigerung der Frequenzbänder für 5G mittlerweile abgeschlossen. Bei der ersten Auktion Anfang 2019 erwarben alle drei nationalen Mobilfunkbetreiber zusammenhängende Bänder, die mindestens den von der EU empfohlenen 80-100 MHz im C-Band entsprechen. Eine nachfolgende Multi-Band-Auktion, die auch Frequenzen im 700-MHz-Band umfasste, wurde im September 2020 durchgeführt und beinhaltete Verpflichtungen zur Abdeckung einer Reihe von Not-Spots (Gebiete ohne mobile Breitbandabdeckung) und von partiellen Not-Spots (Gebiete mit Abdeckung durch nur einen Netzbetreiber).

Der Zugang zu großen, zusammenhängenden Frequenzblöcken im wichtigen C-Band wird es den österreichischen Betreibern ermöglichen, ihre Frequenzressourcen effizienter zu nutzen und 5G-Anwendungsfälle mit hoher Bandbreite und geringer Latenz noch besser zu unterstützen. Österreich scheint hierfür auch bereits mit 5G standalone (SA)-Netzen voranzukommen. Drei Austria hat kürzlich einen Test in der Hauptstadt Wien angekündigt und plant, schon im Frühjahr 2022 ein kommerzielles 5G SA-Netz in Betrieb zu nehmen. Zugleich beklagen die Betreiber jedoch, dass die hohen Kosten für die Anmietung von Mobilfunkmasten die Einführung von 5G verlangsamt haben.

Schweiz mit schnellstem 5G unter Österreichs Peers in Q1-Q2 2021

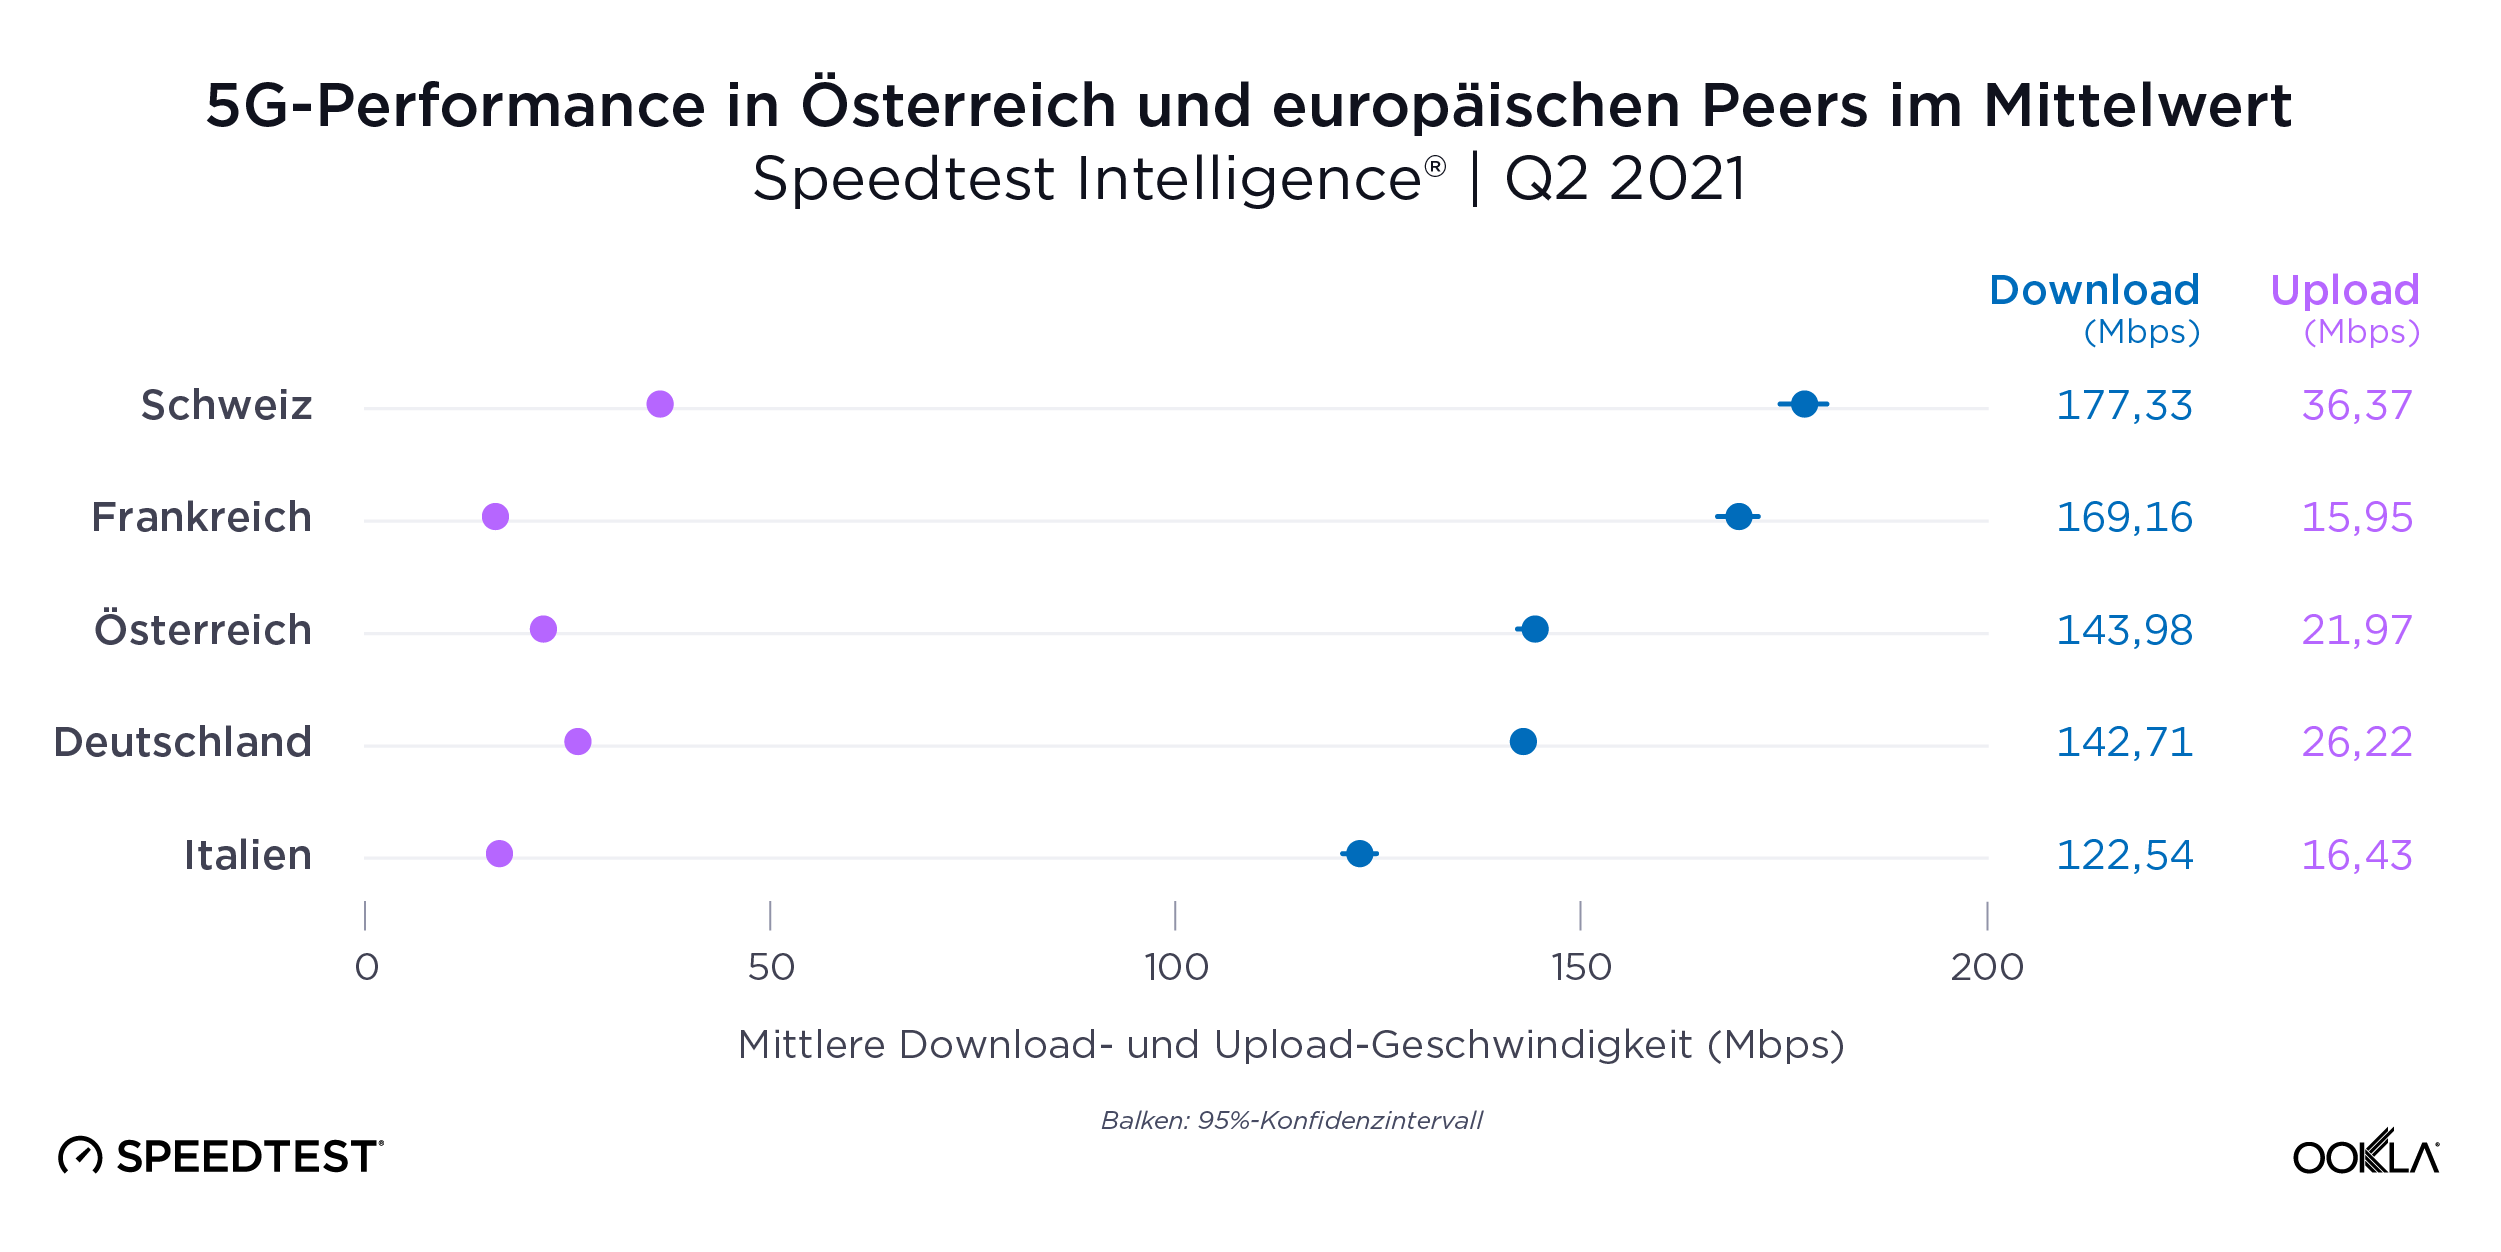
Die 5G-Performance hat im vergangenen Jahr in Österreich und anderen vergleichbaren europäischen Ländern in der Region stark geschwankt. Im Q2 2021 hatte die Schweiz die Nase vorne mit einer mittleren 5G-Download-Geschwindigkeit von 177,33 Mbps, gefolgt von Frankreich (169,16 Mbps), Österreich (143,98 Mbps), Deutschland (142,71 Mbps) und Italien (122,54 Mbps).
ookla_5g_performance_eu_0921_de-1

Auch bei den Upload-Raten erreichte die Schweiz in Q2 2021 mit 36,37 Mbit/s bei 5G den besten Mittelwert, gefolgt von Deutschland (26,22 Mbit/s), Österreich (21,97 Mbit/s), Italien (16,43 Mbit/s) und Frankreich (15,95 Mbit/s). Nach der anfänglichen Einführungsphase sinken die 5G-Geschwindigkeiten häufig, denn die Zahl der 5G-Kunden steigt allmählich an, was zu einer stärkeren Belastung der Mobilfunkstandorte führt. Außerdem nutzen die Betreiber zunehmend bestehende Frequenzbänder für 5G mittels Dynamic Spectrum Sharing (DSS). Die Betreiber sind so in der Lage, die 5G-Abdeckung zu erweitern und niedrigere Frequenzbänder einzubeziehen. Die durchschnittliche Übertragungsgeschwindigkeit kann sich dadurch verlangsamen.

Drei mit schnellstem 5G-Netz in Österreichs in Q1-Q2 2021

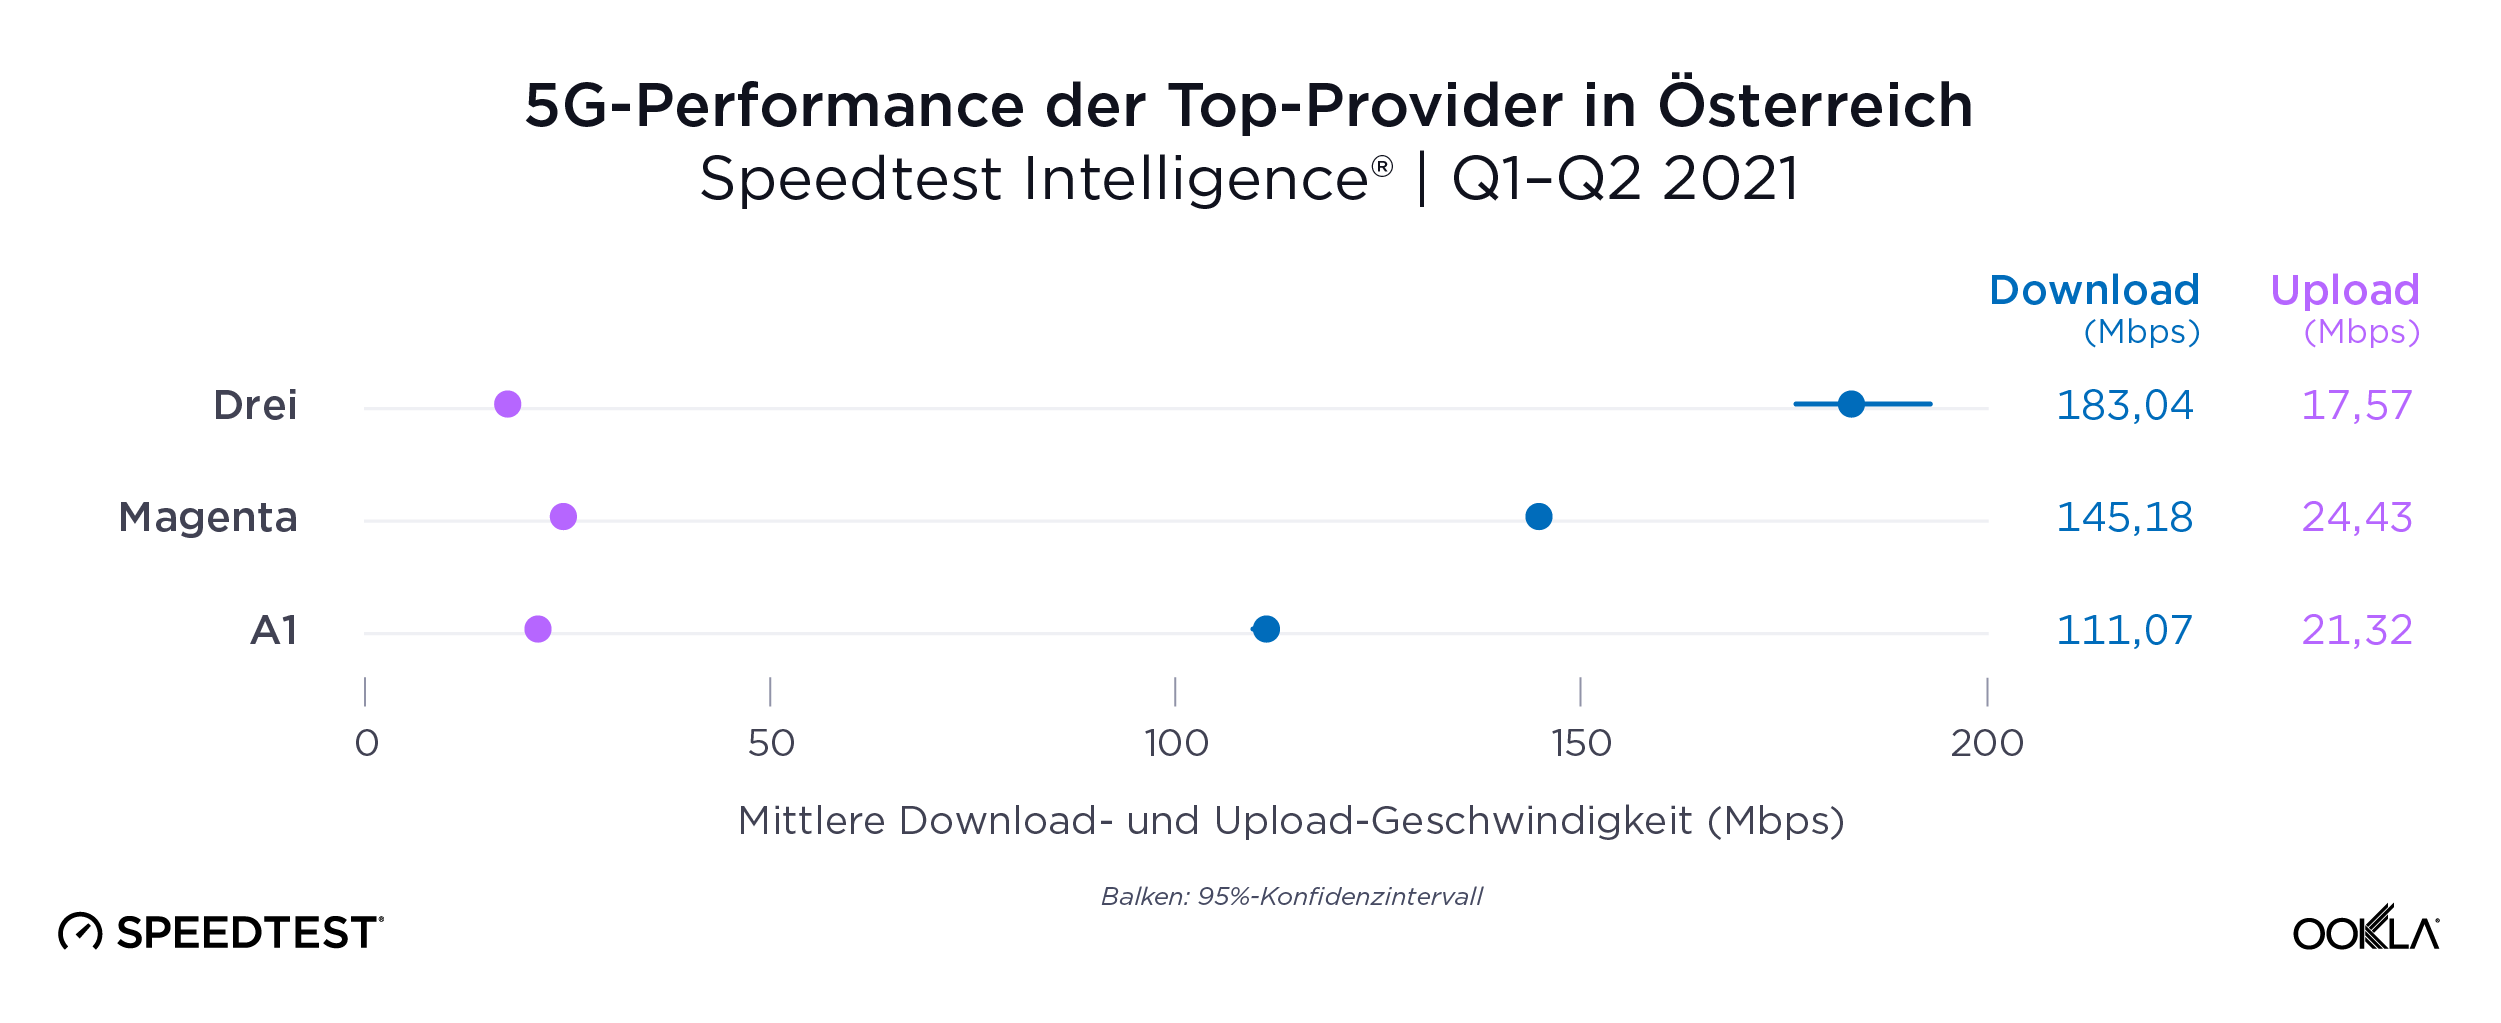
Die 5G-Performance hat in Q1-Q2 2021 zwischen den österreichischen Top-Providern stark variiert. Drei Austria hatte mit 183,04 Mbit/s im Mittelwert die schnellste 5G-Download-Geschwindigkeit. Unter Berücksichtigung der statistischen Schwankungsbreite war das 5G Netz von Drei damit mindestens 21 % schneller als jenes des nächsten Mitbewerbers. Magenta Telekom und A1 Telekom erreichten langsamere 5G-Download-Geschwindigkeiten von 145,18 Mbit/s bzw. 111,07 Mbit/s. Bei der mittleren 5G-Upload-Rate lag Magenta Telekom mit 24,43 Mbit/s an erster Stelle.
ookla_5g_performance_providers_at_0921_de-1

Innsbruck übertrumpft Wien bei 5G-Download- und Upload

Unter den österreichischen Landeshauptstädten zeigte sich statistisch betrachtet kein eindeutiger Gewinner. In der mittleren Download-Geschwindigkeit war 5G in Innsbruck mit 169,43 Mbit/s aber augenscheinlich schneller als Wien mit 144,93 Mbit/s. Dass es keinen eindeutigen Gewinner unter den Landeshauptstädten gab, lässt darauf schließen, dass die Betreiber beim 5G-Rollout bisher keine Region signifikant priorisiert haben und dass ihnen derzeit eine gute Balance zwischen der Bereitstellung von 5G-Kapazität und der Nachfrage im neuen Netz gelingt.

In der Hauptstadt Wien erreichte das 5G-Netz von Drei Austria in Q1-Q2 2021 die schnellsten Übertragungsraten mit einer mittleren Download-Geschwindigkeit von 193,66 Mbit/s.
ookla_5g_performance_at_map_0921_de

Die Geschwindigkeit der Mobilfunknetze in Österreich hat sich mit der Einführung von 5G deutlich erhöht. Wir sind gespannt, ob die anderen Anbieter die notwendigen Investitionen tätigen, um zu Drei aufzuschließen. Das könnte die Internet-Geschwindigkeiten im ganzen Land erhöhen und Österreichs Position im Vergleich zu anderen Ländern im Speedtest Global Index verbessern. Zuletzt lag Österreich im Juli 2021 bei der Mobilfunk-Geschwindigkeit auf Platz 31. Erfahren Sie mehr darüber, wie Speedtest Intelligence Ihnen helfen kann, Ihre 5G-Leistung mit jener Ihrer Wettbewerber zu vergleichen.

Ookla retains ownership of this article including all of the intellectual property rights, data, content graphs and analysis. This article may not be quoted, reproduced, distributed or published for any commercial purpose without prior consent. Members of the press and others using the findings in this article for non-commercial purposes are welcome to publicly share and link to report information with attribution to Ookla.

| November 30, 2021

5G in Europe: EU Targets Require a Rethink

Monitoring progress of the EU’s Digital Decade

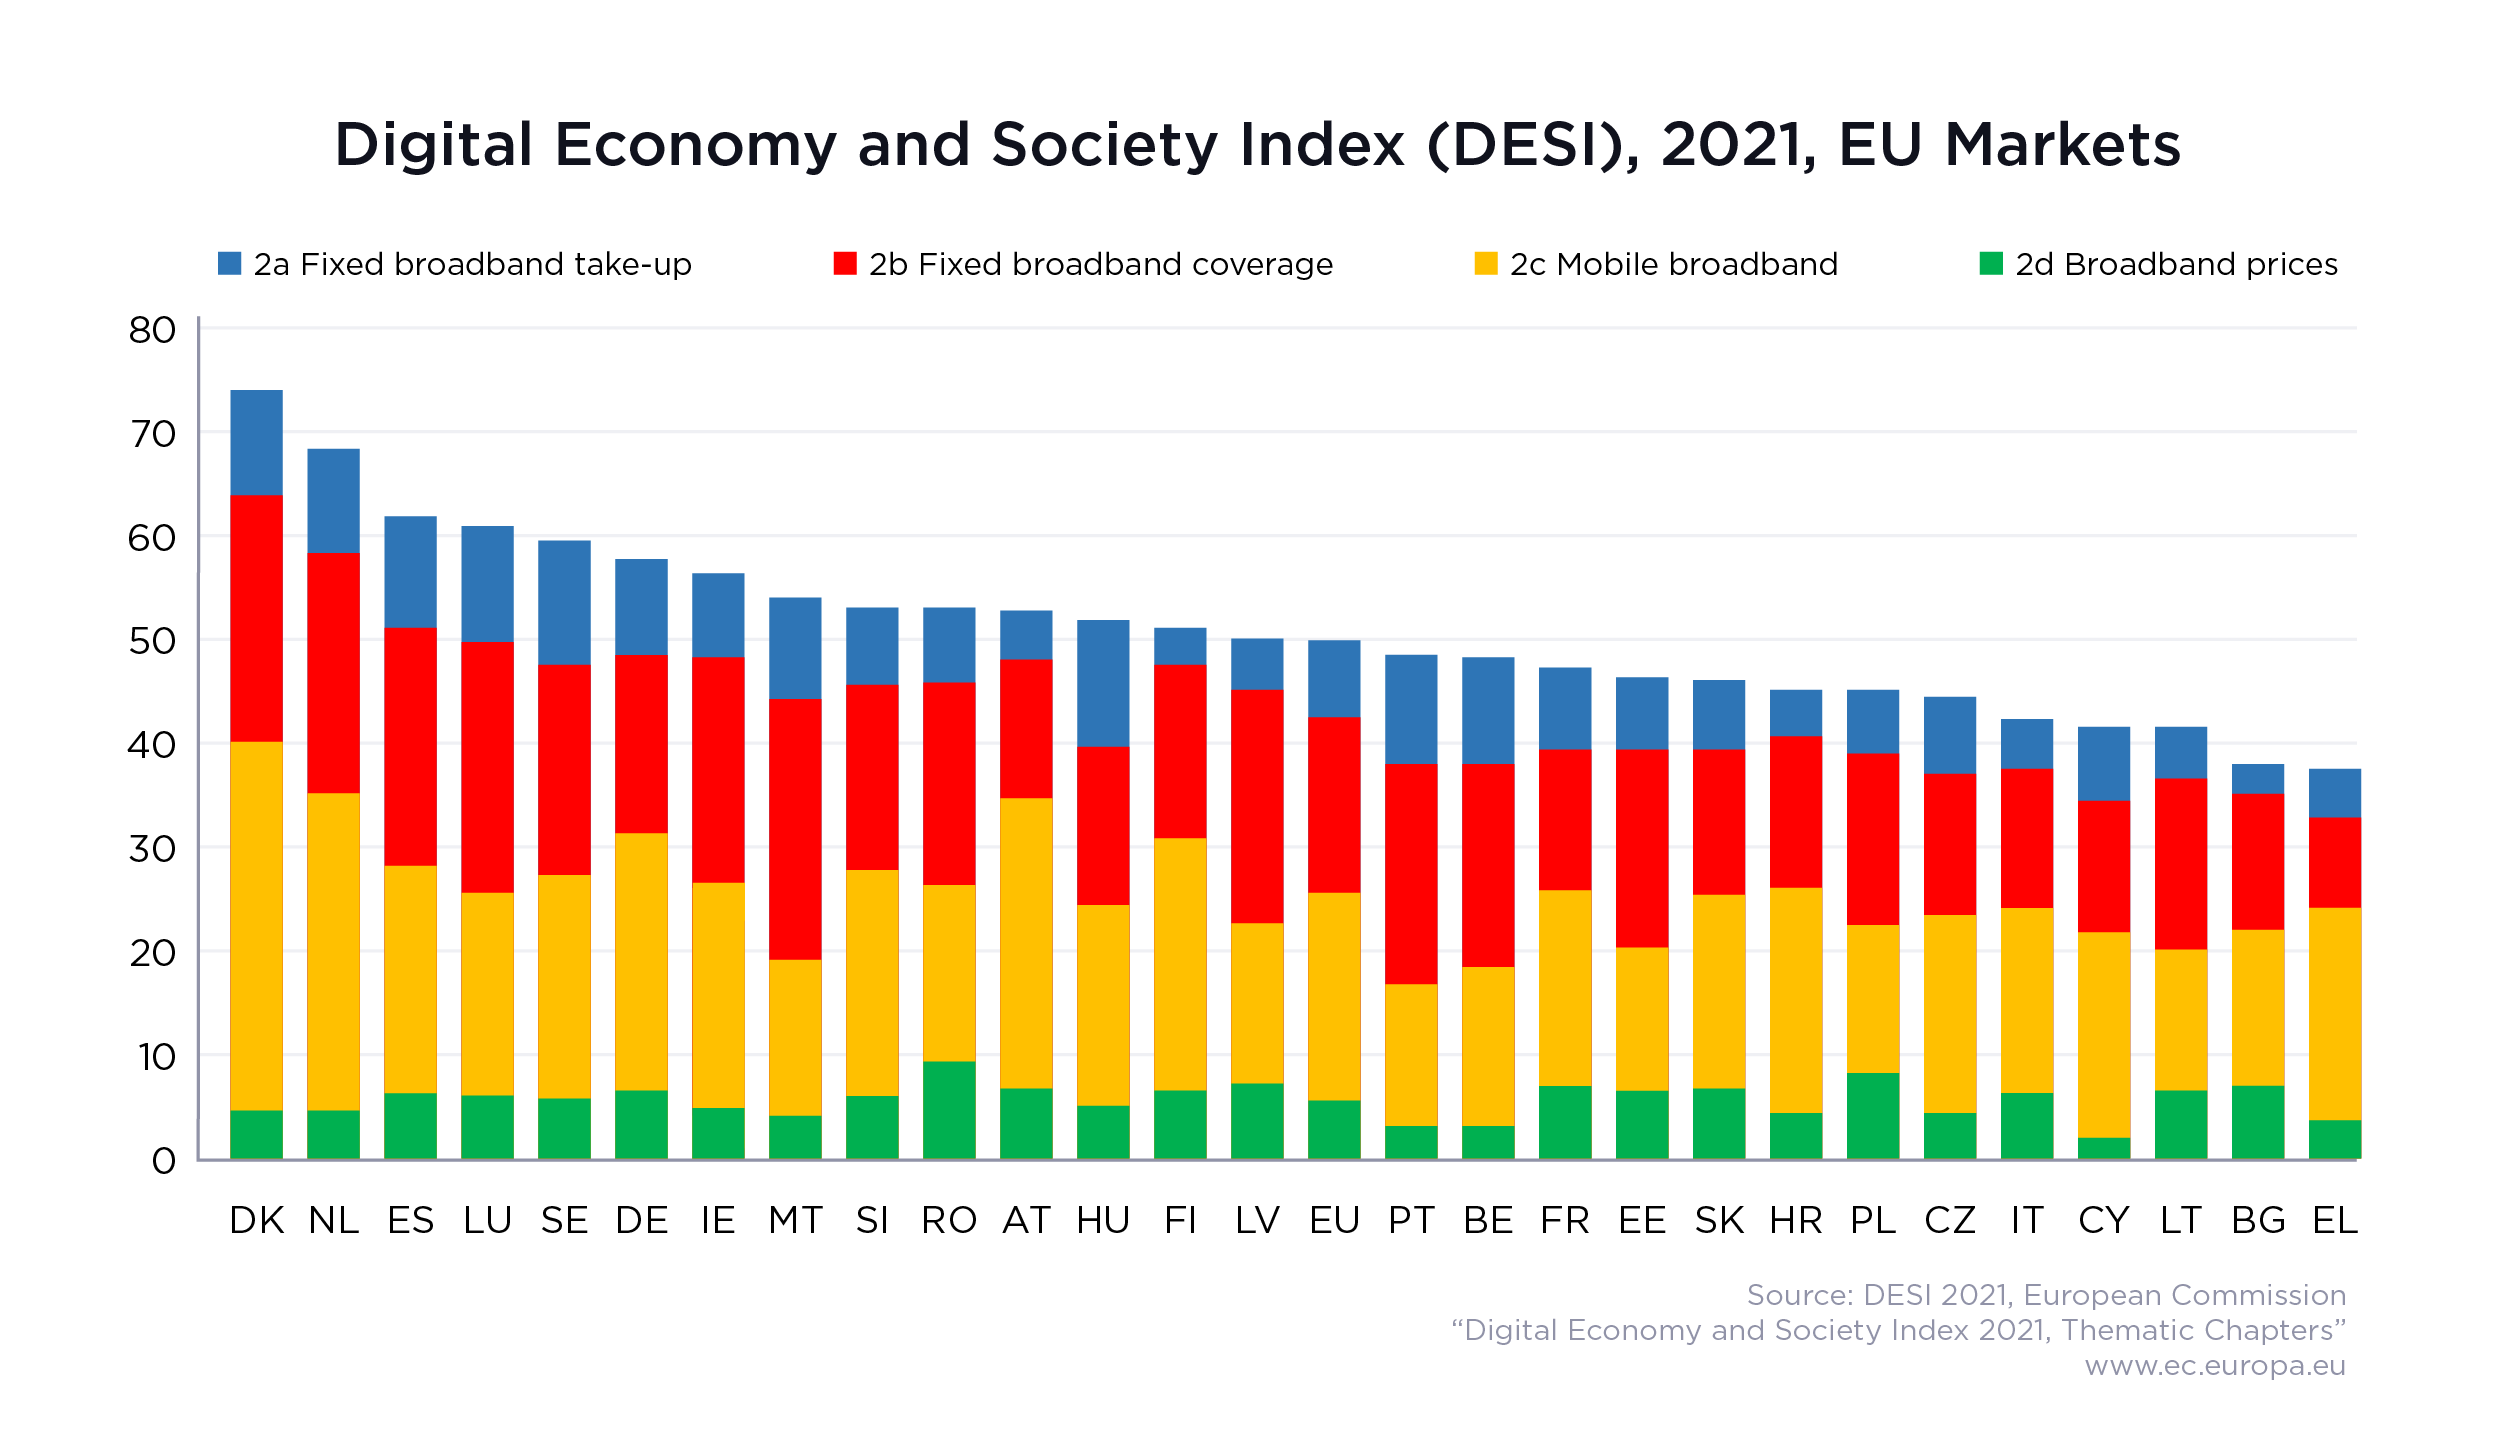
We recently attended the European 5G Observatory’s workshop, “5G in the Digital Decade,” which provided an overview of progress towards the EU’s 5G Action Plan targets and also looked ahead to the new targets as set out in the EU Digital Decade. The European Commission presented its vision of the region’s Digital Decade in March 2021, providing targets (the Digital Compass) for the digital transformation of Member States by 2030. Progress towards these targets is measured through the existing Digital Economy and Society Index (DESI), a key component of which focuses on connectivity. The relevant 2030 goals here are to provide Gigabit access to all EU households and 5G coverage in all populated areas.

The connectivity component of DESI is made up of a mix of demand and supply-side factors, including fixed and mobile broadband coverage and take-up, 5G spectrum availability and broadband pricing. The latest iteration was published in November using 2020 data, with Denmark, the Netherlands and Spain securing the top three spots for connectivity, and Greece and Bulgaria the bottom two.

ookla_desi_eu_markets_1121-01

As 5G evolves, so should the Commission’s 5G targets

The Commission’s DESI has evolved from its inception in 2014 to now track the Digital Compass’ targets. However, 5G is a rapidly evolving technology, and it was clear from the discussion during the Observatory’s workshop that there will be a need to review the actual targets and by implication the measurement criteria. The key concern lies in the “5G everywhere” target, both from a coverage and a performance perspective. As the end goal is the digital transformation of Member States, 5G coverage should be extended beyond the current target of all populated areas, to provide greater geographical coverage — in particular to support emerging vertical industry needs, for example in agriculture or logistics.

In terms of 5G performance, the ITU’s IMT-2020 requirements are for a user-experienced data rate of 100 Mbps download and 50 Mbps upload. However, not all 5G networks are created equally. The increasing use of dynamic spectrum sharing (DSS) means that operators can boost 5G coverage and capacity by using existing spectrum formerly dedicated to other generations of mobile technology. As a result, network performance will vary widely based on the bands used. There are also differences in 5G rollout, with initial 5G radio equipment tending to be deployed on existing tower infrastructure, and the coverage of higher capacity C-band spectrum will be limited relative to that of lower frequency bands as result.

ookla_median-download-speeds_europe_1121-01

Divergence between the DESI and end-user internet speed

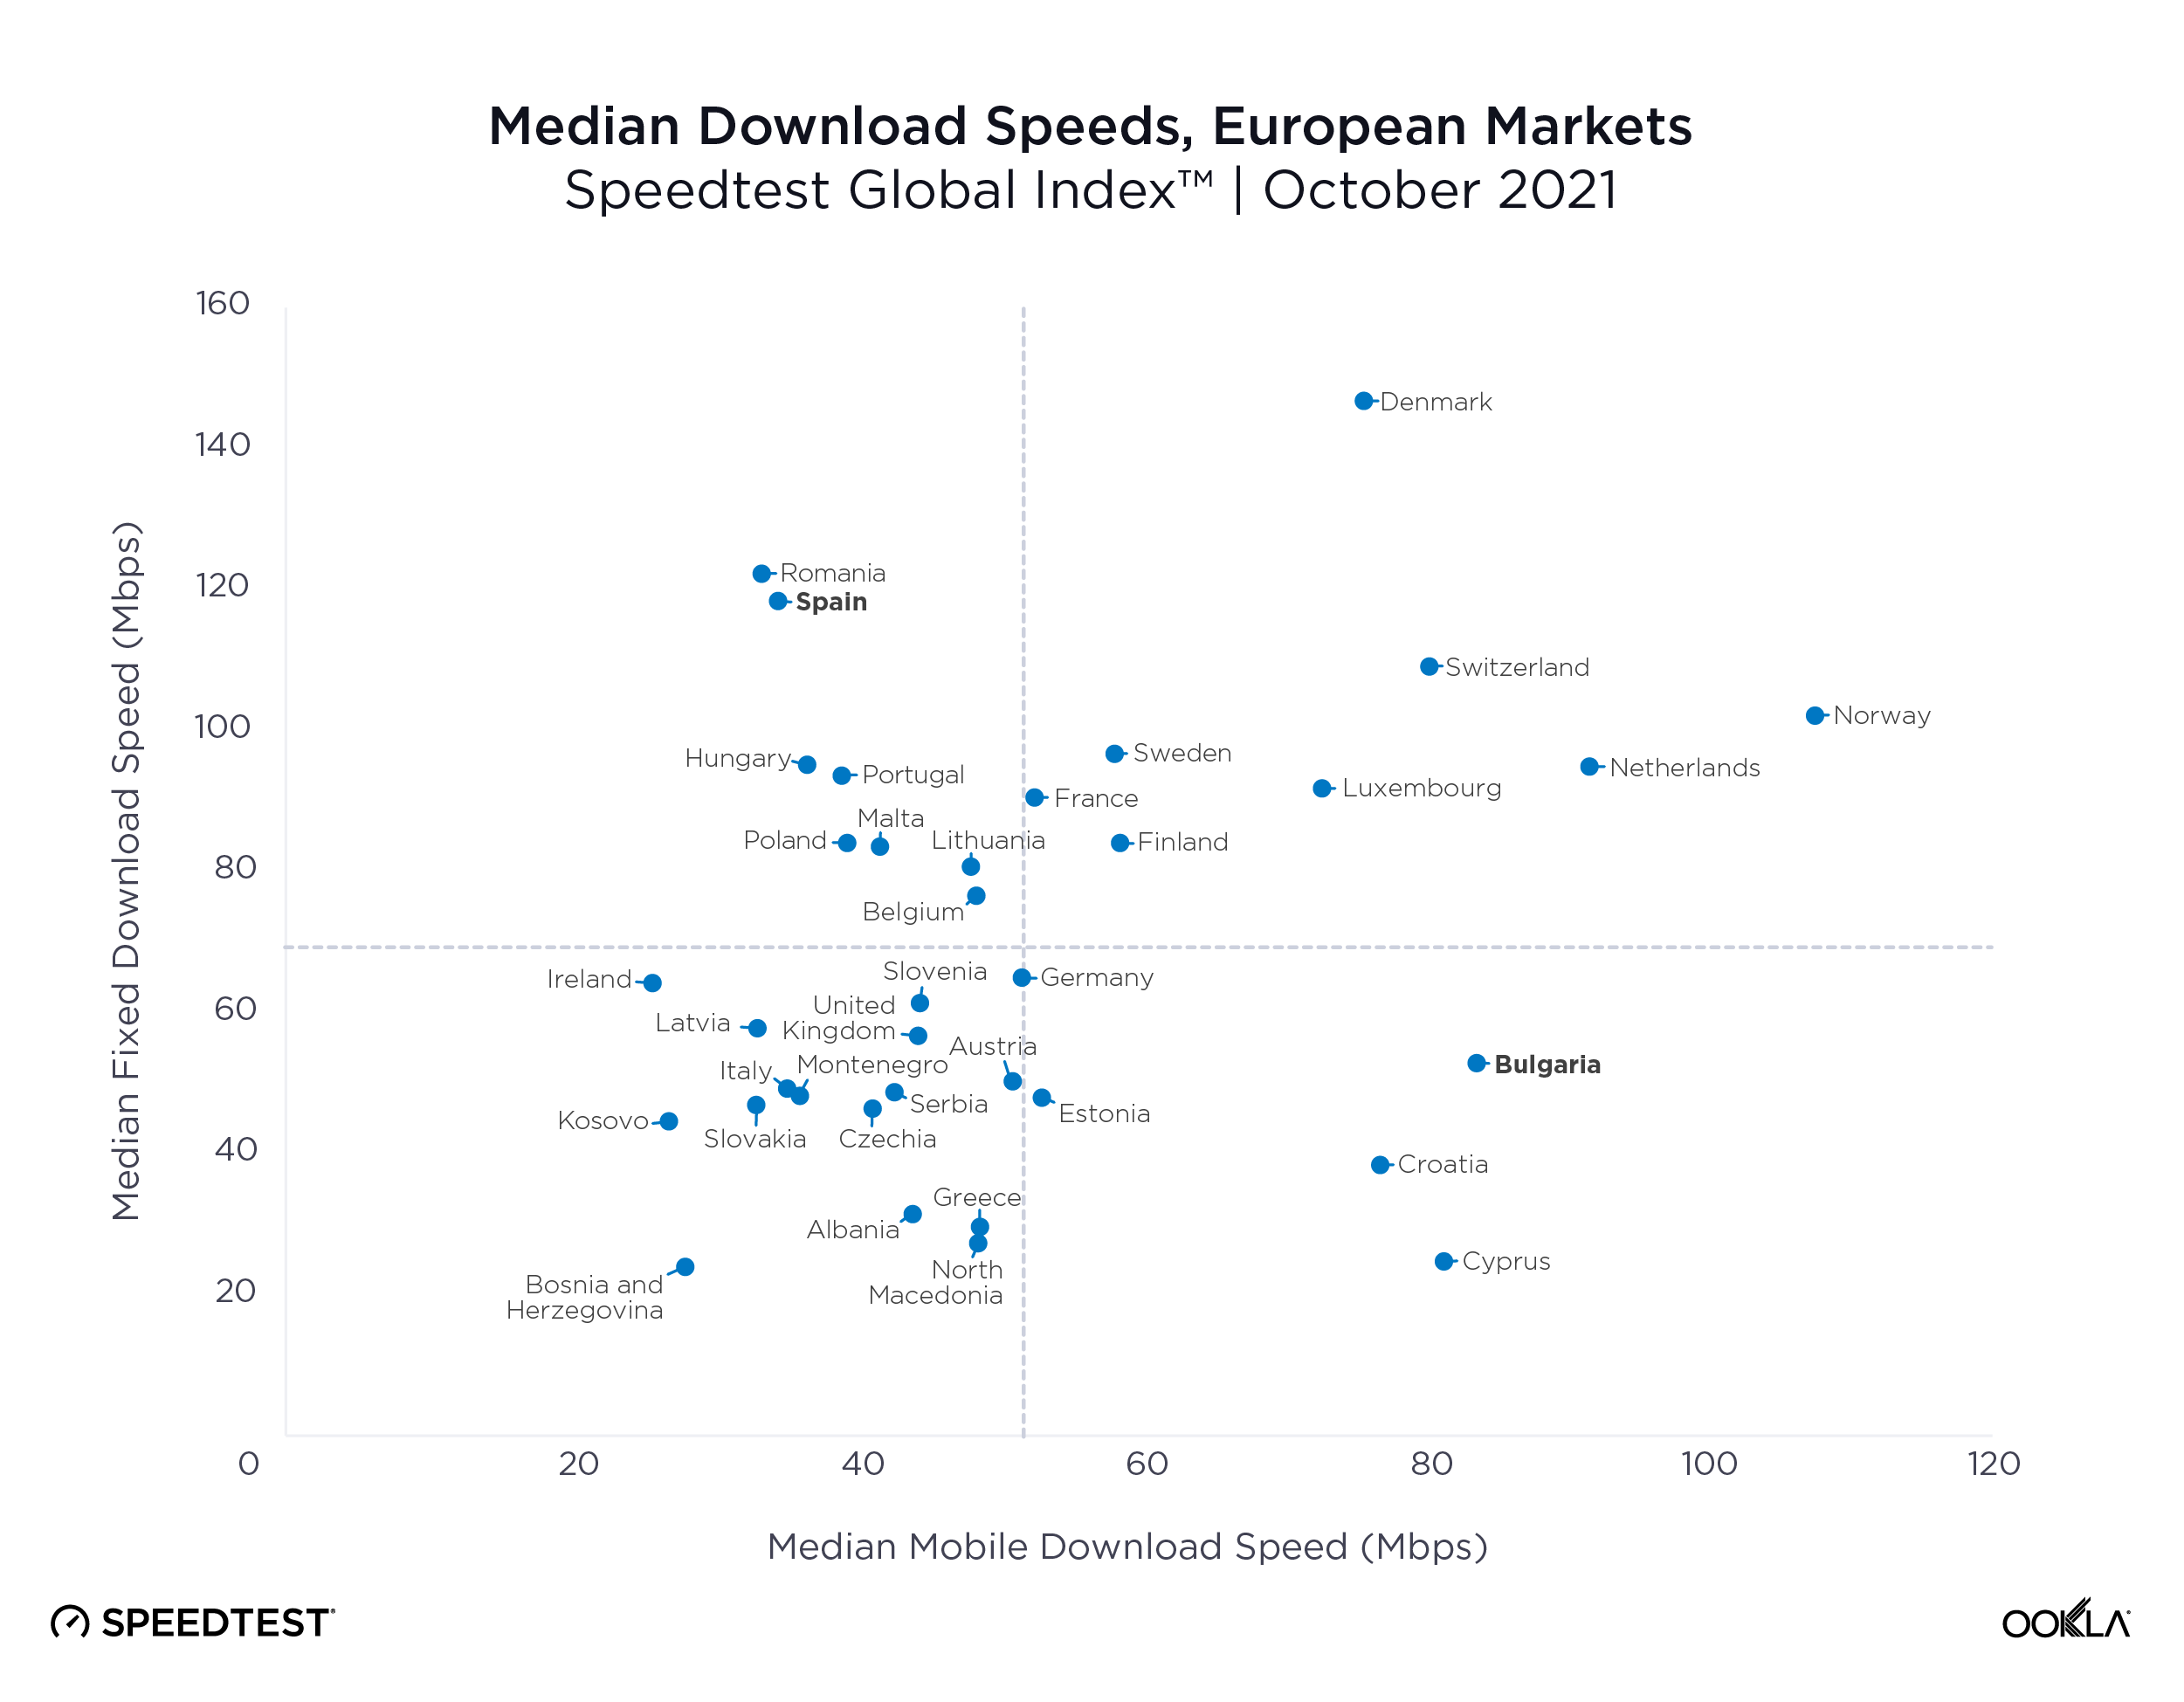
What’s also interesting are the outliers and how their performance differs from their position within the DESI. Bulgaria (which came second to last in the connectivity portion of the DESI), does lag behind the European average on fixed broadband speeds, but is significantly faster on mobile speeds. Bulgaria’s median mobile download speed of 83.71 Mbps makes it the seventh fastest market globally. The reverse is true for Spain, which came third in the DESI, and where median fixed download speeds of 118.25 Mbps are well above the European average, putting it in 11th place globally, but where mobile speeds of 34.63 Mbps lag well behind the European average, and place it 51st globally. Other examples of divergence between the DESI and actual internet speeds on the ground include markets such as Belgium, Cyprus, Estonia and Lithuania.

To support Member States, the Commission has proposed a “Path to the Digital Decade”, a governance framework which in addition to the development of roadmaps at a Member State level and regular reporting on progress, will also include a framework to address progress shortfalls and support for multi-country projects. Member States have been encouraged to make use of the Recovery and Resilience Facility, an EU-wide fund of EUR 723.8 billion designed to mitigate the impact of the COVID-19 pandemic, from which they are required to devote at least 20% of their allocation to digital projects. As of October 2021, digital investment plans totalled 26% of the fund, of which 11% is dedicated to connectivity. With such significant public funds directed at improving connectivity, and the digital services that it underpins, the Commission must ensure that its targets and measurement methodology keep pace with the evolution of network technologies.

Ookla retains ownership of this article including all of the intellectual property rights, data, content graphs and analysis. This article may not be quoted, reproduced, distributed or published for any commercial purpose without prior consent. Members of the press and others using the findings in this article for non-commercial purposes are welcome to publicly share and link to report information with attribution to Ookla.

| December 20, 2021

Growing and Slowing: The State of 5G Worldwide in 2021


5G continues to offer new and exciting ways of rethinking everything from streaming video to performing remote surgery. However, not everyone shares equally in these possibilities as many countries do not have access to 5G and even those that do, do not experience the same level of performance from their 5G connections. We examined Speedtest Intelligence® data from Q3 2021 Speedtest® results to see how 5G speeds have changed, where download speeds are the fastest at the country and capital level, where 5G deployments have increased and what worldwide 5G Availability looked like in Q3 2021. We also looked at countries that don’t yet have 5G to understand where consumers are seeing improvements in 4G access.

5G slowed down at the global level

Median-Speeds-Worldwide_1221-01

It’s common to see new mobile access technologies slow down as adoption scales, particularly early on in the tech cycle. Over the past year from Q3 2020 to Q3 2021, the median global 5G download speed fell to 166.13 Mbps, down from 206.22 Mbps in Q3 2020. Median upload speed over 5G also slowed to 21.08 Mbps (from 29.52 Mbps) during the same period.

More users are logging on to existing 5G networks, and we’re also at the stage in the evolution of 5G where countries that have historically had slower speeds are starting to offer 5G. In addition, the widespread use of dynamic spectrum sharing that has been used to boost early 5G coverage weighs on 5G download speeds. While the dip in speeds looks like a letdown, it’s more of a compromise to enable broader access. With additional spectrum and further deployments slated for 2022, we anticipate speeds will begin to pick up again.

South Korea had the fastest 5G in the world

ookla_5g-download_performance_countries_1221-01-1

South Korea had the fastest median download speed over 5G during Q3 2021, leading a top 10 list that included Norway, United Arab Emirates, Saudi Arabia, Qatar, Kuwait, Sweden, China, Taiwan and New Zealand. Sweden, China, Taiwan and New Zealand were new to the top 10 in 2021 while South Africa (whose 5G was brand new last year), Spain and Hungary fell out of the top 10.

5G expanded to 13 additional countries

ookla_5G-map_1221-01

According to the Ookla® 5G Map, there were 5G deployments in 112 countries as of November 30, 2021. That’s up from 99 countries on the same date a year ago. The total number of deployments increased dramatically during the same time period with 85,602 deployments on November 30, 2021 compared to 17,428 on November 30, 2020, highlighting the degree to which 5G networks scaled during the year. Note that there are often multiple deployments in a given city.

Seoul and Oslo lead world capitals for 5G

ookla_5g-download_performance_capitals_1221-01

Speedtest Intelligence data from Q3 2021 shows a wide range of median 5G speeds among global capitals. Seoul, South Korea and Oslo, Norway were in the lead with 530.83 Mbps and 513.08 Mbps, respectively; Abu Dhabi, United Arab Emirates; Riyadh, Saudi Arabia and Doha Qatar followed. Brasilia, Brazil had the slowest median download speed over 5G on our list, followed by Warsaw, Poland; Cape Town, South Africa and Rome, Italy. Stockholm, Sweden and Oslo, Norway had some of the the fastest median upload speeds over 5G at 56.26 Mbps and 49.95 Mbps, respectively, while Cape Town had the slowest at 14.53 Mbps.

The U.S. had the highest 5G Availability

The presence of 5G is only one indicator in a market, because even in markets where 5G has launched, coverage and adoption can be pretty low. We analyzed 5G Availability to see what percent of users on 5G-capable devices spent the majority of their time on 5G, both roaming and on-network during Q3 2021.

ookla_5g-availability_countries_1221-01

The United States had the highest 5G Availability at 49.2%, followed by the Netherlands (45.1%), South Korea (43.8%), Kuwait (35.5%) and Qatar (34.8%). Brazil had the lowest 5G Availability on our list at 0.8%, followed by Sweden (1.5%), South Africa (2.7%), New Zealand (2.9%) and Hungary (3.6%).

Not all 5G networks are created equal

Ookla Speedtest Intelligence data shows a growing disparity in the performance of 5G networks worldwide, even among the pioneer markets who were among the first to launch the new technology. We see leading markets such as South Korea, Norway, the UAE and China pulling well ahead of key European markets, the U.S. and Japan on 5G download speeds, creating what increasingly looks like two tiers of 5G markets.

ookla_5g-download_performance_1221-01

Part of the reason for this divergence is access to key 5G spectrum bands, with Verizon and AT&T in the U.S. for example, soon to deploy their C-band spectrum holdings for 5G use. However, what really seems to separate these markets is the level of 5G network densification. The number of people per 5G base station ranges from 319 in South Korea and 1,531 in China, to 4,224 in the EU and 6,590 in the US, according to the European 5G Observatory’s International Scoreboard during October 2021.

Despite the noise around 6G, 5G still has a long way to run

Median 5G mobile download speeds across these markets are respectable relative to the International Telecommunication Union’s (ITU) IMT-2020 target of 100 Mbps for user experienced download data rates. However, 5G Speedtest® results in each market demonstrate significant variability, with the bottom 10th percentile only recording speeds in excess of the IMT-2020 target in South Korea and Norway, and falling significantly short in many other markets, with Spain, Italy and the U.S. below 20 Mbps.

The story gets worse for upload speeds, where no market’s median speed broke the IMT-2020 recommended 50 Mbps, and where the bottom 10th percentile lay in single digits across the board. Operators are clearly prioritizing download speeds over upload, which makes sense given the asymmetric nature of demand, with most consumer applications requiring higher download speeds. However, as operators increasingly look to target the enterprise market with 5G connectivity and consumer demand for services such as video calling and mobile gaming continues to rise, operators will need to boost upload speeds.

ookla_5g-upload_performance_1221-01-1

Demand for mobile internet bandwidth continues to grow, up 43% year-on-year in Q3 2021 according to Ericsson’s latest mobility report. Looking ahead to 2022, operators will need to increase the capacity of their 5G networks to tackle this growing demand while driving network speeds to new heights. We’ve seen the impact the deployment of new spectrum can have on congested networks during 2021, with Reliance Jio witnessing a bump in 4G LTE performance and consumer sentiment following its acquisition of additional spectrum in India.

Where 5G still fails to reach

Speedtest Intelligence showed 70 countries in the world where more than 20% of samples were from 2G and 3G connections (combined) during Q3 2021 and met our statistical threshold to be included. These are mostly countries where 5G is still aspirational for a majority of the population. As excited as we are about the expansion of 5G, we do not want to see these countries left behind. Not only are 2G and 3G decades old, they are only sufficient for basic voice and texting, social media and navigation apps. To deliver rich media experiences or video calling, users need access to 4G or higher. Having so many consumers on 2G and 3G also prevents mobile operators from refarming that spectrum to make 4G and 5G networks more efficient.

Countries That Still Rely Heavily on 2G and 3G Connections
Speedtest IntelligenceⓇ | Q3 2021
Country 2G & 3G Samples
Central African Republic 89.9%
Palestine 84.7%
Yemen 72.4%
Turkmenistan 71.8%
Micronesia 56.3%
Madagascar 55.0%
Belarus 53.2%
Rwanda 51.7%
Kiribati 48.4%
Equatorial Guinea 47.6%
Afghanistan 44.4%
South Sudan 43.4%
Guyana 42.3%
Guinea 37.0%
Angola 36.8%
Cape Verde 35.9%
Tajikistan 35.6%
Zimbabwe 34.7%
Benin 34.4%
Togo 33.8%
Ghana 33.0%
Sierra Leone 31.7%
Antigua and Barbuda 30.2%
Vanuatu 30.1%
Lesotho 30.0%
Syria 29.6%
Moldova 29.4%
Saint Kitts and Nevis 28.9%
Mozambique 28.8%
Sudan 28.4%
Palau 28.3%
Grenada 28.1%
Tanzania 27.6%
Uganda 27.5%
Niger 27.5%
Gabon 27.5%
Haiti 27.4%
Suriname 27.4%
Tonga 27.3%
Liberia 27.0%
Namibia 26.7%
Swaziland 26.5%
The Gambia 26.3%
Saint Vincent and the Grenadines 26.3%
Dominica 26.3%
Somalia 26.1%
Cook Islands 26.0%
Zambia 25.9%
Barbados 25.7%
Armenia 25.5%
Algeria 25.4%
Papua New Guinea 25.2%
Jamaica 24.5%
Venezuela 24.2%
Ethiopia 24.1%
Uzbekistan 24.0%
El Salvador 23.5%
Honduras 23.1%
Nigeria 23.0%
Solomon Islands 22.8%
Caribbean Netherlands 22.7%
Botswana 22.3%
Anguilla 21.7%
Mauritania 20.6%
Saint Lucia 20.5%
Bosnia and Herzegovina 20.3%
Burundi 20.3%
Ecuador 20.2%
Ukraine 20.1%
Trinidad and Tobago 20.0%

We were pleased to see the following countries come off the list from last year, having dropped below the 20% threshold: Azerbaijan, Bangladesh, Belize, Burkina Faso, Cameroon, Costa Rica, Côte d’Ivoire, DR Congo, Iraq, Kenya, Laos, Libya, Maldives, Mali, Mauritius, Mongolia, Nicaragua, Paraguay and Tunisia. While countries like Palestine, Suriname, Ethiopia, Haiti and Antigua and Barbuda are still on this list, they have improved the percentage of their samples on these outmoded technologies when compared to last year (dropping 10-15 points, respectively), 2G and 3G samples in Belarus increased 6.7 points when comparing Q3 2021 to Q3 2020.

We’re excited to see how performance levels will normalize as 5G expands to more and more countries and access improves. Keep track of how well your country is performing on Ookla’s Speedtest Global Index.

Ookla retains ownership of this article including all of the intellectual property rights, data, content graphs and analysis. This article may not be quoted, reproduced, distributed or published for any commercial purpose without prior consent. Members of the press and others using the findings in this article for non-commercial purposes are welcome to publicly share and link to report information with attribution to Ookla.

| December 10, 2020

Massive Expansions and Huge Improvements in Speed: The Worldwide Growth of 5G in 2020

The rapid expansion of 5G in countries across the globe was a bright spot in a year that needed one. But just how great is the news? We examined Speedtest Intelligence® data from over 60.5 million Speedtest® results during Q3 2020 to see how much speeds have improved, where download speeds are the fastest at the country and capital level, where 5G deployments have increased and what worldwide 5G coverage looks like now. We also looked at countries where 5G doesn’t yet reach to understand where good news might be on the horizon.

We have only included countries with commercially available 5G on these lists in order to provide a more accurate view of the performance consumers can reasonably expect. While our data shows results for many countries where 5G is not yet commercially available, these tests are likely results from engineers testing their own networks. In addition, we’re only providing analysis for countries with more than 200 samples during Q3 2020. The bars shown in our charts are 95% confidence intervals, which represent the range of values in which the true value is likely to be. Countries marked in tables with an asterisk first launched 5G commercially in 2020.

5G downloads were 954% faster than 4G at the global level

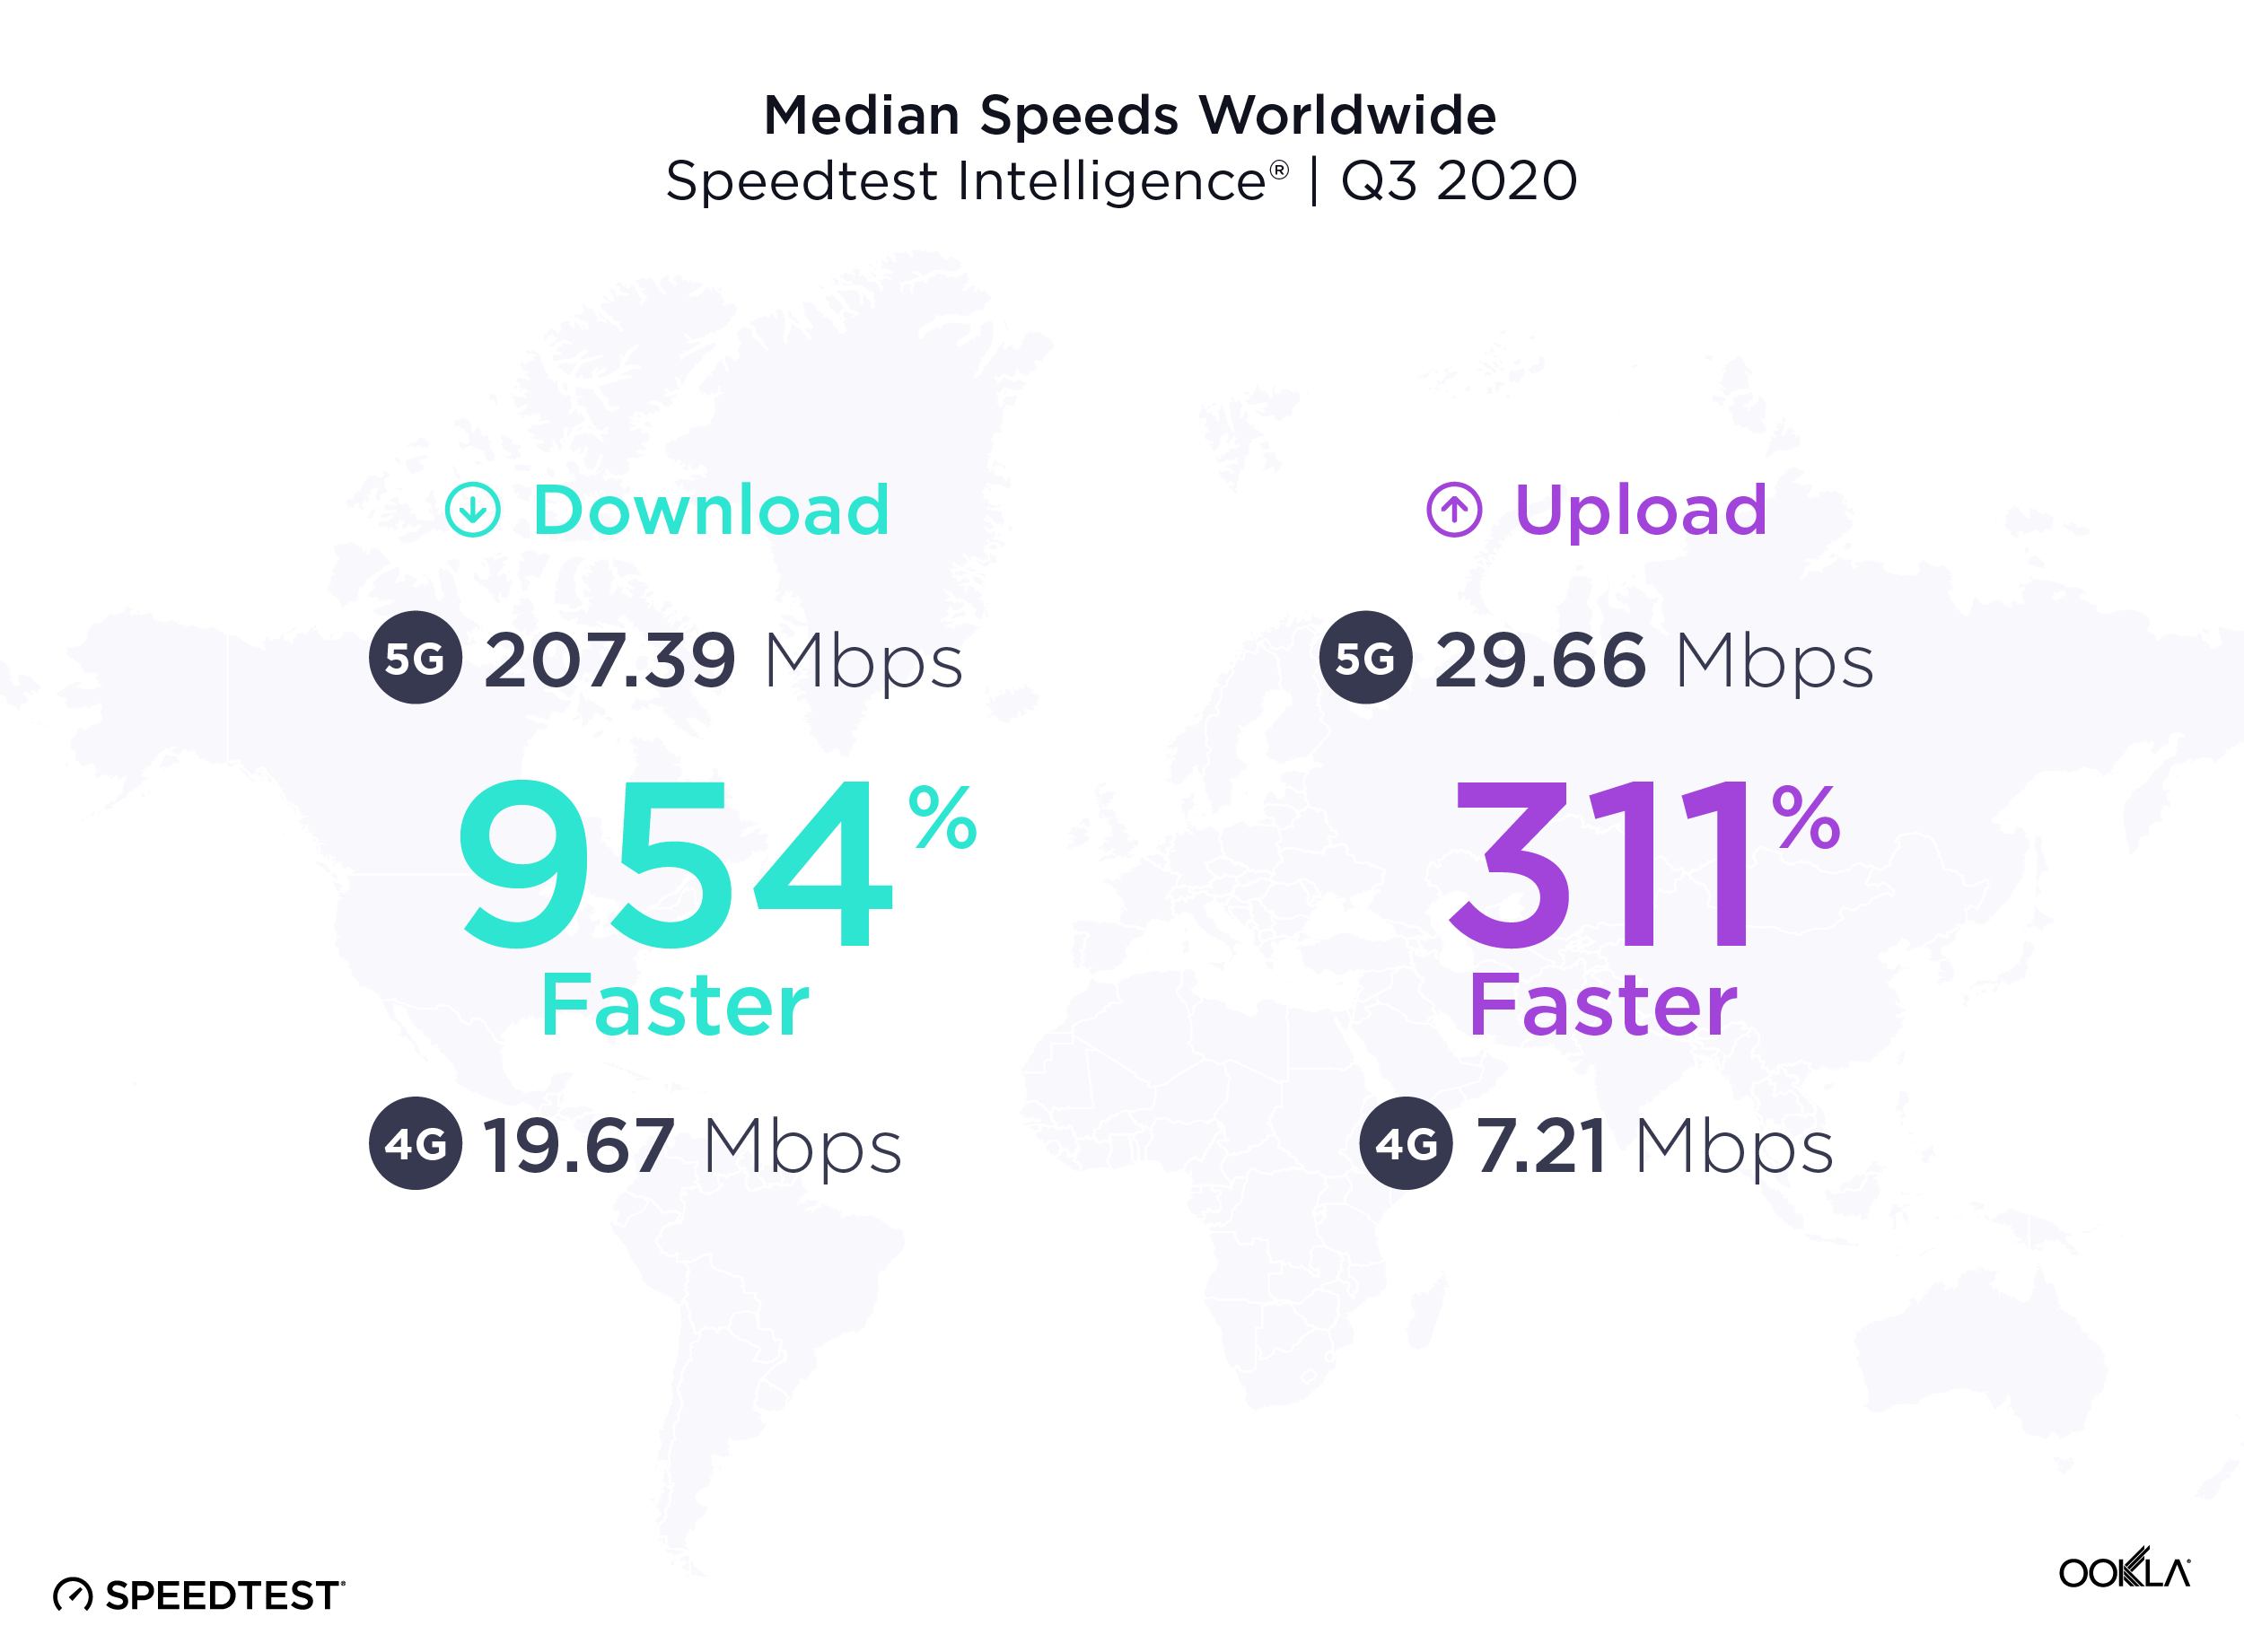
The worldwide median download speed over 5G was 954% faster than that over 4G during Q3 2020. Median upload speed over 5G was 311% faster than that over 4G. Consumers are eagerly adopting the new technology and many have wanted to measure the full throughput capacity of their network connection. In Q3 2020 alone, there were 4,324,788 Speedtest results over 5G.
Median-Speeds-Worldwide_1220-1

United Arab Emirates had the fastest 5G

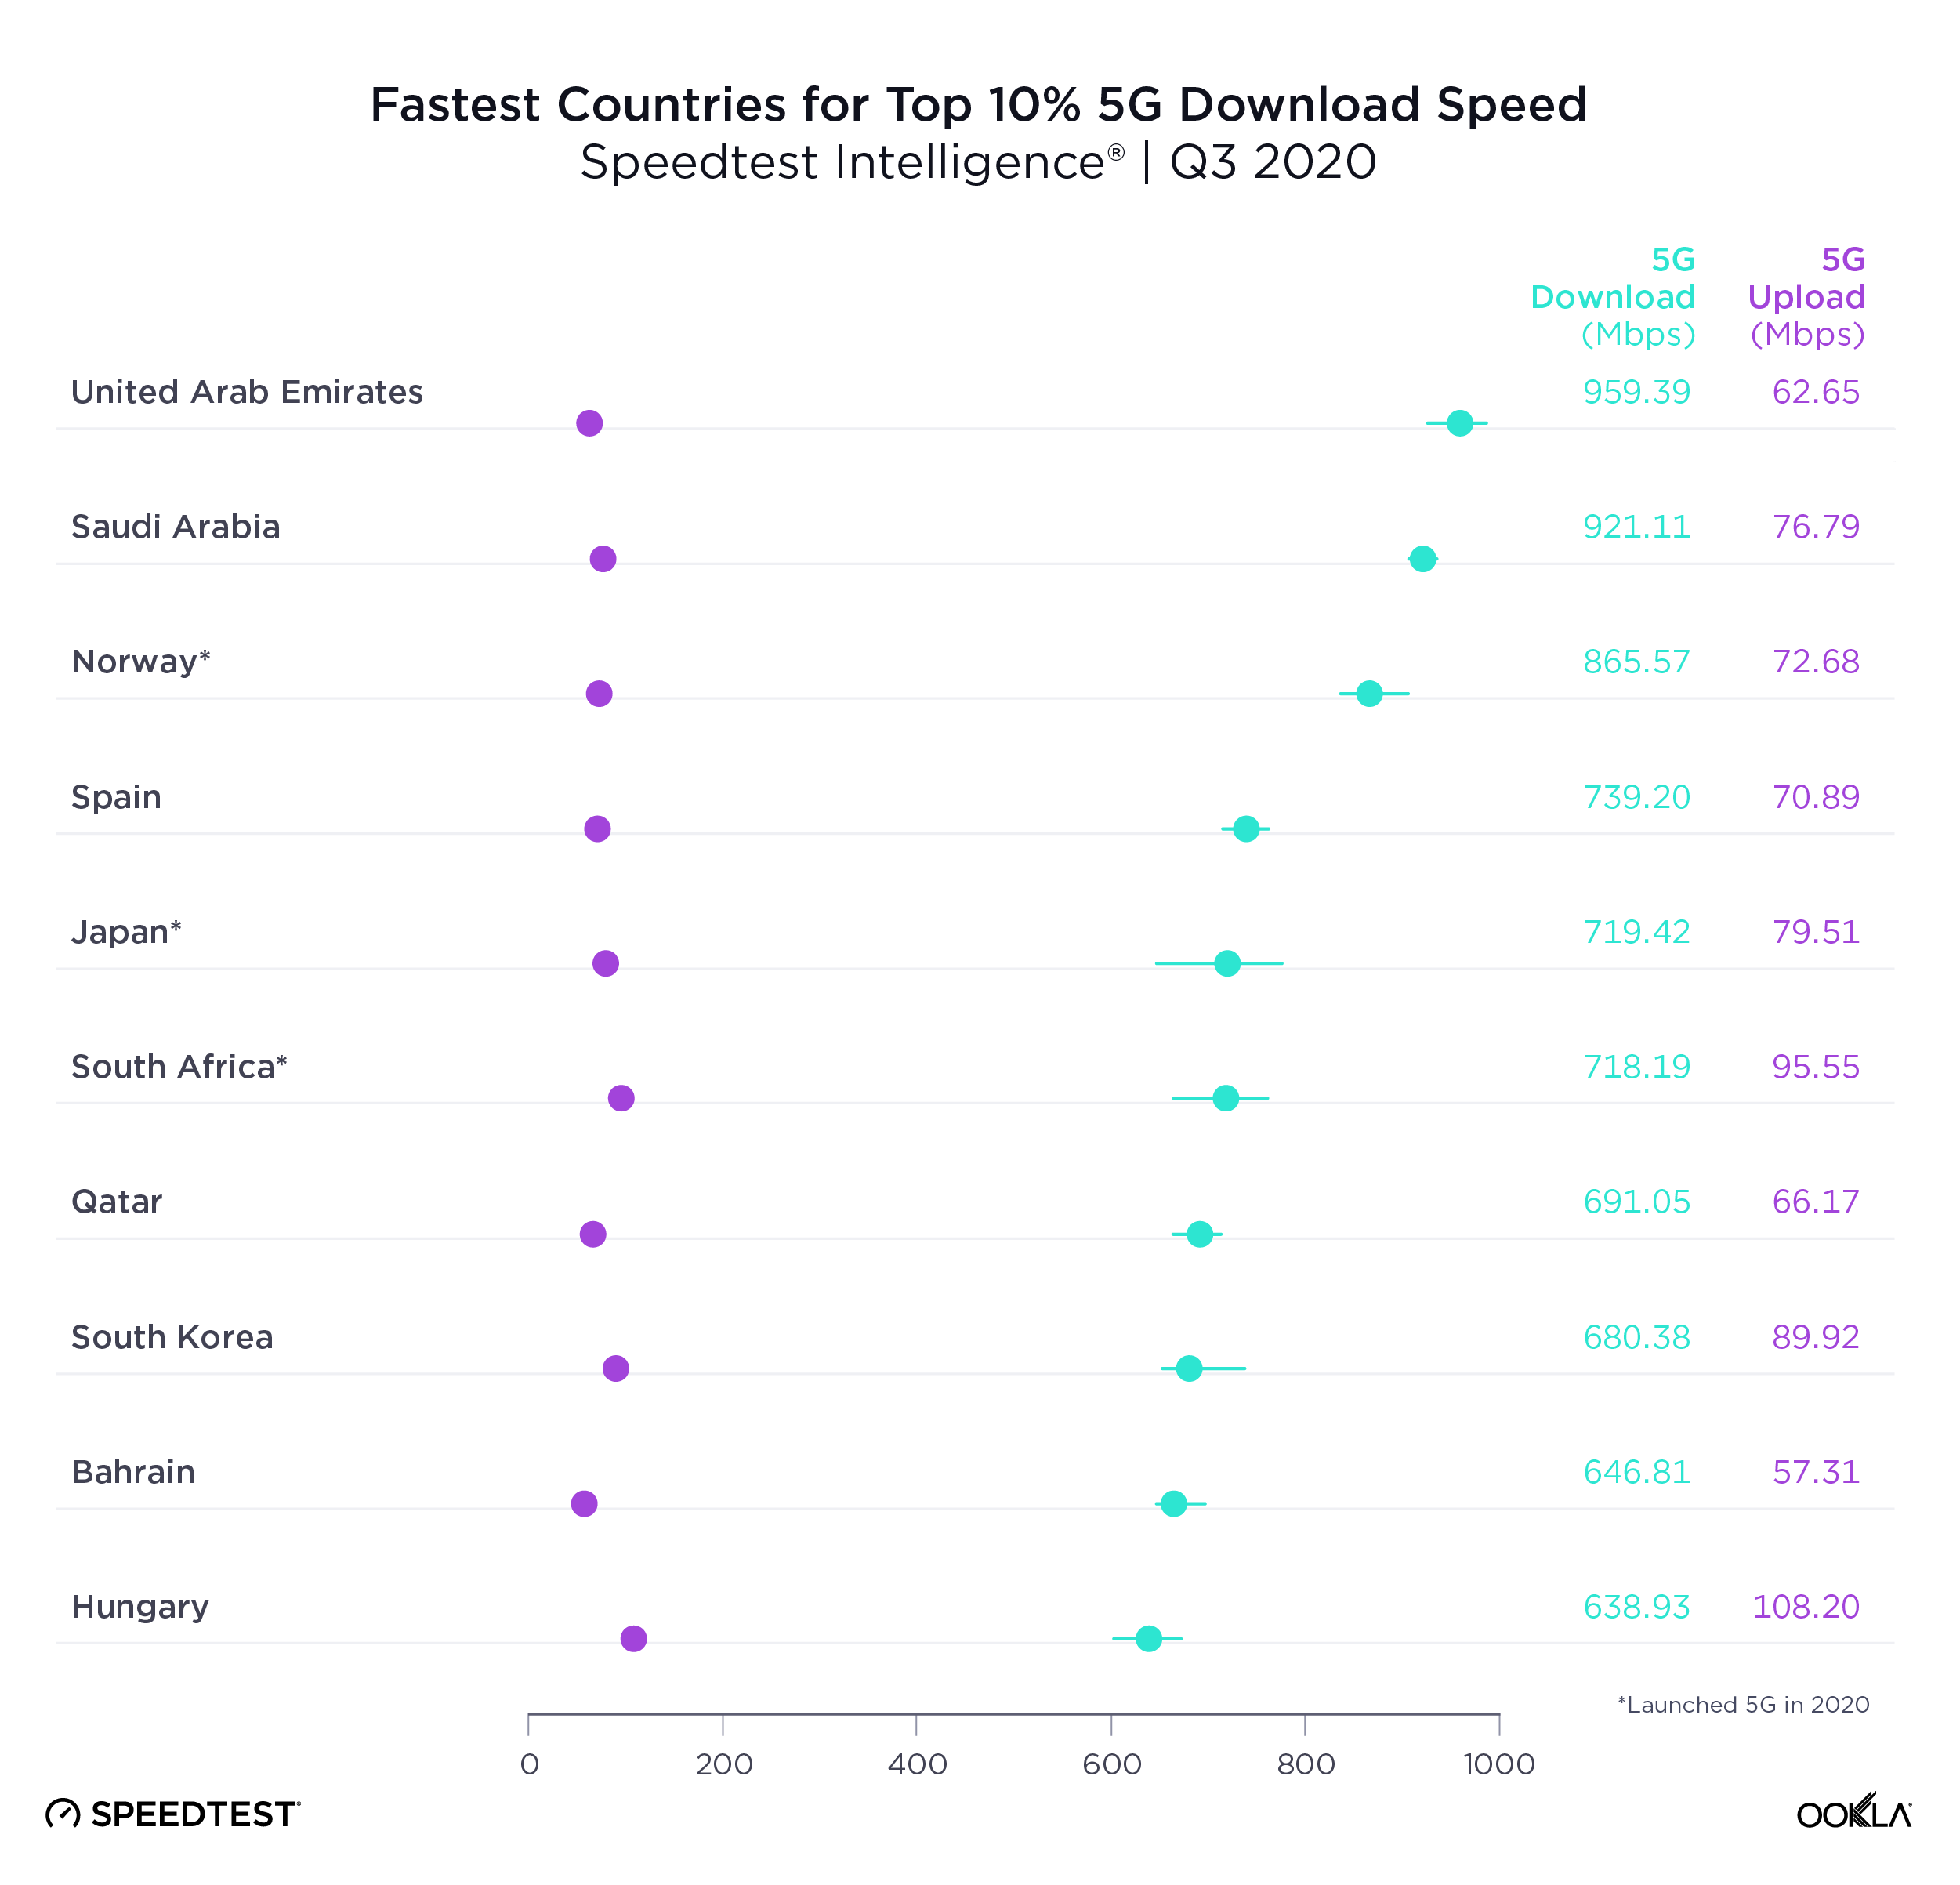
United Arab Emirates topped the list of countries with the fastest top 10% 5G download speed in Q3 2020. Top 10% (or 90th percentile) measures the speeds seen by the fastest 10% of users and is a way to gauge what each country’s networks are capable of. Saudi Arabia was second for top 10% 5G download speed, Norway third, Spain fourth and Japan fifth.
Fastest-Countries-Top-5G-Download-Speed_1220-2

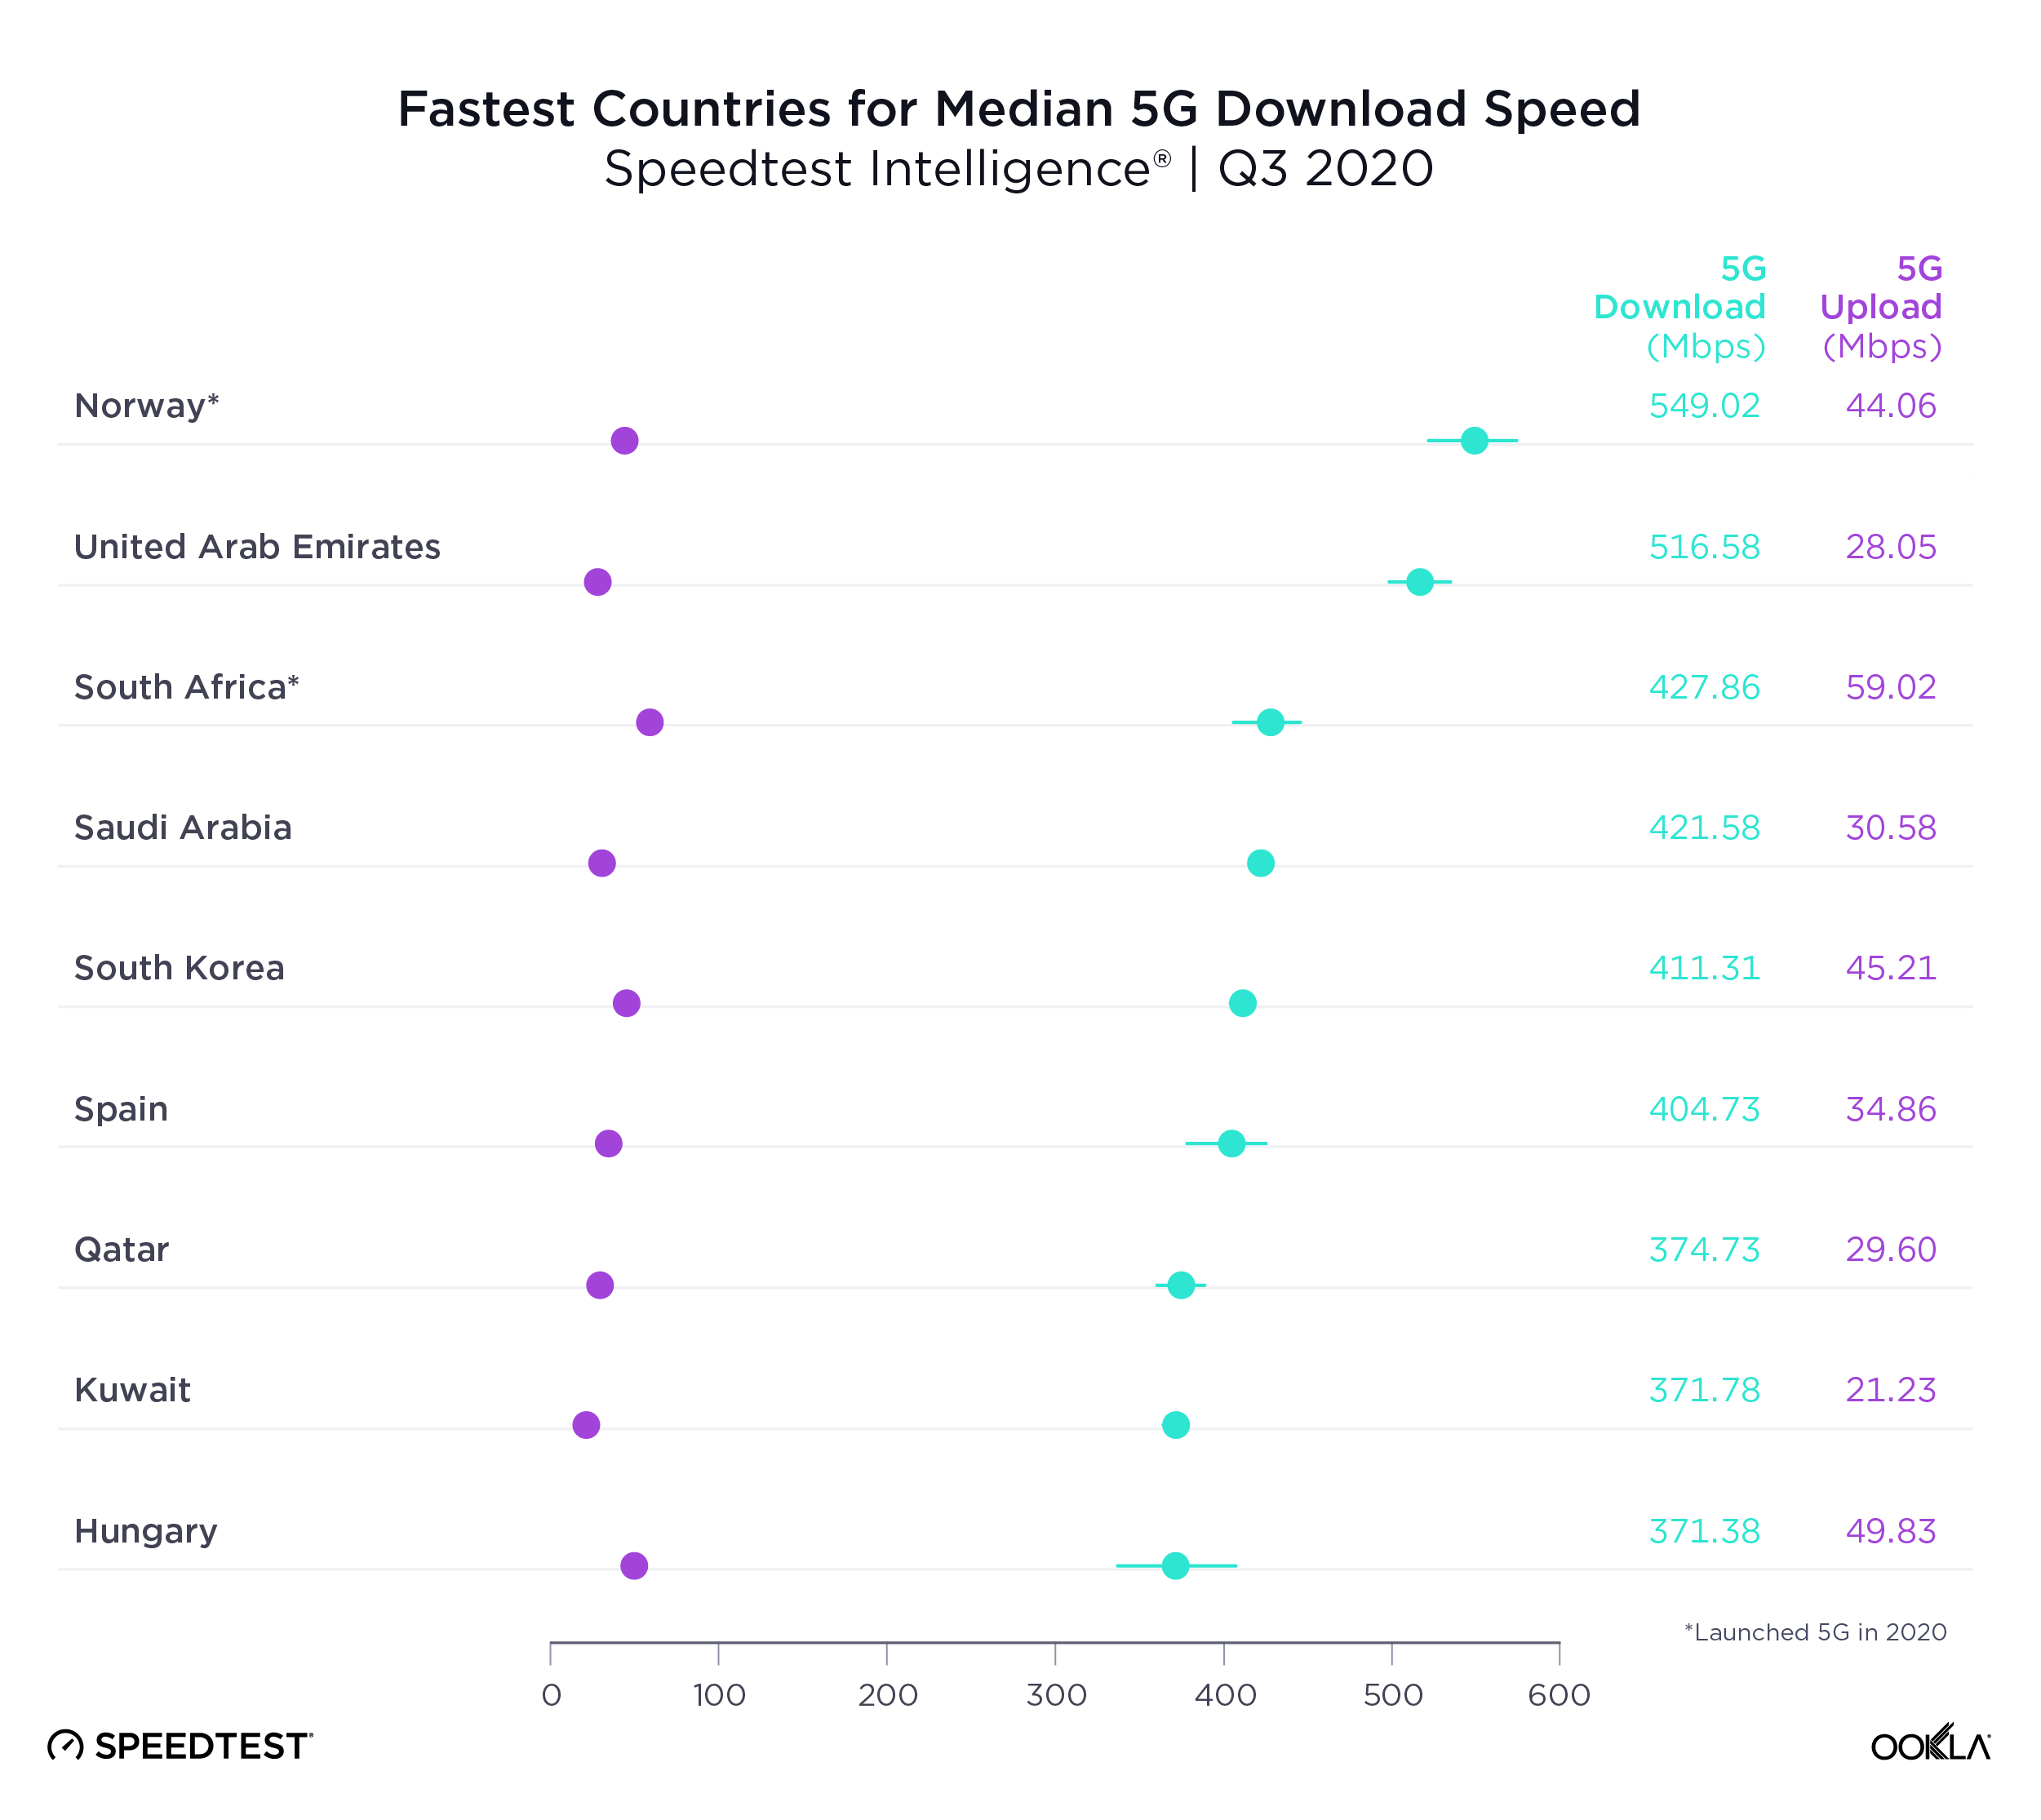
Another way to measure 5G performance is to look at median 5G download speed, which is a better predictor of the kind of performance most 5G customers can expect. Norway was the country with the fastest median download speed over 5G during Q3 2020. U.A.E. was second in this category, South Africa third, Saudi Arabia fourth and Spain fifth.
Fastest-Countries-Median-5G-Download-Speed_1220-2

It’s notable that Japan was on the list of 10 countries with the fastest top 10% 5G download speed but not on the list of 10 countries with the fastest median download speed over 5G. No matter how fast a country’s mobile infrastructure is, many other factors go into median 5G speeds, including device adoption and spectrum allocation.

Abu Dhabi tops list of 5G speeds in world capitals

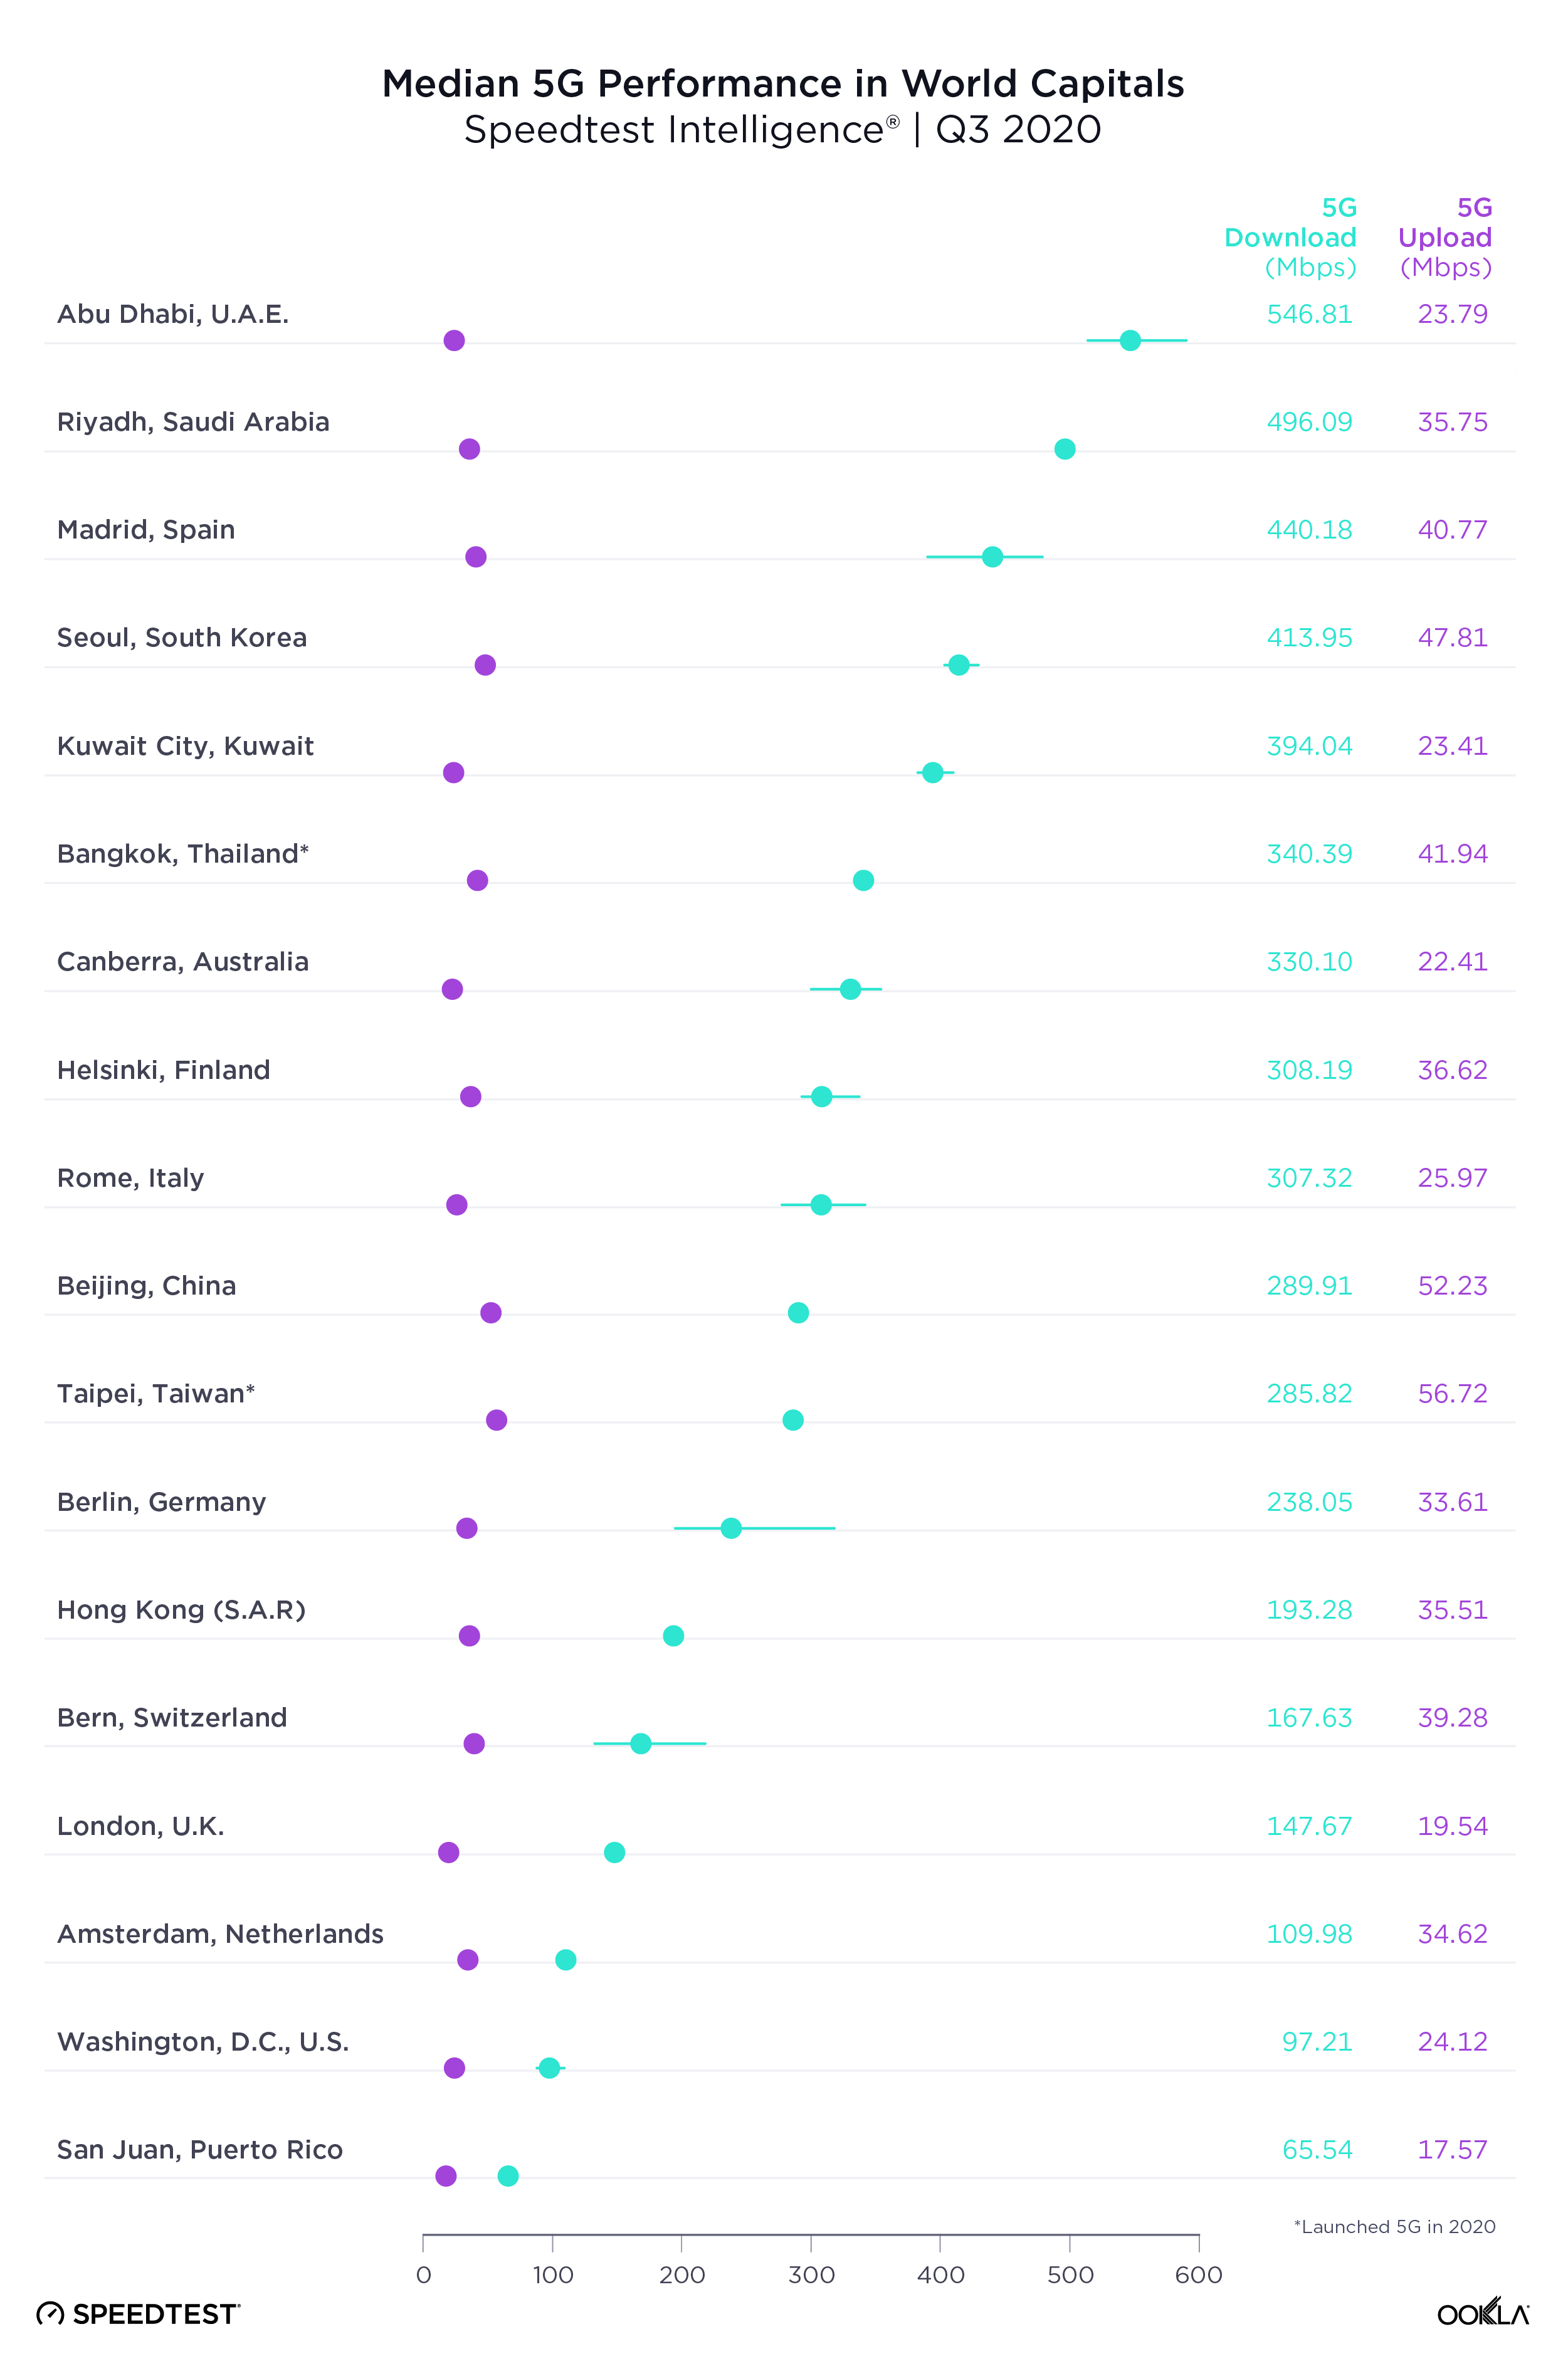
Our examination of 5G performance for 18 world capital cities with 5G during Q3 2020 found that Abu Dhabi had the fastest median download speed over 5G at 546.81 Mbps. Riyadh was second, Madrid third, Seoul fourth and Kuwait City fifth. As we saw at the country level, median upload speed was much lower than download speed.
Median-5G-Performance-Capitals_1220-2

How 5G performance and time spent compare within regions

We looked more closely at 5G performance across several intergovernmental organizations and trade blocs to get a better sense of how countries are performing in comparison to their neighbors and trade partners. We also calculated Time Spent on 5G, the proportion of time that users with 5G-capable devices spent on 5G, for each country.

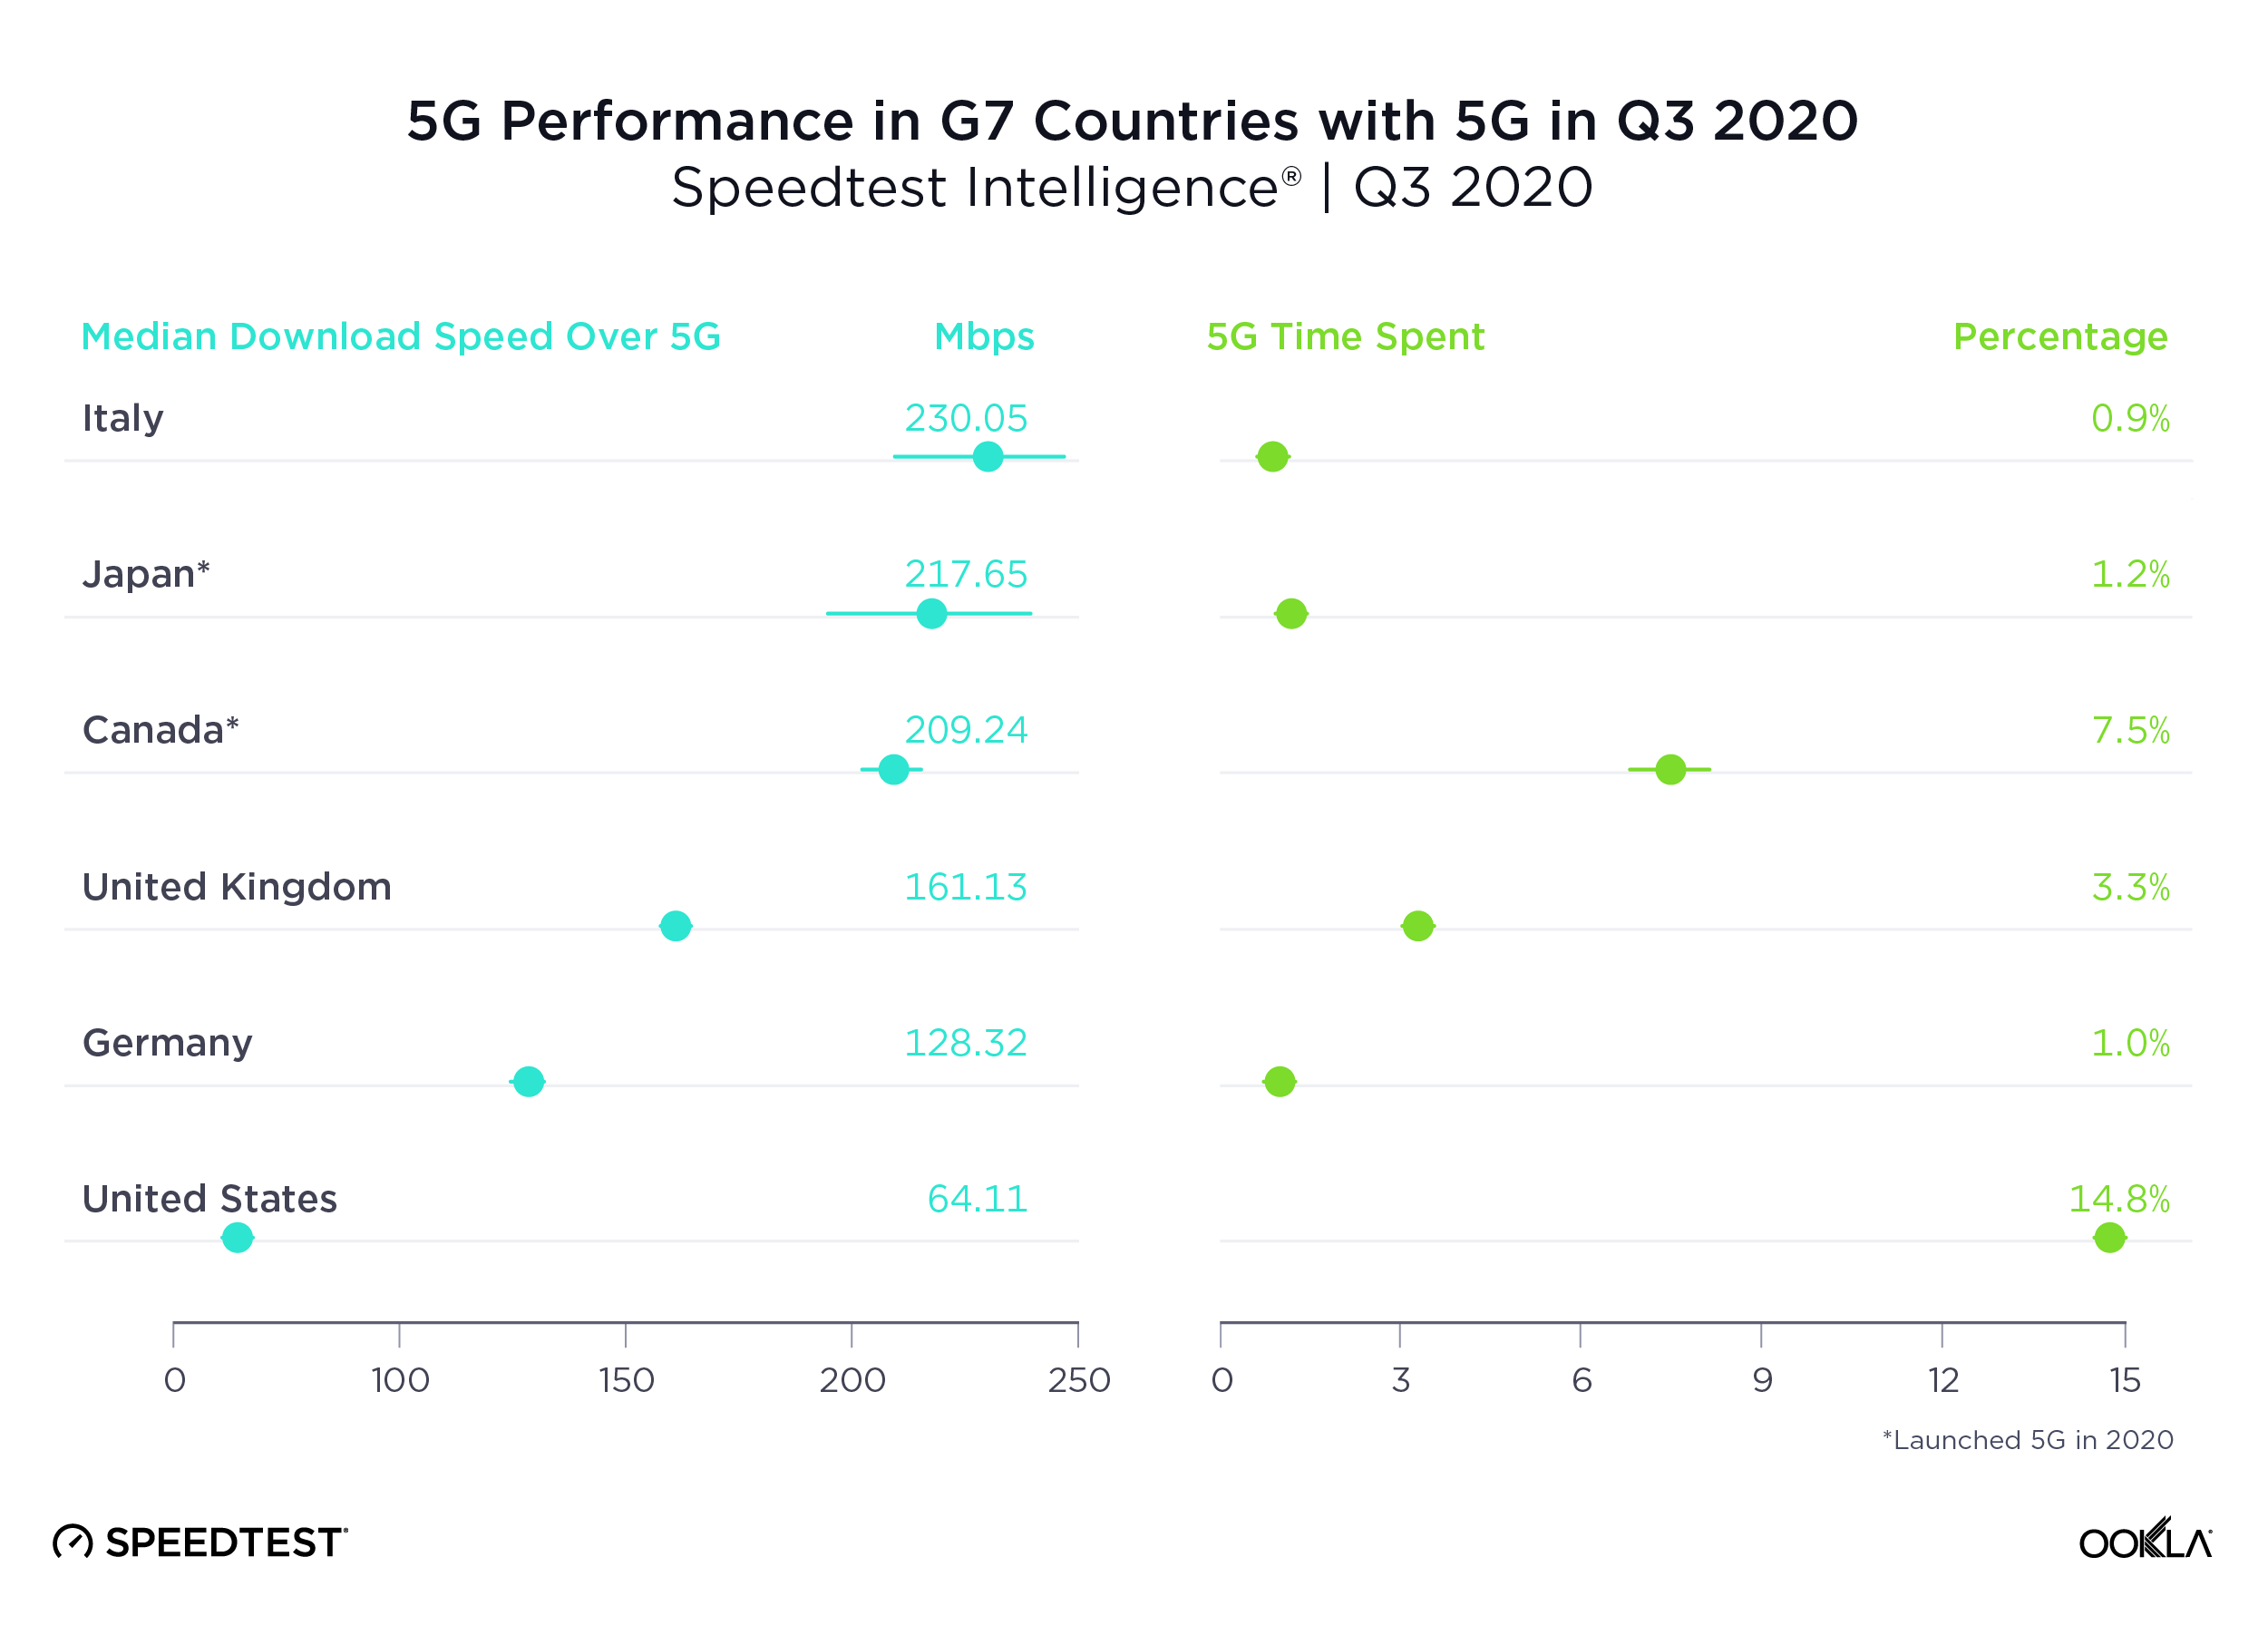
Italy had the fastest 5G among G7 countries, U.S. the slowest

Italy had the fastest median download speed over 5G of all the G7 countries. Japan was second, Canada third, the U.K. fourth and Germany fifth. The U.S. had the highest Time Spent on 5G, followed by Canada. For a deeper analysis of 5G in the U.K., read our previous coverage. Because France launched commercially available 5G only within the last couple of weeks, we have not included it on this table.
5G-Performance-G7-Countries_1220

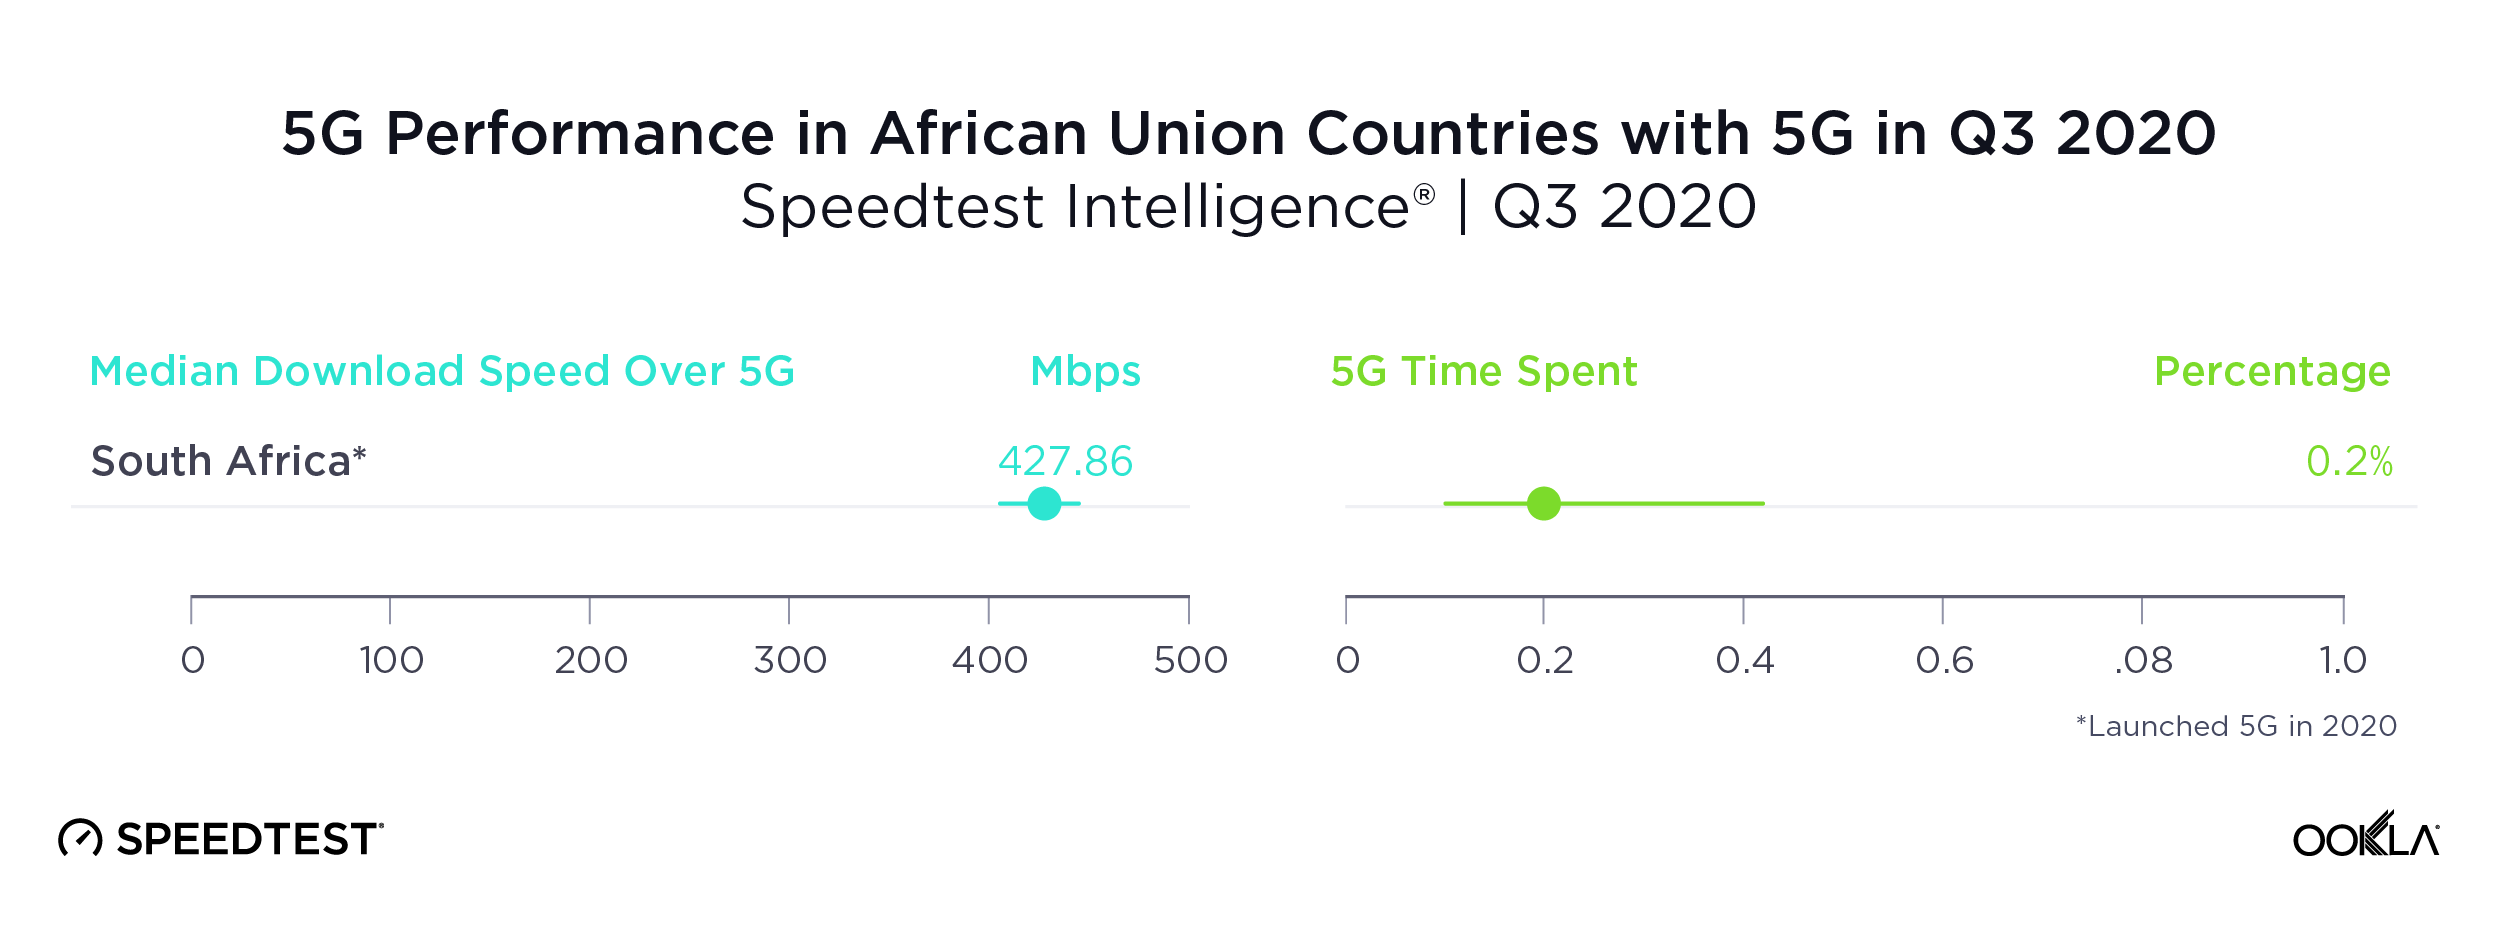
South Africa was the only country in the African Union with sufficient 5G to rate

As we saw above, South Africa’s impressive median download speed over 5G ranked the country third in the world during Q3 2020. South Africa was only one of two countries in the African Union to have commercially available 5G during Q3 2020. The other, Madagascar, did not have sufficient samples to properly analyze. Time Spent on 5G in South Africa was very low, an indication that 5G is not yet widely available there.
5G-Performance-Africa_1220

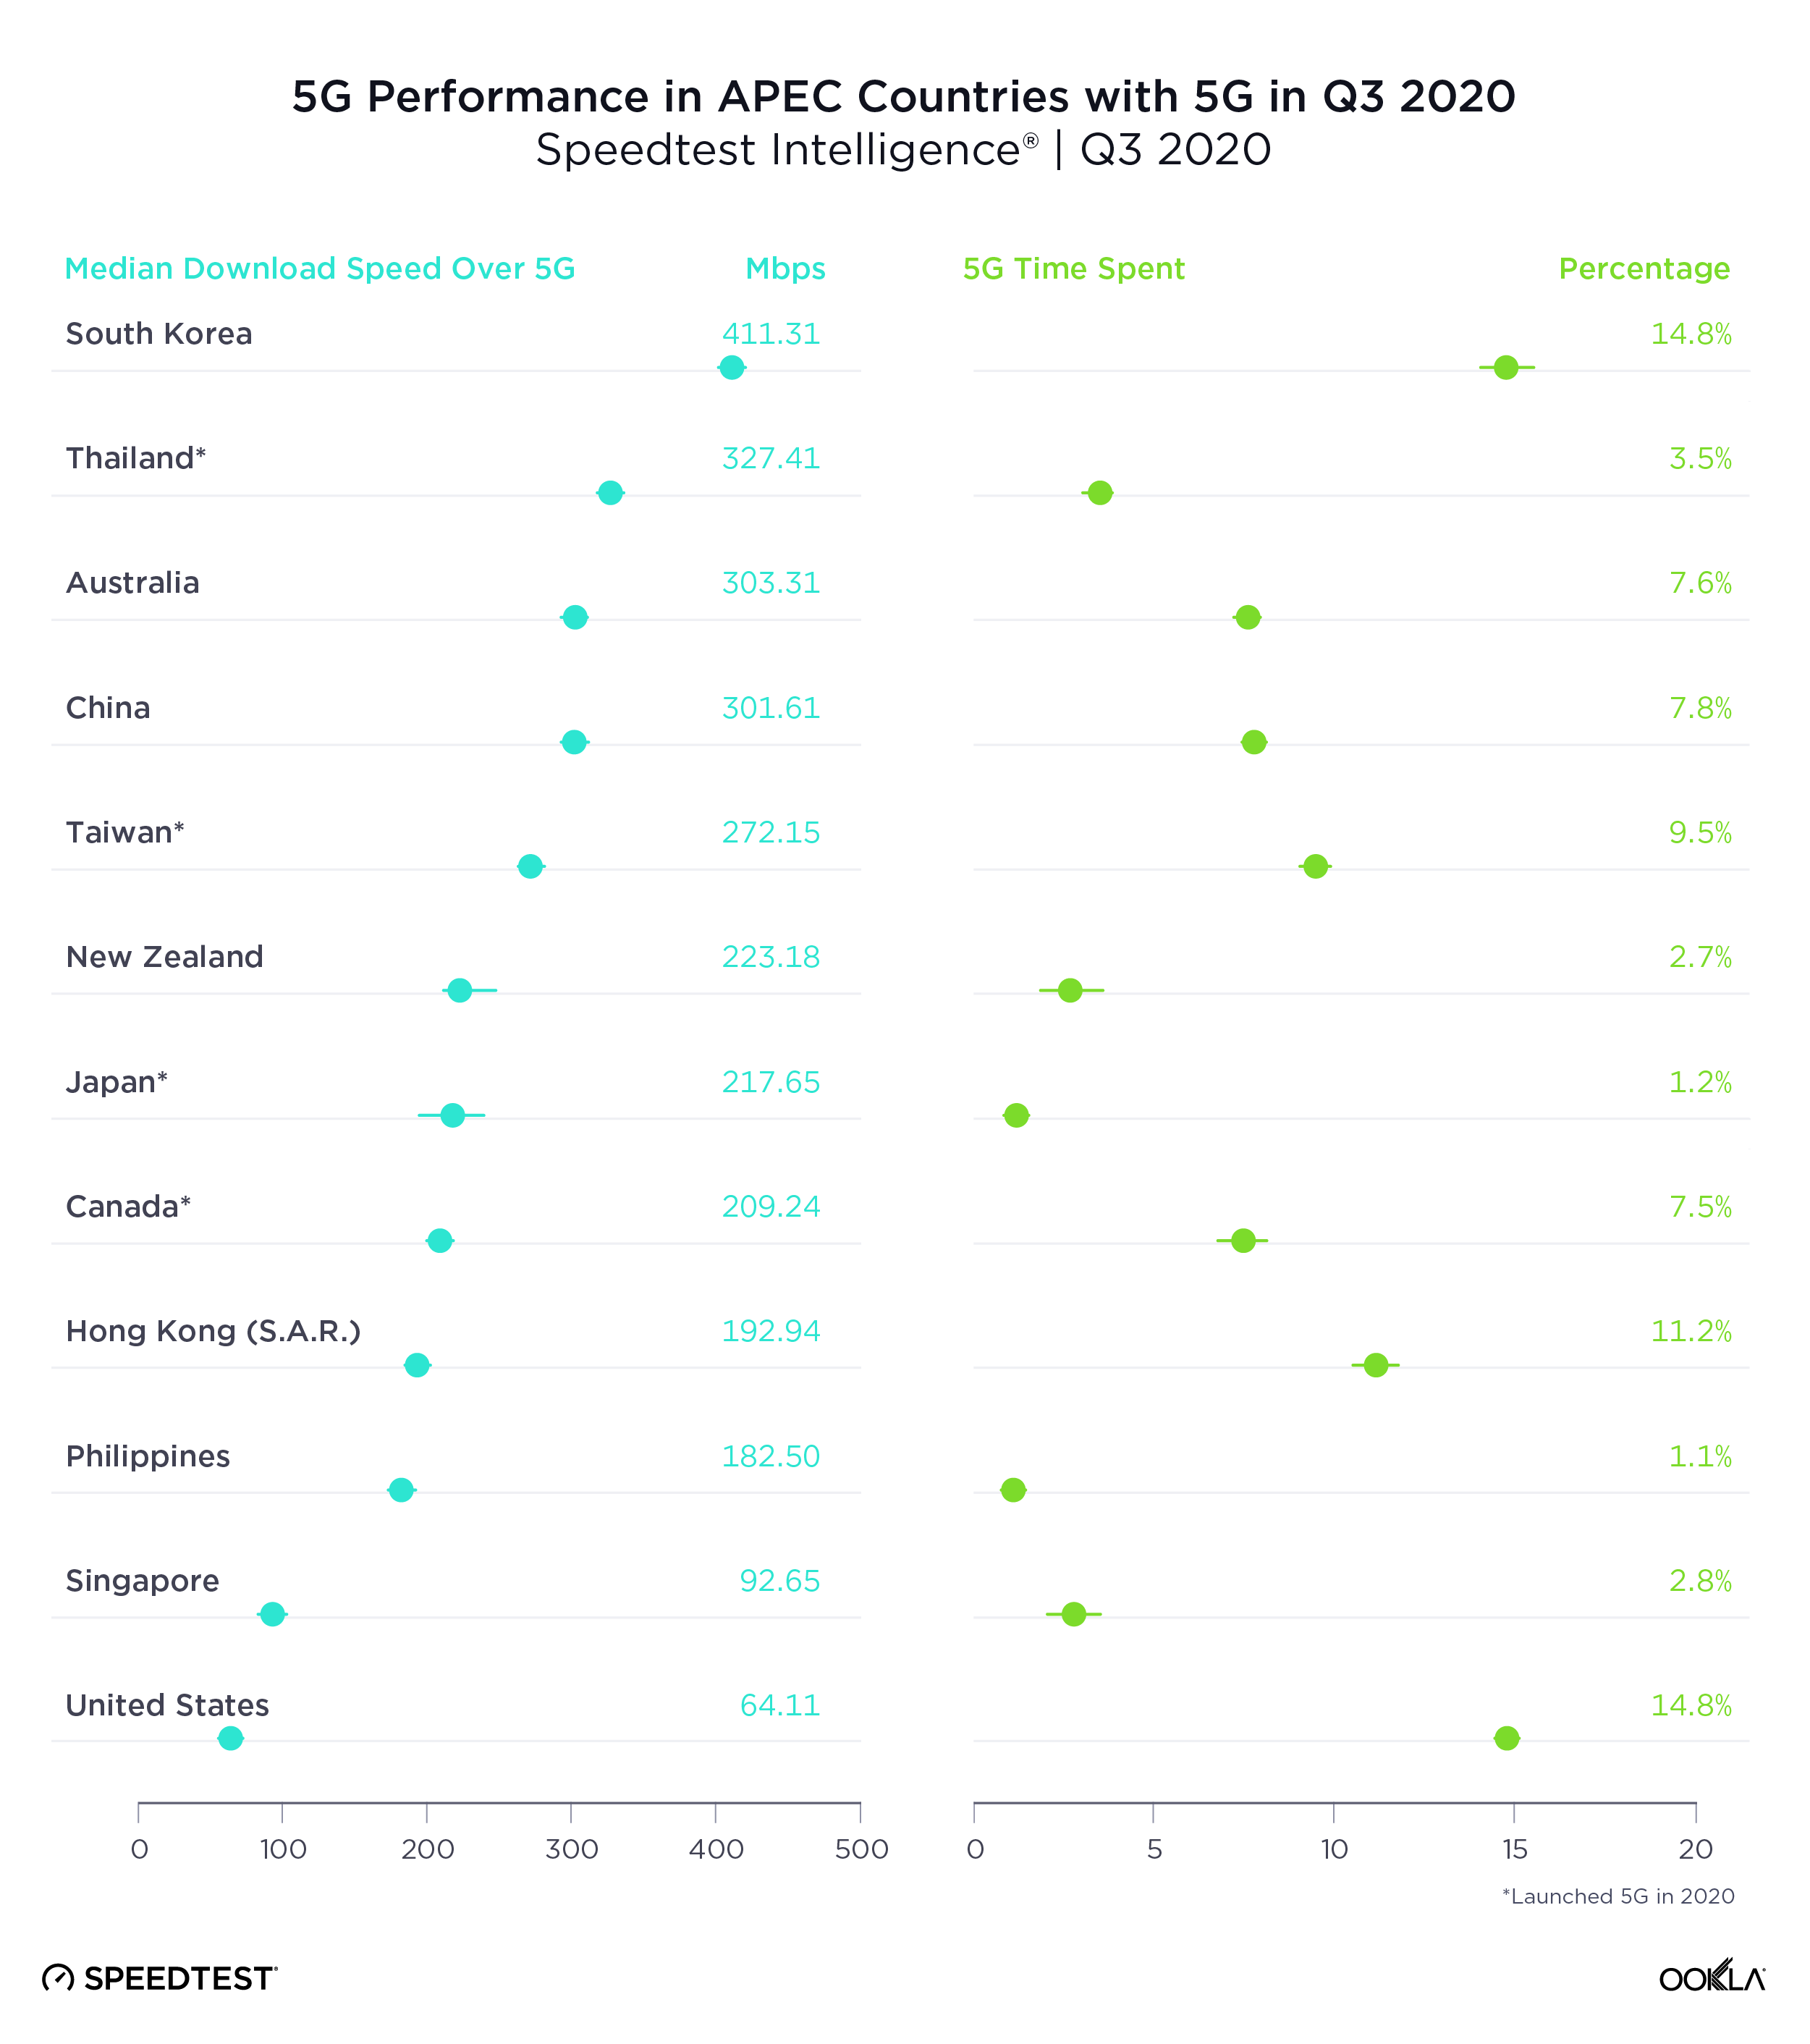
South Korea had the fastest 5G in APEC countries, U.S. the slowest

A median download speed over 5G of 411.11 Mbps put South Korea comfortably at the top of Asia-Pacific Economic Cooperation (APEC) countries with the fastest 5G during Q3 2020. Thailand was second, Australia third, China fourth and Taiwan fifth. 5G speeds represented the largest improvement over 4G in the Philippines where the median download speed over 4G during Q3 2020 (9.36 Mbps) was substantially lower than that of other countries on this list.

South Korea and the U.S. tied for highest Time Spent on 5G among APEC countries during Q3 2020, followed by Hong Kong and Taiwan.
5G-Performance-APEC_1220

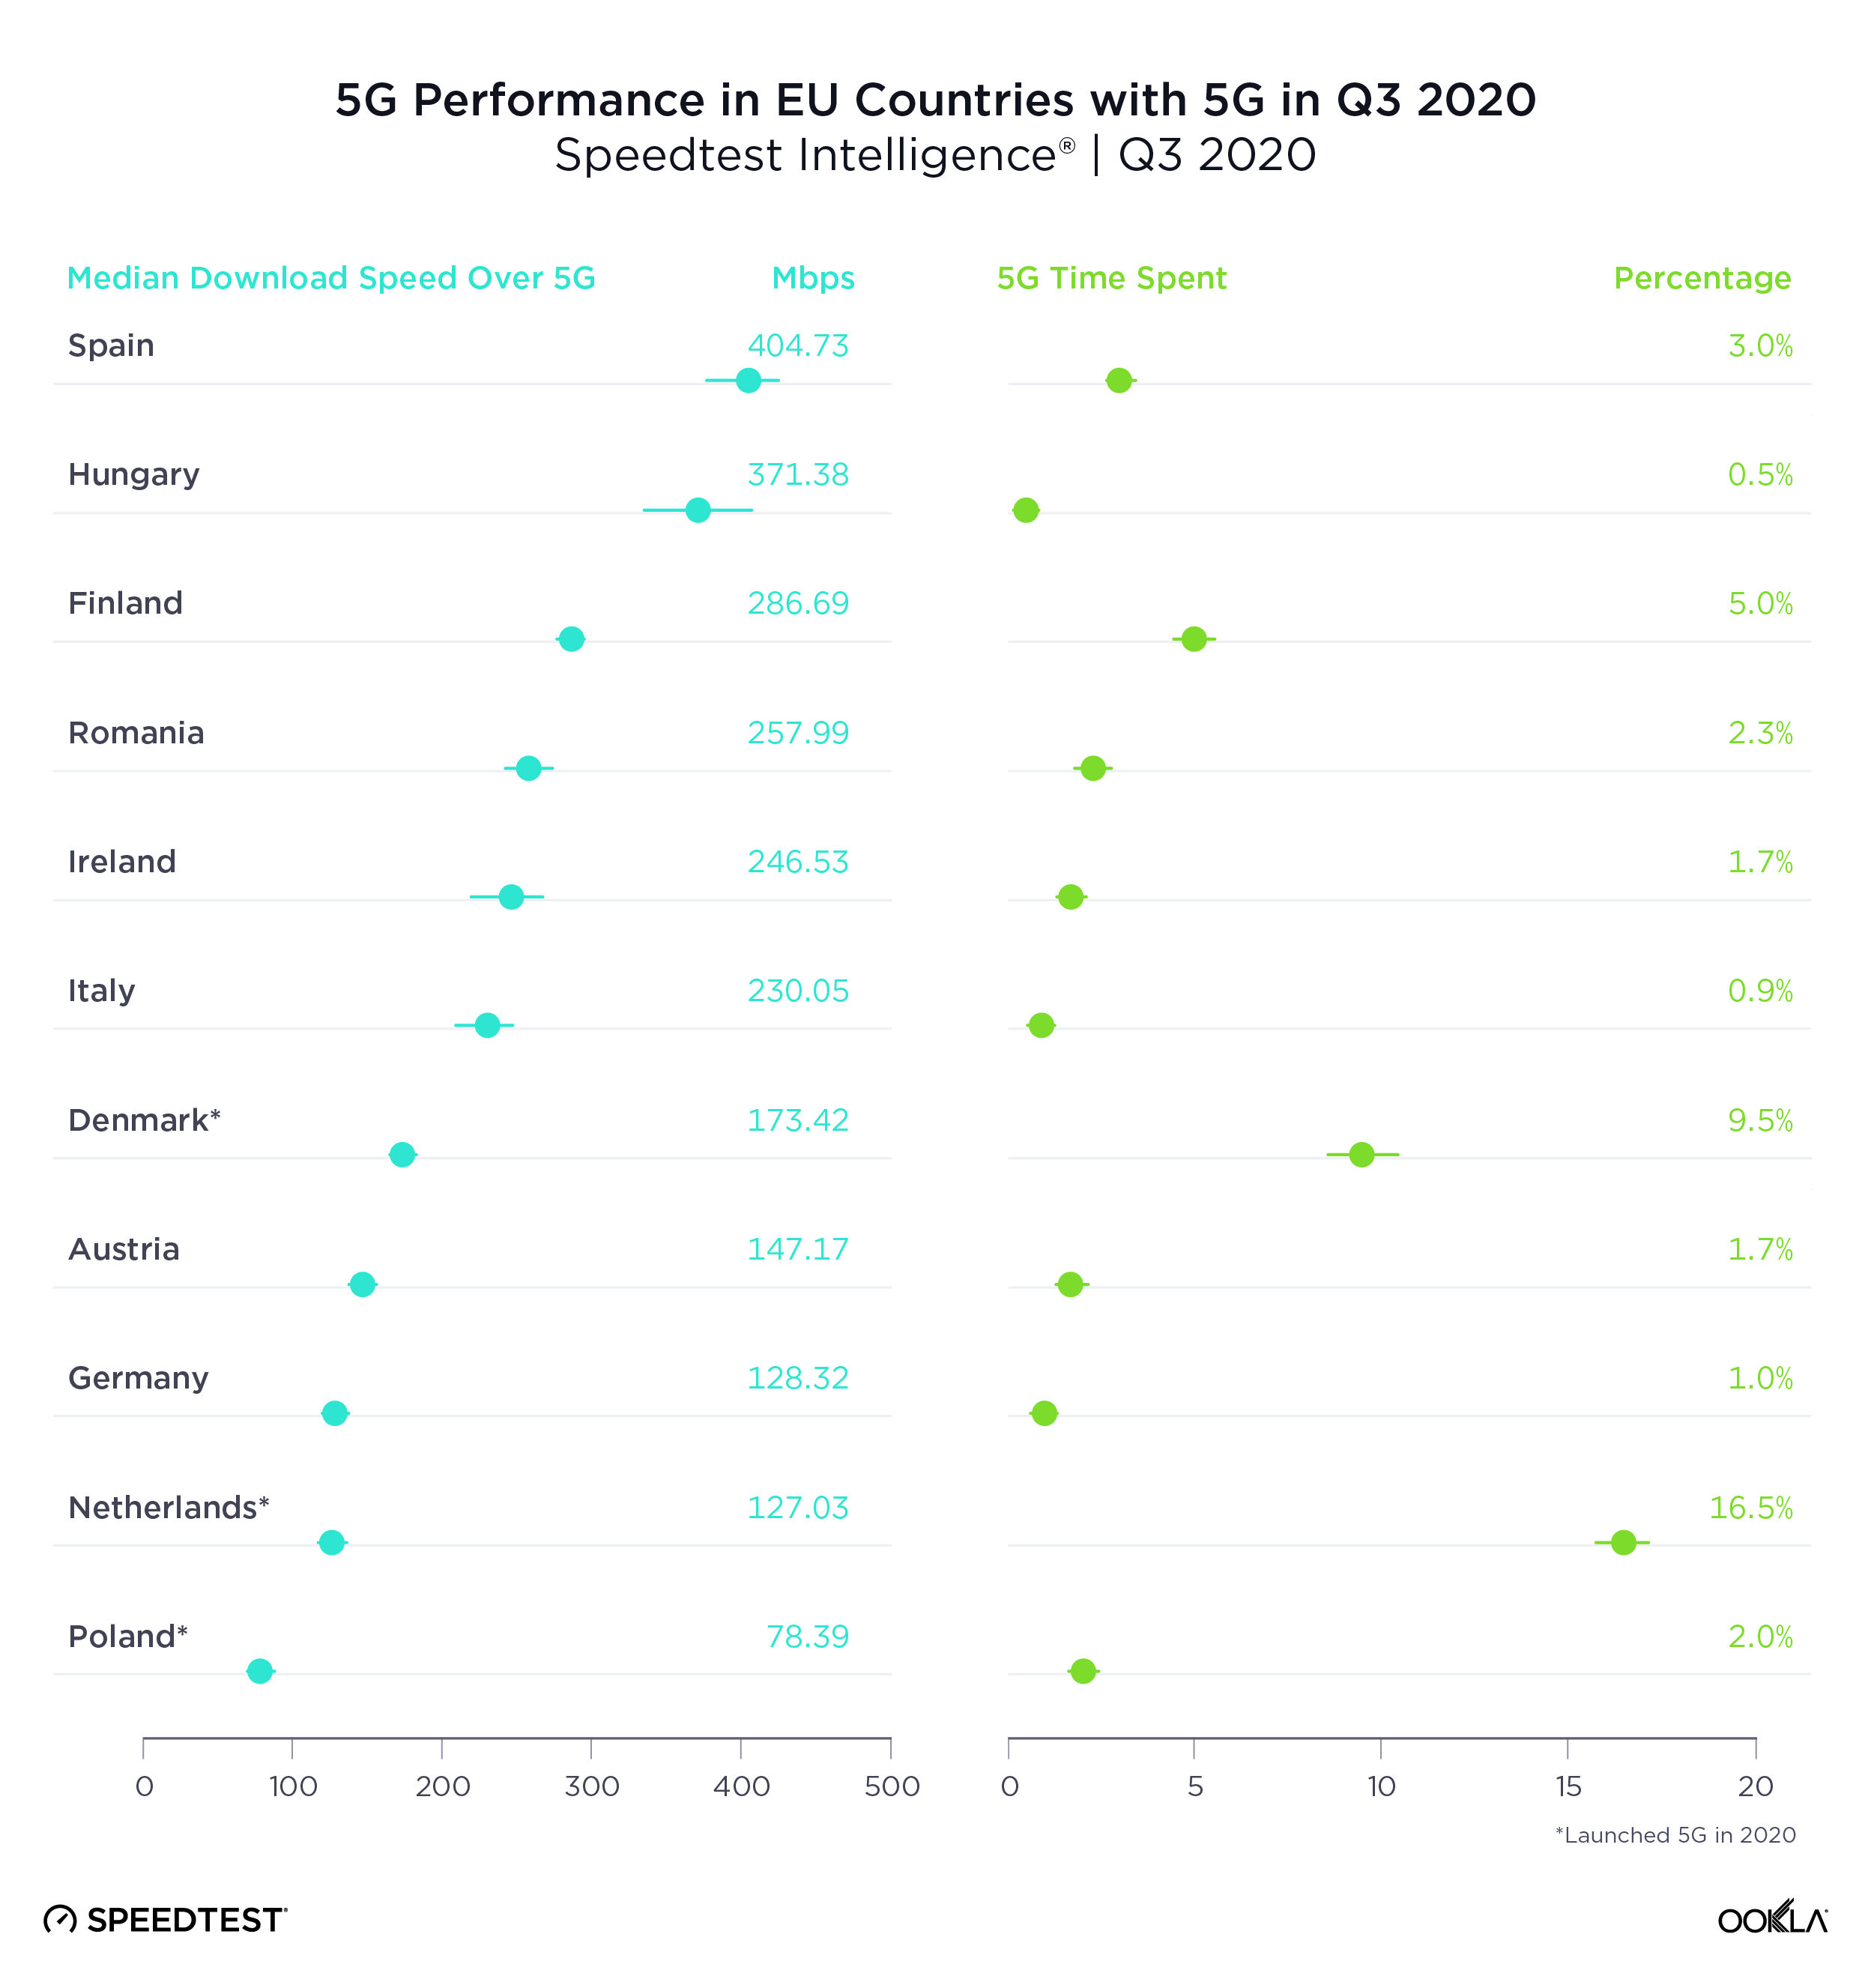
Spain had the fastest 5G in the E.U., Poland the slowest

Spain showed the fastest median download speed over 5G among the 11 European Union (E.U.) countries with sufficient 5G samples to rank during Q3 2020. Hungary was second, Finland third, Romania fourth and Ireland fifth. Spain’s median download speed over 5G also represented the largest gain over 4G among all of these countries, partially because Spain had the second slowest median download speed over 4G. France is not included on this list because 5G did not become commercially available in the country until after Q3 2020.

The Netherlands had the highest Time Spent on 5G among E.U. countries during Q3 2020, indicating that customers with 5G phones are able to spend far more time on 5G there than in other E.U. countries. Denmark was second for Time Spent on 5G among EU countries in Q3 2020 and Finland third.
5G-Performance-EU_1220

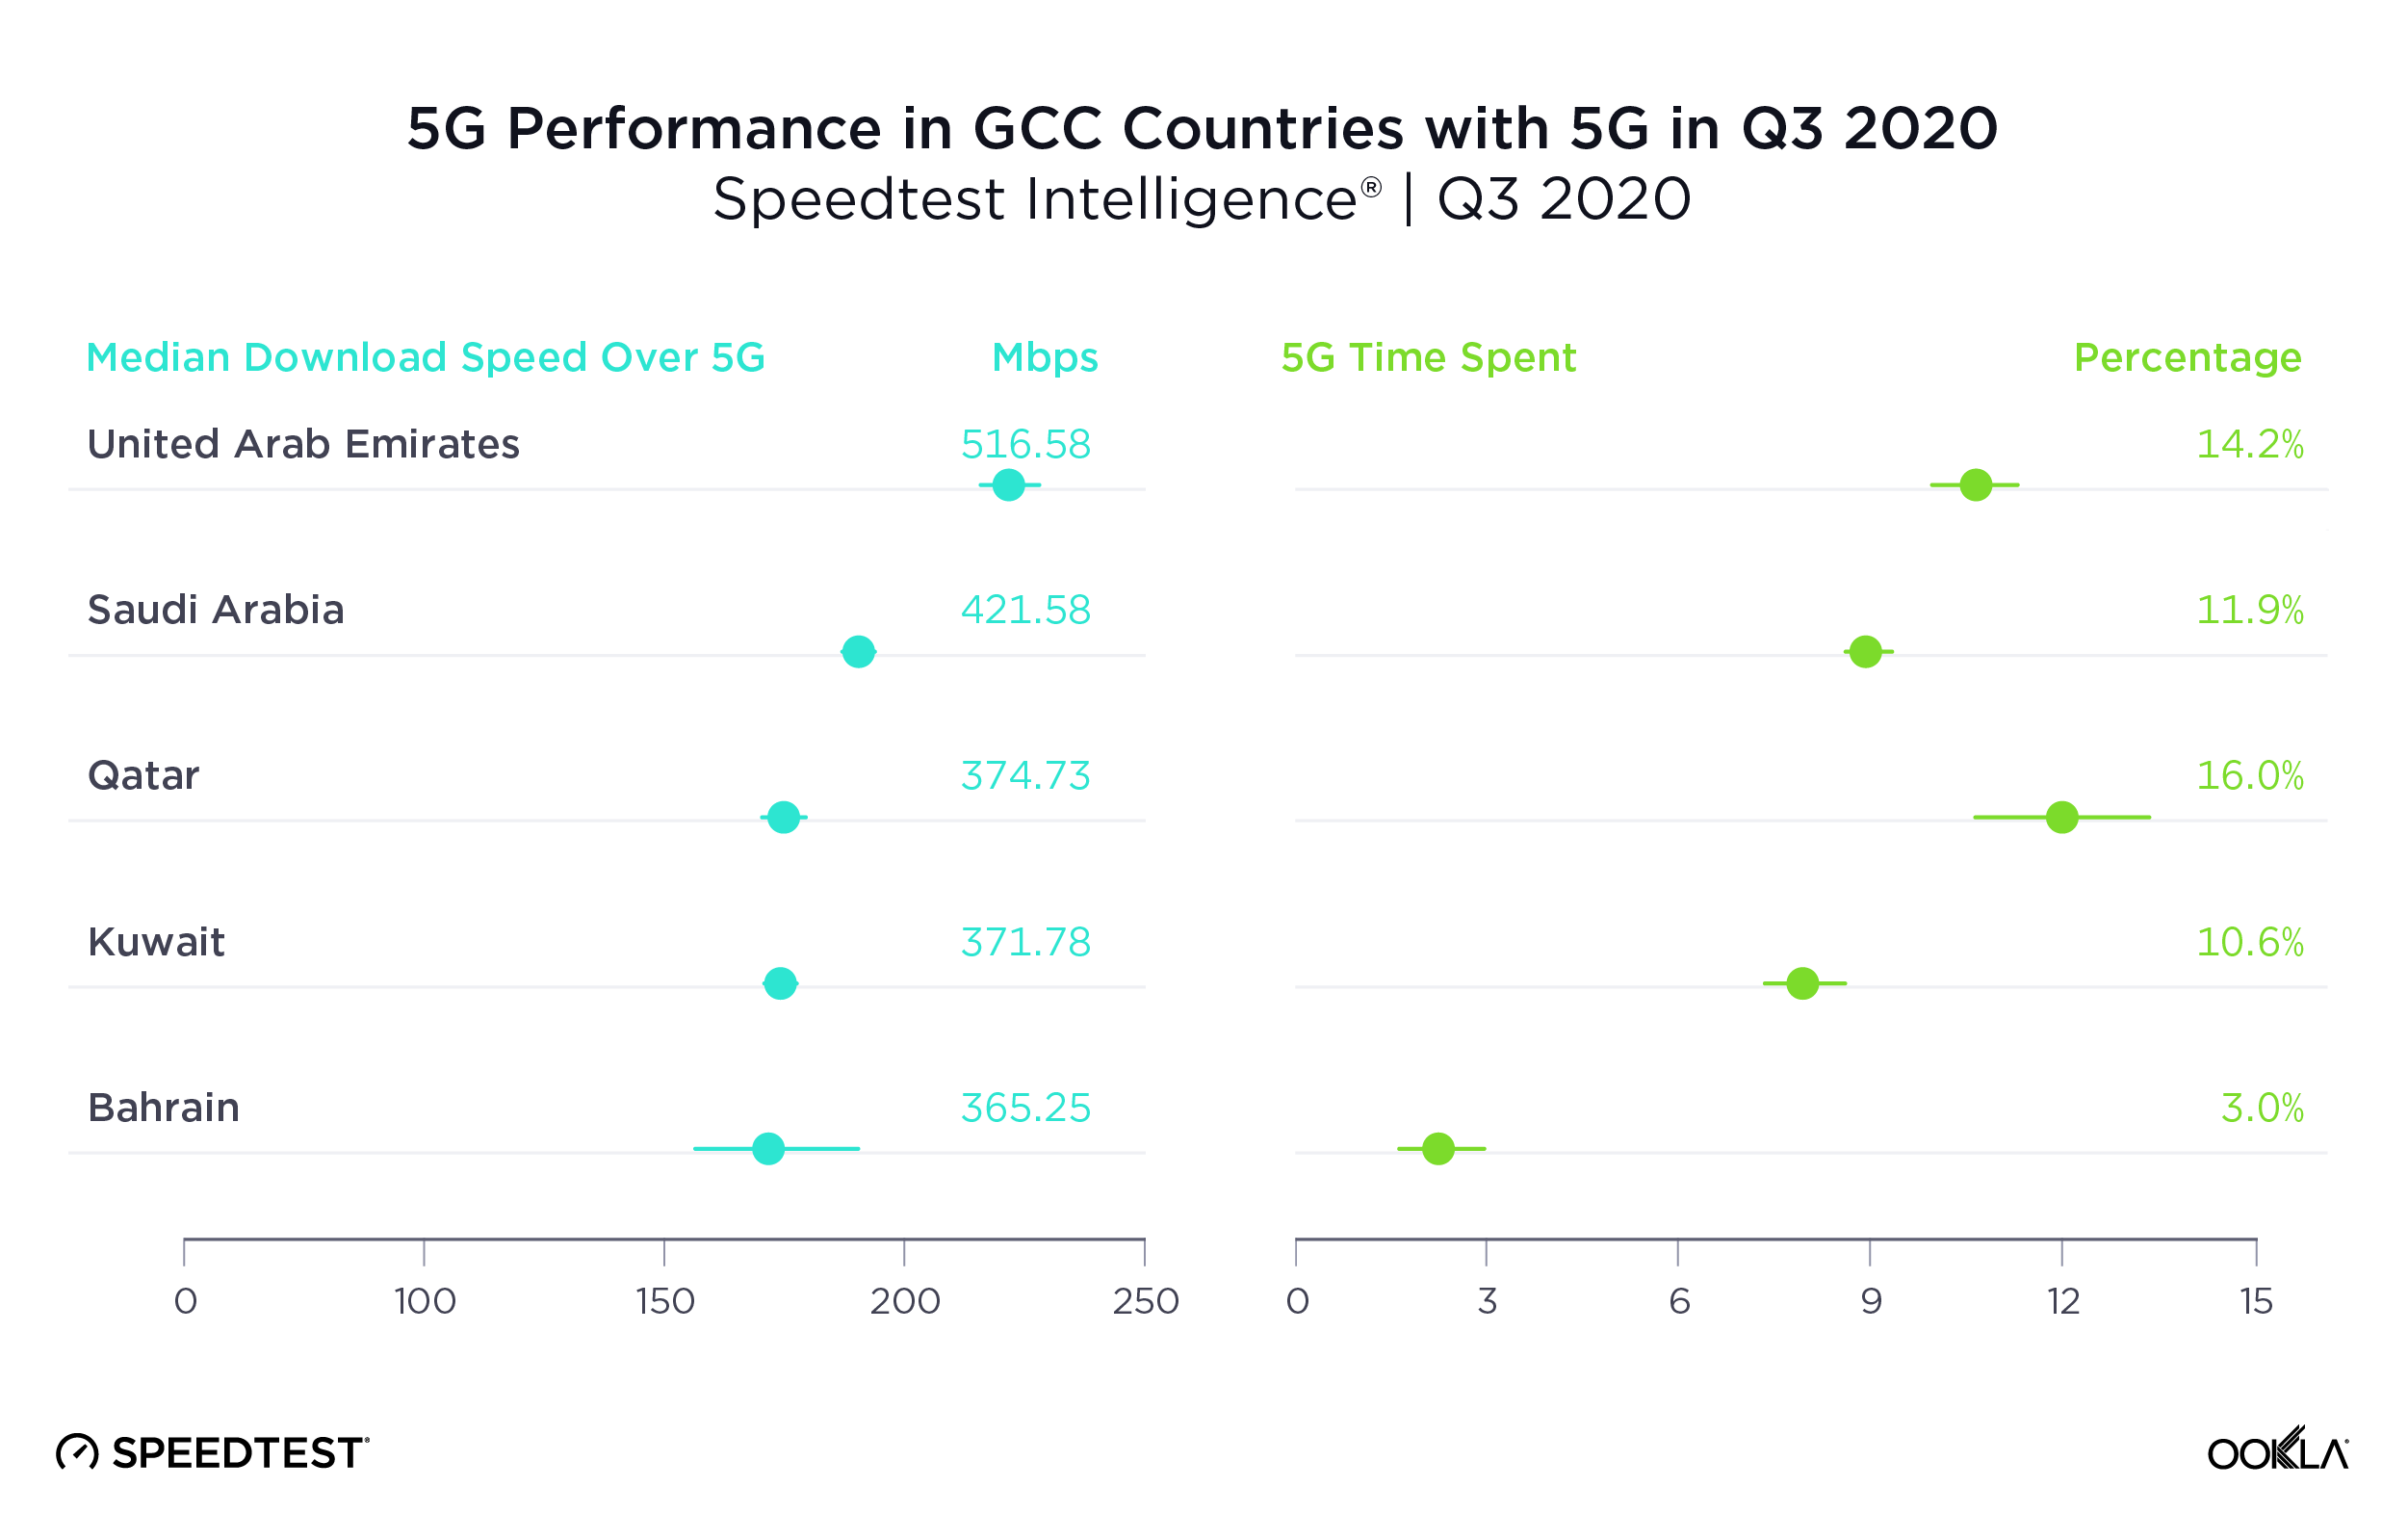
U.A.E had the fastest 5G in Gulf Cooperation Council Countries

With the second fastest median download speed over 5G in the world, U.A.E. was also the Gulf Cooperation Council (GCC) country with the fastest 5G during Q3 2020. Saudi Arabia was second and Qatar third. While Oman does have commercially available 5G, there were insufficient samples in the country during Q3 2020 to properly analyze performance.

5G represented the largest improvement over 4G in Kuwait and Bahrain, countries that had slower median download speeds over 4G than their neighbors.

Time Spent on 5G was relatively high in all the GCC countries on this list, except Bahrain, when compared to other countries in the world during Q3 2020. Qatar showed the highest Time Spent on 5G among GCC countries in Q3 2020 at 16.0%. U.A.E. was second and Saudi Arabia third.
5G-Performance-GCC_1220

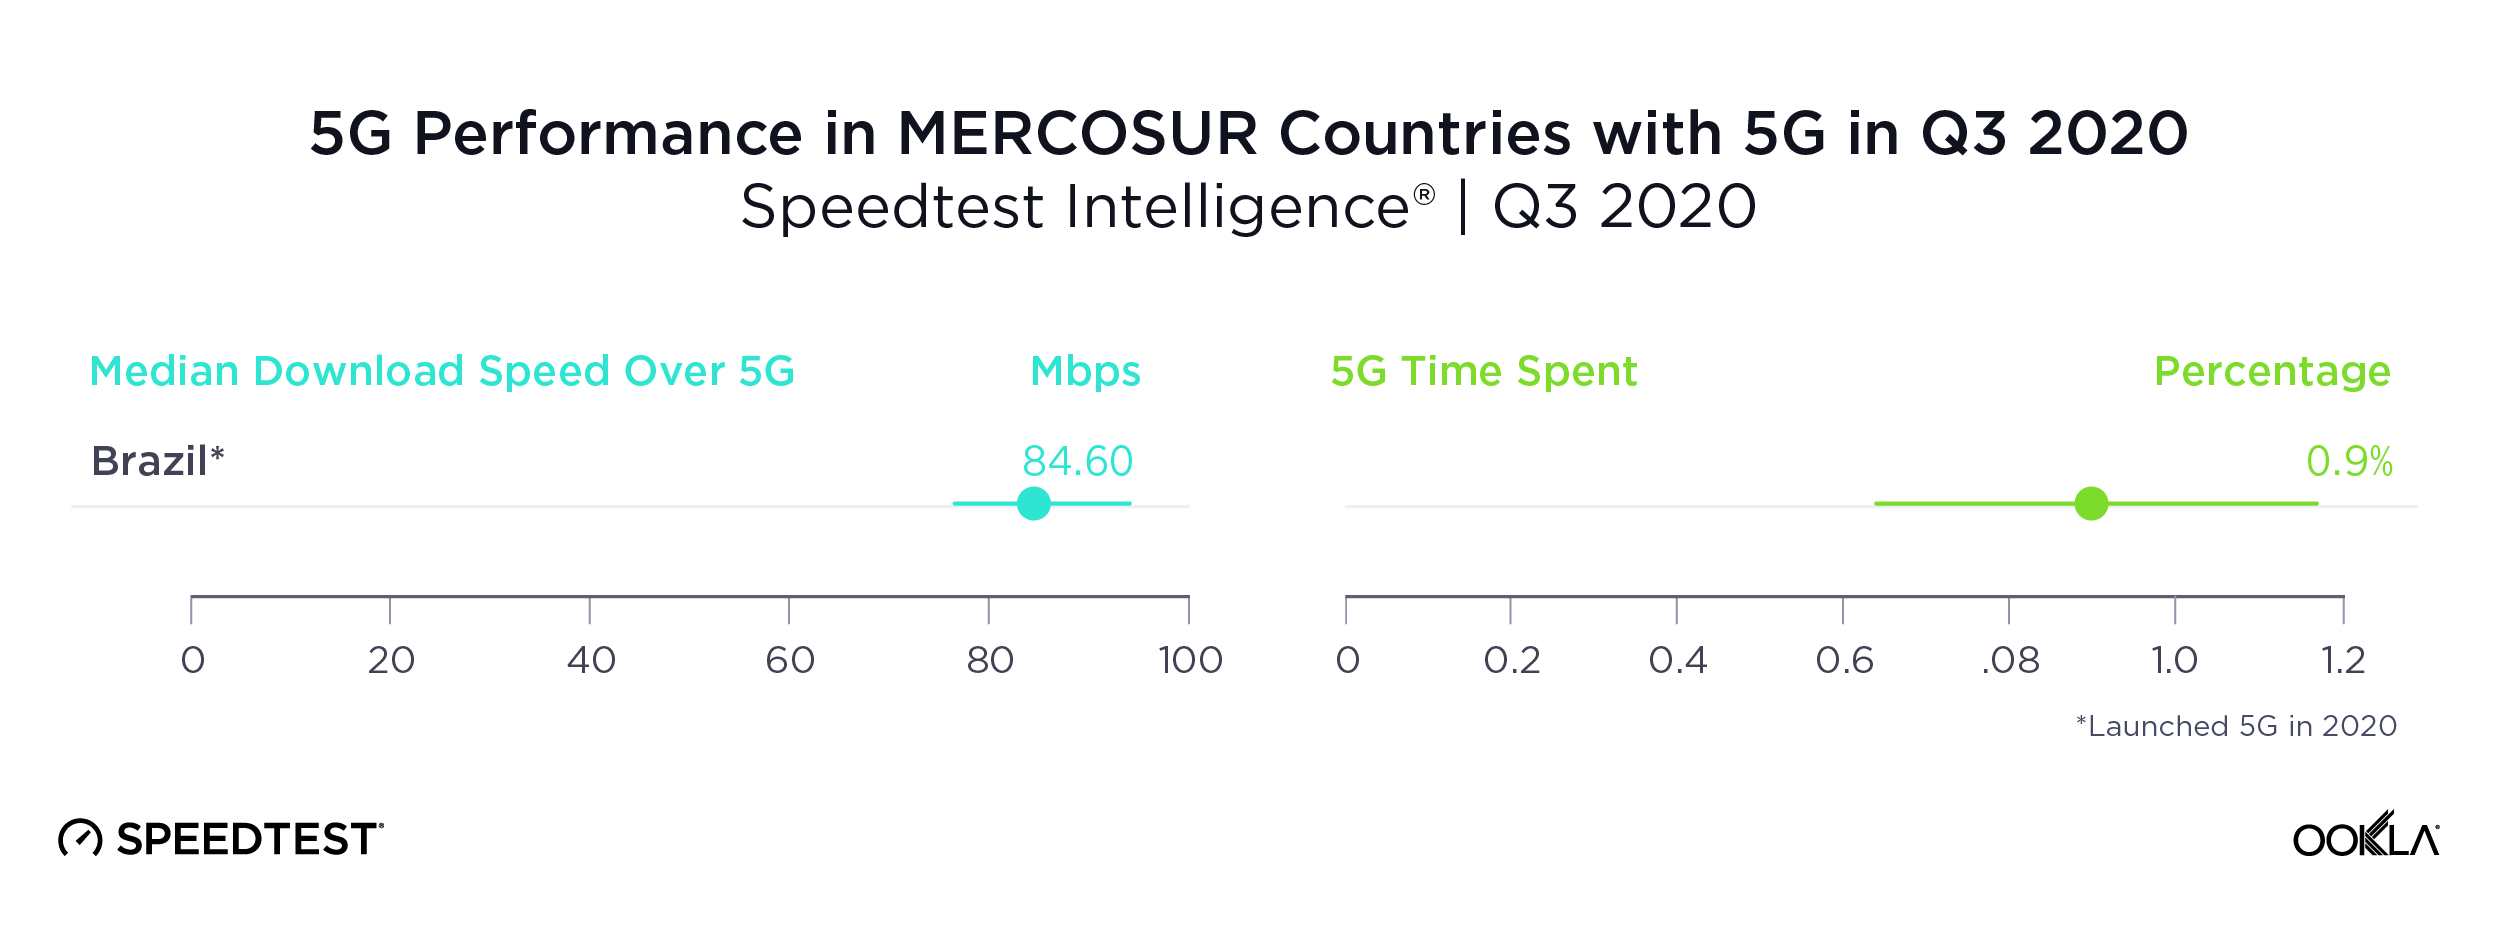
Brazil was the only MERCOSUR country with sufficient 5G to rate

Brazil’s median download speed over 5G of 84.60 Mbps during Q3 2020 may not seem fast for 5G, but it still puts Brazil well ahead of other countries in the Southern Common Market (MERCOSUR), most of which do not yet have 5G at all. We did see 5G results in Colombia, but there were insufficient samples to properly compare.

Time Spent on 5G in Brazil during Q3 2020 was not quite one percent, indicating that customers do not have much access to 5G yet.
5G-Performance-MERCOSUR_1220

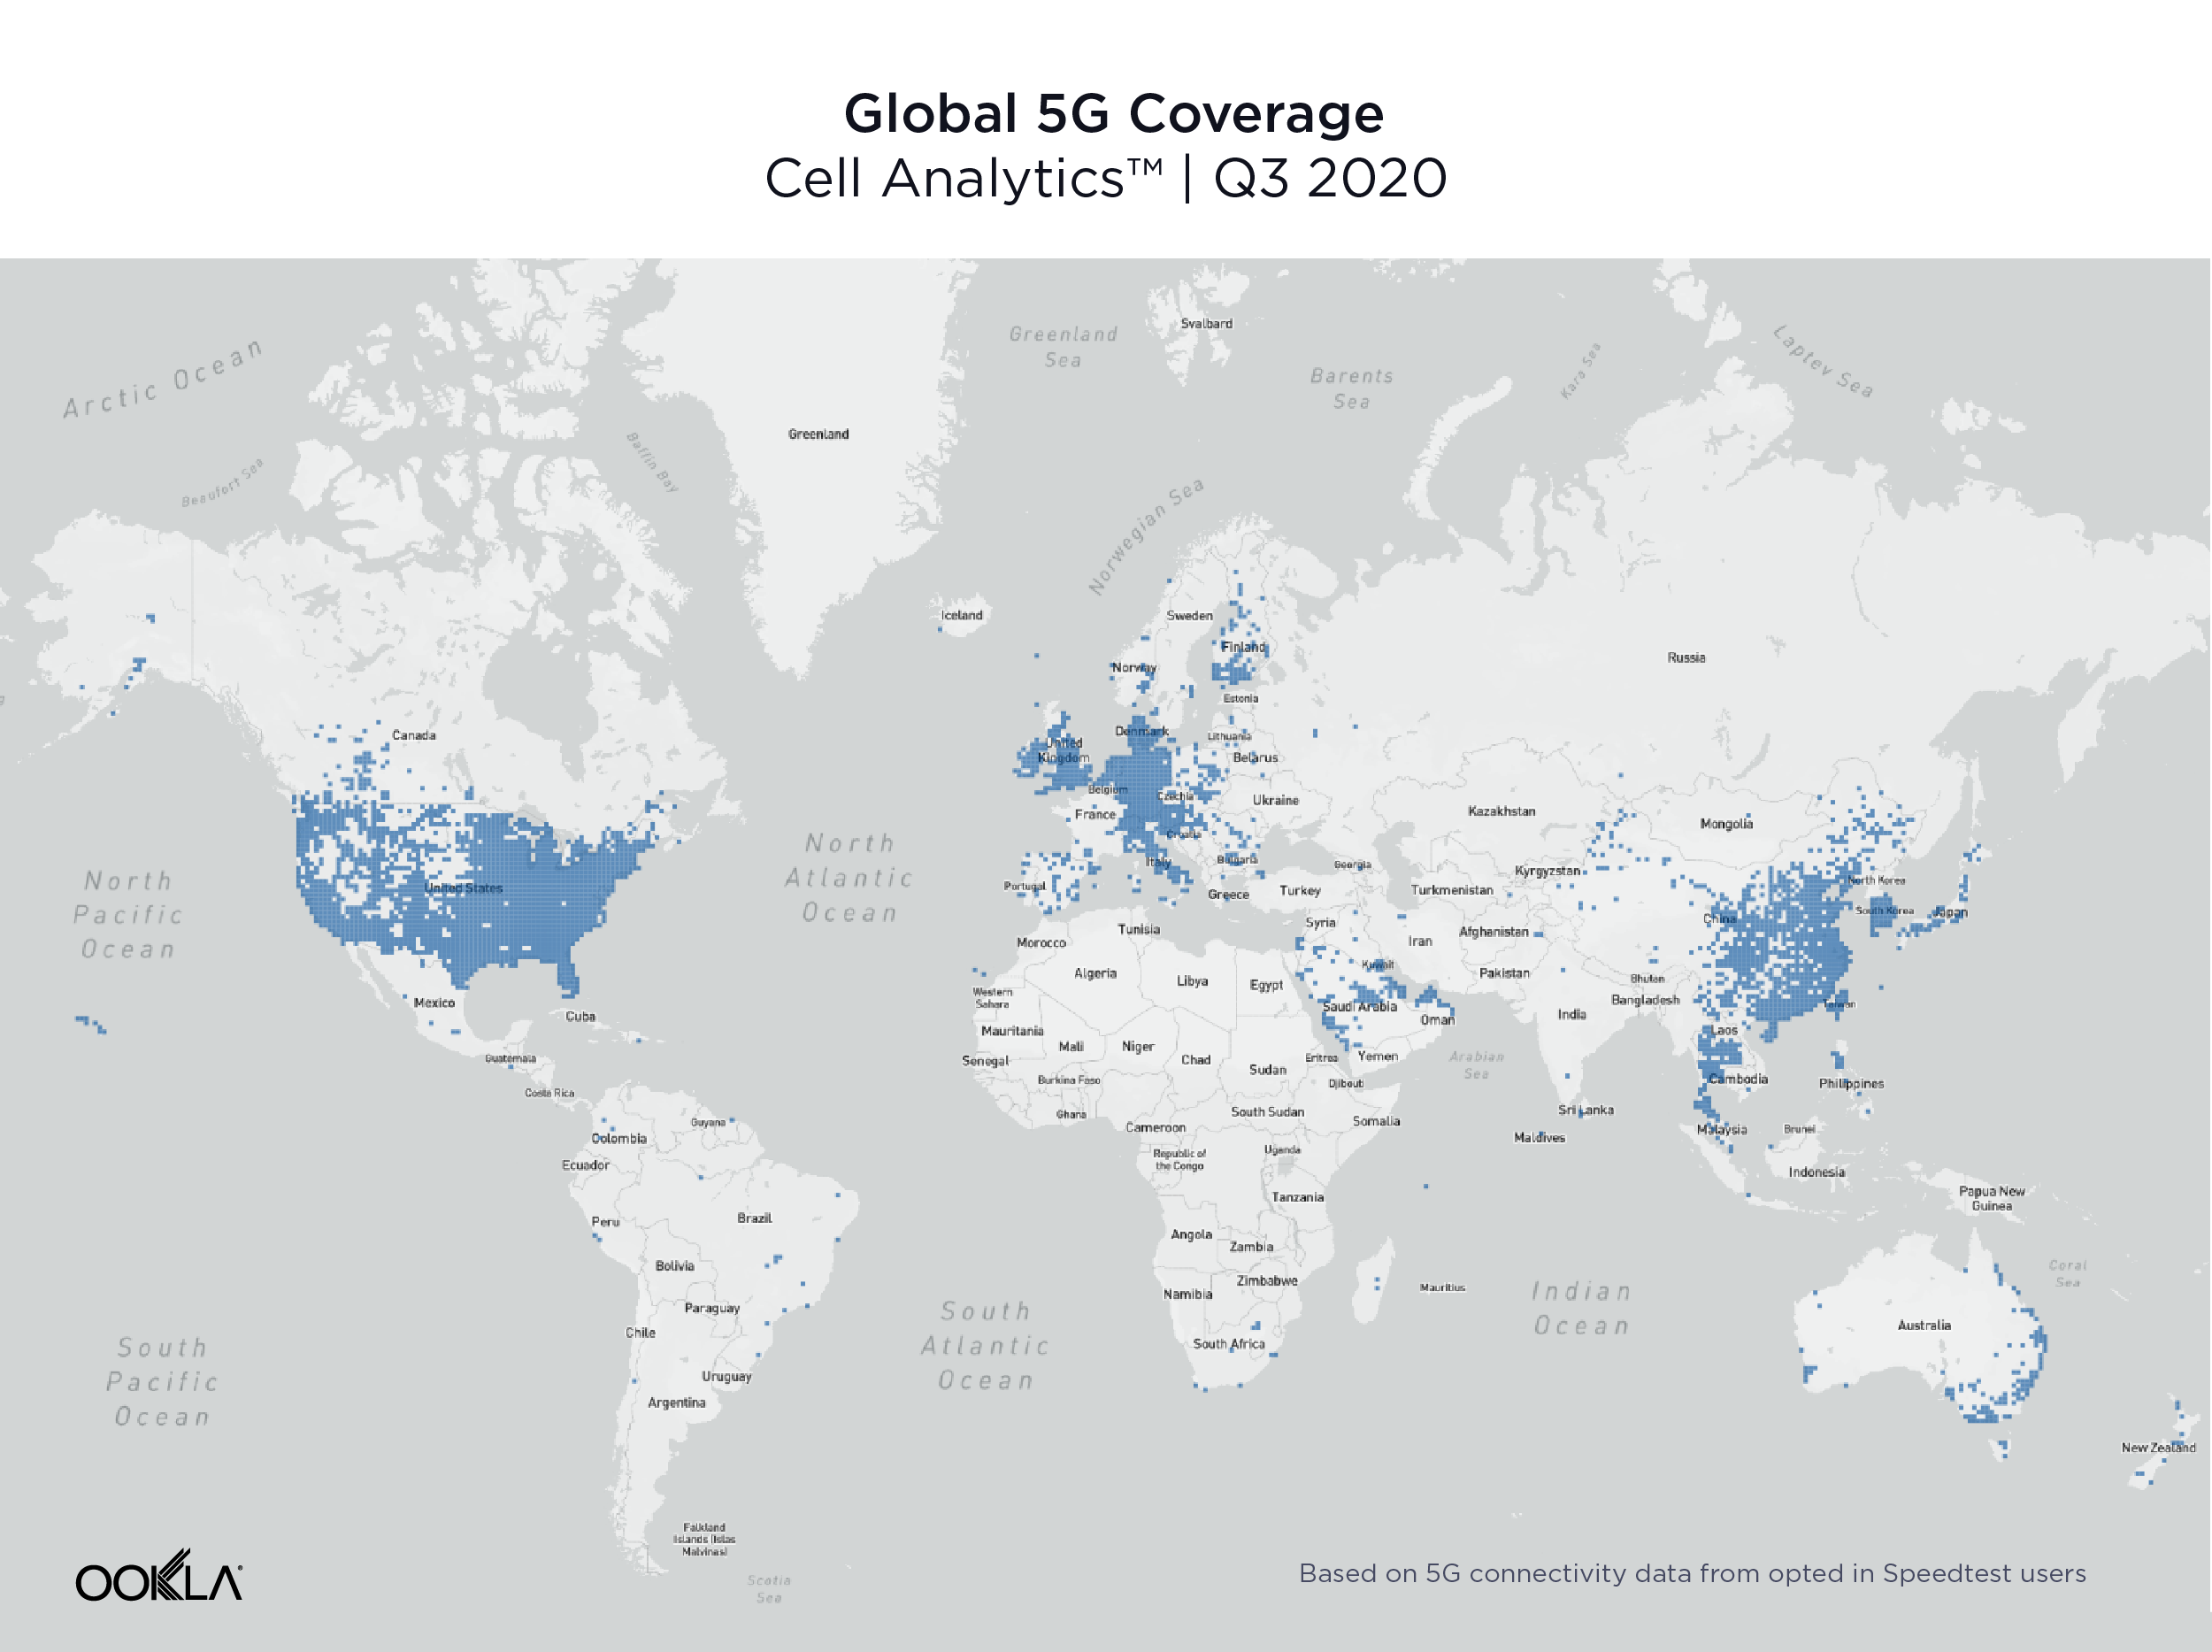
The U.S., Europe and Asia see widespread 5G coverage

Data from Cell Analytics™ shows a global view of 5G coverage in Q3 2020. This map, based on 5G connectivity data for opted-in Speedtest users, shows that 5G is spreading rapidly across the U.S., Europe, the Arabian Peninsula and Asia. In other regions, 5G is primarily available in larger cities, if at all.
Global-5G-Coverage_1220

99 countries worldwide had 5G, in 14,643 total cities

The number of countries with 5G deployments increased 62.3% between Q3 2019 and Q3 2020, with 99 countries having 5G deployments at the end of Q3 2020, according to the Ookla 5G Map™. There were 14,643 cities worldwide with 5G deployments at the end of Q3 2020, a 1,671% increase over Q3 2019. The total number of deployments worldwide was 17,046. The counts here and throughout this section include commercially available 5G as well as 5G networks with limited availability and those in pre-release.

Countries with the Most 5G Cities
Ookla 5G Map™ | Q3 2020
Country Numbers of Cities with 5G
United States 7,583
Germany 2,312
Austria 1,104
Netherlands* 1,009
Switzerland 554
Thailand* 325
Ireland 214
Puerto Rico 187
United Kingdom 169
Kuwait 97

The U.S. had the most cities with 5G deployments at the end of Q3 2020 with 7,583. Germany was second, Austria third, the Netherlands fourth and Switzerland fifth. A deployment is when a provider has some level of 5G presence in a city. A city can have multiple deployments when more than one provider is present.

Countries with the Largest Growth in Number of Deployments
Ookla 5G Map™ | Q3 2020
Country 5G Deployments as of Q3 2020 % Change Q3 2020 vs Q3 2019
Netherlands* 1,071 50,350%
Thailand* 451 32,401%
United States 7,808 21,566%
Germany 2,417 11,460%
Canada* 93 7,600%
Austria 1,173 4,918%
Ireland 236 4,180%
Poland 81 3,150%
Japan* 75 2,050%
Oman 50 2,000%

The Netherlands showed the largest percentage change in the number of 5G deployments between Q3 2019 and Q3 2020 with a 50,350% jump from two deployments in Q3 2019 to 1,071 in Q3 2020. Thailand saw the second largest percentage increase, the U.S. third, Germany fourth and Canada fifth.

Most early trials and commercial deployments of 5G spectrum allocations around the world have been centered around fallow swaths of the mid-band (3.3 GHz – 4.2 GHz) spectrum. With the recent commercialization of Dynamic Spectrum Sharing (DSS) across all major 5G infrastructure vendors, there is now increasing demand for 5G support on many existing 4G frequencies, ranging from 600 MHz to 2.5 GHz. In unique 5G markets like Japan, there is an additional need for the 4.5 GHz band as well as the millimeter wave (FR2).

In the United States, early deployments leveraged millimeter wave frequency bands in the 28 GHz and the 39 GHz, which delivered impressive speeds in a very constrained footprint. The rapid 5G deployment in the 600 MHz band has added a substantial nationwide 5G footprint — and with that, much wider 5G availability for many more Americans. With the recent merger between T-Mobile and Sprint, the deployment of 2.5 GHz spectrum has been significantly accelerated, which should improve both network efficiency and user experience on T-Mobile’s network. Additionally, next year’s availability of 5G Carrier Aggregation will allow T-Mobile to combine 600 MHz with 2.5 GHz to deliver improved 5G speeds on top of the existing nationwide footprint. In addition, DSS has recently been deployed by AT&T and Verizon, which allows operators to choose from existing low-band spectrum assets (850 MHz) and deliver both LTE and 5G at the same time. This feature alone doesn’t add a significant boost in perceived user experience, but will certainly improve the 5G footprint.

China showed the highest percentage of 5G test samples

Another way to measure 5G adoption is to look at the proportion of samples taken over 5G relative to the total number of samples on all technologies. Speedtest Intelligence is uniquely positioned to measure global growth in 5G because of the worldwide adoption of Speedtest apps. China had the highest percentage of 5G Speedtest results compared to other mobile technology types in Q3 2020 at 18.9%. South Korea was second, Hong Kong third, Puerto Rico fourth and Qatar fifth.

Countries with the Most 5G
Speedtest Intelligence® | Q3 2020
Country 5G Samples as a % of Total
China 18.9%
South Korea 15.8%
Hong Kong (S.A.R.)* 7.9%
Puerto Rico 6.7%
Qatar 5.7%
United States 5.5%
Netherlands* 4.9%
United Arab Emirates 4.6%
Kuwait 4.6%
Australia 4.2%

What 5G will look like in 2021

With recently announced device chipset advancements expected in 2021, including 5G Carrier Aggregation, operators will be able to combine two 5G frequency bands in the sub-6GHz (FR1) range, allowing not only faster speeds, but also greater coverage. More importantly, the ability to combine Frequency Division Duplexing (FDD) and Time Division Duplexing (TDD) FR1 channels will enable operators to leverage low-band frequencies (sub-1GHz) for uplink transmissions (user device to cell site), while combining the low-band with the mid-band (2.5 GHz, 3.5 GHz) on the downlink. This should significantly expand the availability of fast 5G download speeds across larger geographies.

Similarly, DSS — which is a stepping stone to standalone 5G and allows for the simultaneous delivery of 4G and 5G technology on the same spectrum slice — will enable operators to combine already-deployed FDD spectrum with dedicated mid-band spectrum for an enhanced standalone 5G experience. This will unlock the full potential of 5G networks, such as ultra low latency and network slicing, while delivering an improved mobile experience to users.

Where 5G fails to reach

During Q3 2020 Speedtest Intelligence showed 55 countries in the world (with more than 200 samples) where more than 20% of samples were from 2G and 3G connections (combined). These are countries where, in many cases, 5G is still aspirational. As excited as we are about the expansion of 5G, we do not want to see these countries left behind.

Countries That Still Rely Heavily on 2G and 3G Connections
Speedtest Intelligence® | Q3 2020
Country 2G & 3G Samples 4G Samples
Turkmenistan 74.9% 25.1%
Rwanda 52.3% 47.7%
Iraq 49.4% 50.6%
Belarus 46.5% 53.5%
Afghanistan 46.0% 54.0%
Antigua and Barbuda 40.2% 59.8%
Tajikistan 40.2% 59.8%
Suriname 39.7% 60.3%
Haiti 37.7% 62.3%
Syria 37.5% 62.5%
Ghana 36.0% 64.0%
Ethiopia 35.0% 65.0%
Mozambique 34.7% 65.3%
Benin 34.3% 65.7%
Angola 34.1% 65.9%
El Salvador 32.5% 67.5%
Moldova 31.8% 68.2%
Venezuela 30.3% 69.7%
Tanzania 30.0% 70.0%
Papua New Guinea 29.5% 70.5%
Jamaica 29.4% 70.6%
Sudan 29.2% 70.8%
Algeria 29.0% 71.0%
Namibia 28.5% 71.5%
Zimbabwe 28.5% 71.5%
Somalia 28.4% 71.6%
Nicaragua 28.1% 71.9%
Armenia 28.1% 71.9%
Bosnia and Herzegovina 28.1% 71.9%
Uzbekistan 27.8% 72.2%
Cameroon 27.5% 72.5%
Zambia 27.4% 72.6%
Uganda 26.6% 73.4%
Trinidad and Tobago 26.6% 73.4%
Honduras 26.5% 73.5%
Bangladesh 26.3% 73.7%
Burkina Faso 26.0% 74.0%
Ukraine 25.8% 74.2%
Nigeria 25.7% 74.3%
DR Congo 24.6% 75.4%
Costa Rica 24.3% 75.7%
Botswana 24.1% 75.9%
Libya 22.9% 77.1%
Azerbaijan 22.9% 77.1%
Ecuador 22.8% 77.2%
Mali 22.4% 77.6%
Mongolia 21.8% 78.2%
Maldives 21.6% 78.4%
Mauritius 21.3% 78.7%
Tunisia 21.0% 79.0%
Belize 20.7% 79.3%
Laos 20.5% 79.5%
Kenya 20.3% 79.7%
Paraguay 20.1% 79.9%
Côte d’Ivoire 20.0% 80.0%

In markets where 4G layers haven’t been deployed or substantially covered, end users fall back to the circuit-switched network (2G, 3G). These decades-old network technologies should be sufficient for basic voice and texting, social media, and navigation apps, but cannot deliver rich media experiences or video calling. Unfortunately, many countries on this list are places where consumers rely primarily on mobile phones for their internet connectivity.

5G is radically changing the speeds and capabilities of mobile networks around the world. If the current growth rate continues, it won’t be long before most nations have access to 5G. But there are nations and subsets of subscribers who may not see the benefits of 5G for years to come. We will continue reporting on 5G achievements across the globe and watching speeds in general on the Speedtest Global Index™.

Ookla retains ownership of this article including all of the intellectual property rights, data, content graphs and analysis. This article may not be quoted, reproduced, distributed or published for any commercial purpose without prior consent. Members of the press and others using the findings in this article for non-commercial purposes are welcome to publicly share and link to report information with attribution to Ookla.

| December 14, 2020

Exploring the Relationship Between Network Performance and NPS in Germany, Austria and Switzerland

Deutsche

While cultural ties bind the three countries in the DACH region (Germany, Austria and Switzerland), internet performance varies widely between them. Using data from Speedtest Intelligence®, we compared performance for mobile network operators (MNOs) and fixed broadband internet service providers (ISPs) across countries and at the provider level during Q3 2020. We also compared provider performance to Speedtest Consumer SentimentTM data on five-star ratings and Net Promoter Score (NPS) to understand how network performance impacts customer satisfaction.

Switzerland boasts the highest mobile and fixed broadband download speeds
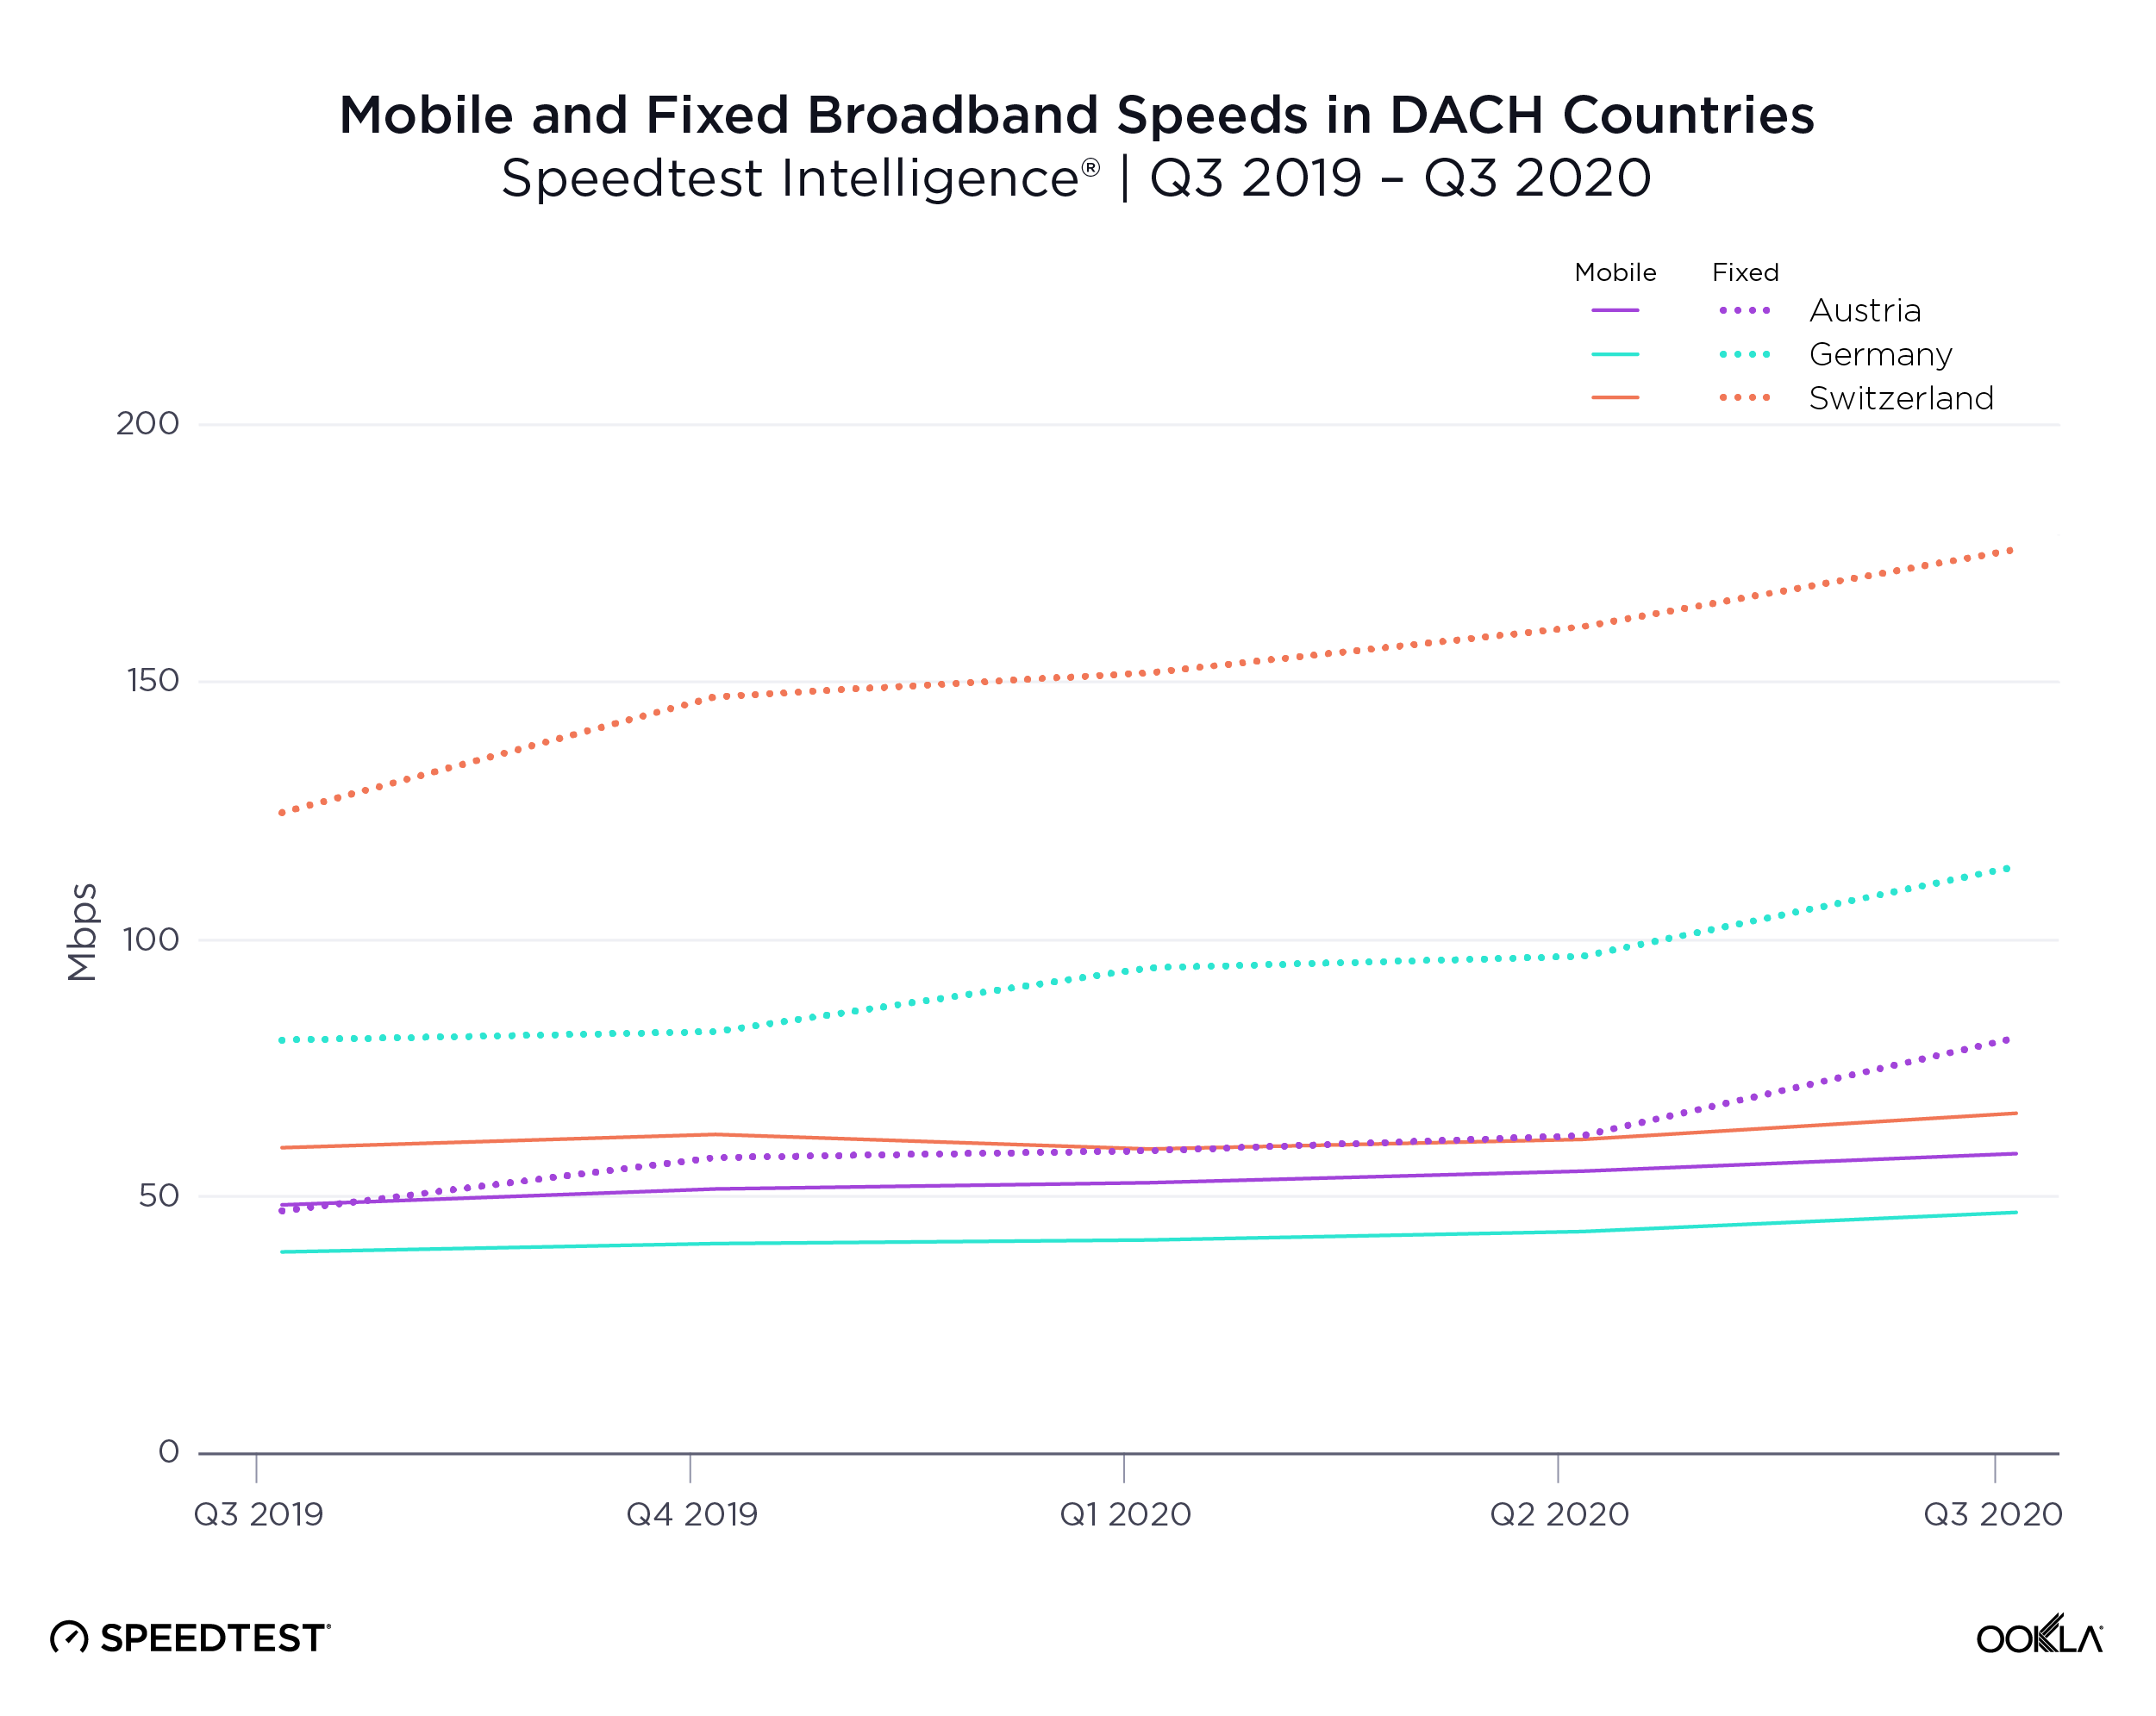
Speeds-Chart_Austria_Germany_Switzerland_1220_en-2

Switzerland outperformed Austria and Germany for mean mobile download speed with a mean download speed over mobile of 60.61 Mbps in Q3. Switzerland ranked 12th in the world on the Speedtest Global IndexTM as of September 2020. Austria, which had a mobile download speed of 52.76 Mbps in Q3 2020, ranked 20th in the world for mobile. Germany’s mobile download speed during Q3 2020 was 41.34 Mbps and the country ranked 35th. All three countries have invested heavily in 5G with Germany showing the largest number of cities with 5G deployments as of November 4, 2020, according to the Ookla 5G MapTM at 2,311. Switzerland had 554 and Austria 1,104. Interestingly, Switzerland actually saw a peak in mobile download speed during Q3 2020 after a decrease in Q1-Q2 2020.

On the fixed side, Switzerland fared even better with a mean download speed of 170.21 Mbps during Q3. Switzerland ranked 4th in the world for fixed broadband according to the Speedtest Global Index as of September 2020. Germany’s Q3 2020 download speed over fixed broadband was 108.57 Mbps and the country ranked 29th in the world. Austria had the lowest download speed over fixed broadband at 75.27 Mbps during Q3 2020 and ranked 50th for fixed broadband download speed. Switzerland was the only country of the three to show parity between download and upload speed over fixed broadband with a mean upload speed of 110.09 Mbps during Q3 2020. For comparison, Germany showed 25.84 Mbps and Austria was at 18.42 Mbps during the same period.

Fastest providers in Austria, Germany and Switzerland

We compared Q3 2020 internet performance for top providers in Austria, Germany and Switzerland using Speed ScoreTM. On mobile, these results consider only devices that use modern chipsets.

A1 (mobile) and Magenta (fixed broadband) are fastest in Austria

Internet Performance of Top Mobile Providers in Austria
Speedtest Intelligence® | Modern Chipsets in Q3 2020
Provider Speed Score
A1 61.55
3 43.55
Magenta Telekom 41.00

A1 had the fastest Speed Score among Austrian mobile operators at 61.55 during Q3 2020. Three showed the second fastest Speed Score, followed by Magenta Telekom.

Internet Performance of Top Fixed Providers in Austria
Speedtest Intelligence® | Q3 2020
Provider Speed Score
Magenta 81.21
3 26.39
A1 24.84

On the fixed broadband side at the national level, Magenta was the fastest provider in Austria during Q3 2020. Three was second, while A1 was third. While LIWEST, kabelplus and CableLink had higher Speed Scores than both 3 and A1, these regional providers are only available in select portions of the country.

Telekom (mobile) and Vodafone (fixed broadband) are fastest in Germany

Internet Performance of Top Mobile Providers in Germany
Speedtest Intelligence® | Modern Chipsets in Q3 2020
Provider Speed Score
Telekom 49.09
Vodafone 29.69
1&1 23.18
O2 22.65

Telekom was the fastest mobile operator in Germany during Q3 2020 with a Speed Score of 49.09, far above second-place Vodafone. 1&1 was third and O2 was fourth.

Internet Performance of Top Fixed Providers in Germany
Speedtest Intelligence® | Q3 2020
Provider Speed Score
Vodafone 103.57
Telekom 44.28
O2 38.38

Vodafone was the fastest fixed broadband provider in Germany during Q3 2020 with a Speed Score of 103.57. This was more than double that of second-place Telekom. O2 was third.

Switzerland’s fastest providers are Swisscom (mobile) and Salt (fixed broadband)

Internet Performance of Top Mobile Providers in Switzerland
Speedtest Intelligence® | Modern Chipsets in Q3 2020
Provider Speed Score
Swisscom 57.10
Sunrise 46.13
Salt 38.79

The fastest mobile operator in Switzerland during Q3 2020 was Swisscom with a Speed Score of 57.10. Sunrise was second and Salt third.

Internet Performance of Top Fixed Providers in Switzerland
Speedtest Intelligence® | Q3 2020
Provider Speed Score
Salt 290.89
UPC 150.45
Quickline 95.18
net+ 82.98
Sunrise 79.40
Swisscom 76.73

Salt was the fastest fixed broadband provider in Switzerland during Q3 2020 with a Speed Score of 290.89 — nearly twice as high as second-place UPC. Quickline was third, net+ was fourth, Sunrise fifth and Swisscom sixth.

We compared five-star ratings and NPS data to providers’ performance to understand how speeds impacted customer perceptions of German, Austrian and Swiss providers. Speedtest Consumer Sentiment data is gathered from single-question surveys presented to users at the end of a Speedtest®. This data set provides rich insights into customer satisfaction over time, as well as competitive benchmarking, by providing data on both Net Promoter Score (NPS) and customers’ overall satisfaction with their network providers.

Provider performance vs. ratings

Consumer Sentiment includes data on how users rate providers on a five-star scale. We compared ratings data from Austrian, German and Swiss providers in Q3 2020 with Speed Score to better understand the relationship between network performance and customers’ overall satisfaction with their network providers.

In Austria, A1 rated highest for mobile, kabelplus for fixed broadband

Internet Performance and Five-Star Ratings of Top Mobile Providers in Austria
Speedtest Intelligence® | Modern Chipsets in Q3 2020
Provider Speed Score Rating
A1 61.55 3.8
3 43.55 3.3
Magenta Telekom 41.00 3.4

Ratings aligned with performance in Austria during Q3 2020 with A1 coming first for ratings and Speed Score among Austrian mobile operators.

Internet Performance and Five-Star Ratings of Top Fixed Providers in Austria
Speedtest Intelligence® | Q3 2020
Provider Speed Score Rating
Magenta 81.21 3.2
3 26.39 3.0
A1 24.84 2.7

On fixed broadband, Magenta showed the highest rating among users in Austria during Q3 2020. Three was second and A1 was third for ratings on fixed broadband.

In Germany, Telekom highest rated for mobile, Telekom for fixed broadband

Internet Performance and Five-Star Ratings of Top Mobile Providers in Germany
Speedtest Intelligence® | Modern Chipsets in Q3 2020
Provider Speed Score Rating
Tekelom 49.09 3.9
Vodafone 29.69 3.1
1&1 23.18 3.0
O2 22.65 3.2

In Germany, the mobile operator with the highest rating, Telekom, was also the fastest provider during Q3 2020. The rest of the rankings did not follow the order of network performance, but the spread between rankings was relatively small.

Internet Performance and Five-Star Ratings of Top Fixed Providers in Germany
Speedtest Intelligence® | Q3 2020
Provider Speed Score Rating
Vodafone 103.57 2.9
Telekom 44.28 3.3
O2 38.38 3.1

On fixed broadband, the highest-rated provider in Germany during Q3 2020 was Telekom. Despite having a much higher Speed Score than competitors, Vodafone was rated lowest by consumers.

Swisscom rated highest for mobile in Switzerland, Salt for fixed broadband

Internet Performance and Five-Star Ratings of Top Mobile Providers in Switzerland
Speedtest Intelligence® | Modern Chipsets in Q3 2020

Provider Speed Score Rating
Swisscom 57.10 3.6
Sunrise 46.13 3.2
Salt 38.79 2.9

Swisscom was both the highest-rated mobile operator in Switzerland during Q3 2020 and the operator with the best Speed Score. The spread between highest- and lowest-rated mobile operators was very narrow at less than a star.

Internet Performance and Five-Star Ratings of Top Fixed Providers in Switzerland
Speedtest Intelligence® | Q3 2020
Provider Speed Score Rating
Salt 290.89 3.5
UPC 150.45 3.2
Quickline 95.18 3.5
net+ 82.98 3.5
Sunrise 79.40 3.4
Swisscom 76.73 3.5

On the fixed broadband side, Salt, net+, and Swisscom and Quickline tied for the highest rating in Switzerland during Q3 2020 despite a wide difference in Speed Score. The difference between the highest-rated provider and lowest-rated was again very small on fixed broadband.

Provider performance vs. NPS

Speedtest users are also asked how likely they are to recommend their provider to friends or family on a 0 to 10 scale. NPS ratings are categorized into Detractors (score 0-6), Passives (score 7-8), and Promoters (score 9-10). NPS is calculated as (% Promoters – % Detractors) x 100. Any NPS score above 0 indicates that a provider’s audience is more loyal than not. We compared the resulting Net Promoter Score (NPS) with Speed Score to see how performance relates to a user’s likelihood of recommending a provider.

A1 had highest NPS on mobile in Austria, kabelplus highest on fixed broadband

Internet Performance of Top Mobile Providers in Austria
Speedtest Intelligence® | Modern Chipsets in Q3 2020
Provider Speed Score NPS
A1 61.55 1.58
3 43.55 -39.67
Magenta Telekom 41.00 -20.18

A1 showed the highest NPS among mobile operators in Austria in Q3 2020, while Magenta Telekom and 3 showed negative NPS. This suggests that users were not to recommend these operators.

Internet Performance of Top Fixed Providers in Austria
Speedtest Intelligence® | Q3 2020
Provider Speed Score NPS
Magenta 81.21 -28.97
3 26.39 -36.00
A1 24.84 -51.63

Magenta had the highest NPS among fixed broadband providers in Austria in Q3 2020, followed by 3 and A1. No providers had positive NPS values.

Telekom had highest NPS on mobile and fixed broadband in Germany

Internet Performance of Top Mobile Providers in Germany
Speedtest Intelligence® | Modern Chipsets in Q3 2020
Provider Speed Score NPS
Tekelom 49.09 14.82
Vodafone 29.69 -37.74
1&1 23.18 -58.65
O2 22.65 -34.59

Not only did Telekom have the highest NPS on mobile in Germany during Q3 2020, it was also the only mobile operator with a positive NPS, indicating consumers were likely to recommend the operator. As we saw above, Telekom was also the fastest operator and the most highly rated.

Internet Performance of Top Fixed Providers in Germany
Speedtest Intelligence® | Q3 2020
Provider Speed Score NPS
Vodafone 103.57 -50.26
Telekom 44.28 -27.10
O2 38.38 -40.76

Telekom had the highest NPS among fixed broadband providers in Germany during Q3 2020. However, all fixed broadband providers showed negative NPS values.

Swisscom had highest NPS on mobile in Switzerland, Salt on fixed broadband

Internet Performance of Top Mobile Providers in Switzerland
Speedtest Intelligence® | Modern Chipsets in Q3 2020
Provider Speed Score NPS
Swisscom 57.10 -2.74
Sunrise 46.13 -24.66
Salt 38.79 -46.75

Along with having the highest Speed Score in Switzerland and earning the highest ratings from customers, Swisscom had the highest NPS on mobile in Switzerland during Q3 2020. That said, all Swiss mobile operators showed negative NPS values, suggesting that consumers were not likely to recommend these operators to friends or family.

Internet Performance of Top Fixed Providers in Switzerland
Speedtest Intelligence® | Q3 2020
Provider Speed Score NPS
Salt 290.89 -1.24
UPC 150.45 -23.70
Quickline 95.18 -18.29
net+ 82.98 -8.33
Sunrise 79.40 -10.93
Swisscom 76.73 -10.34

Salt, whose Speed Score was almost double that of its nearest competitor, had the highest NPS of any fixed broadband provider in Switzerland during Q3 2020. Among the other providers, speed rankings did not otherwise match the provider rankings for NPS in Switzerland, with second-fastest UPC showing the lowest NPS.

While the fastest speeds don’t always correlate to the highest ratings from customers, there is a clear relationship between the performance, quality and availability of networks and customer satisfaction. As more mobile operators in the DACH countries continue to deploy 5G — and high-speed fiber internet becomes more available in the region — it will be interesting to watch speeds continue to climb. We will continue to monitor both network metrics and Consumer Sentiment data for the region and to surface these insights so providers can understand how and where to improve their networks.


Untersuchung des Verhältnisses zwischen Netzwerkleistung und NPS in Deutschland, Österreich und der Schweiz

Die drei Länder der DACH-Region (Deutschland, Österreich und die Schweiz) sind zwar kulturell miteinander verbunden, aber die Leistungsfähigkeit des Internets ist sehr unterschiedlich. Mithilfe von Daten von Speedtest Intelligence® haben wir die Leistung von Mobilfunknetzbetreibern (MNOs) und Festnetz-Breitband-Internetdienstanbietern (ISPs) in verschiedenen Ländern und auf Anbieterebene im 3. Quartal 2020 verglichen. Wir haben auch die Leistung der Anbieter mit Speedtest Consumer Sentiment™-Daten zu Fünf-Sterne-Ratings und dem Net Promoter Score (NPS) verglichen, um zu verstehen, wie sich die Netzleistung auf die Kundenzufriedenheit auswirkt.

Die Schweiz verfügt über die höchsten Geschwindigkeiten beim Mobilfunk- und Festnetz-Breitband-Download
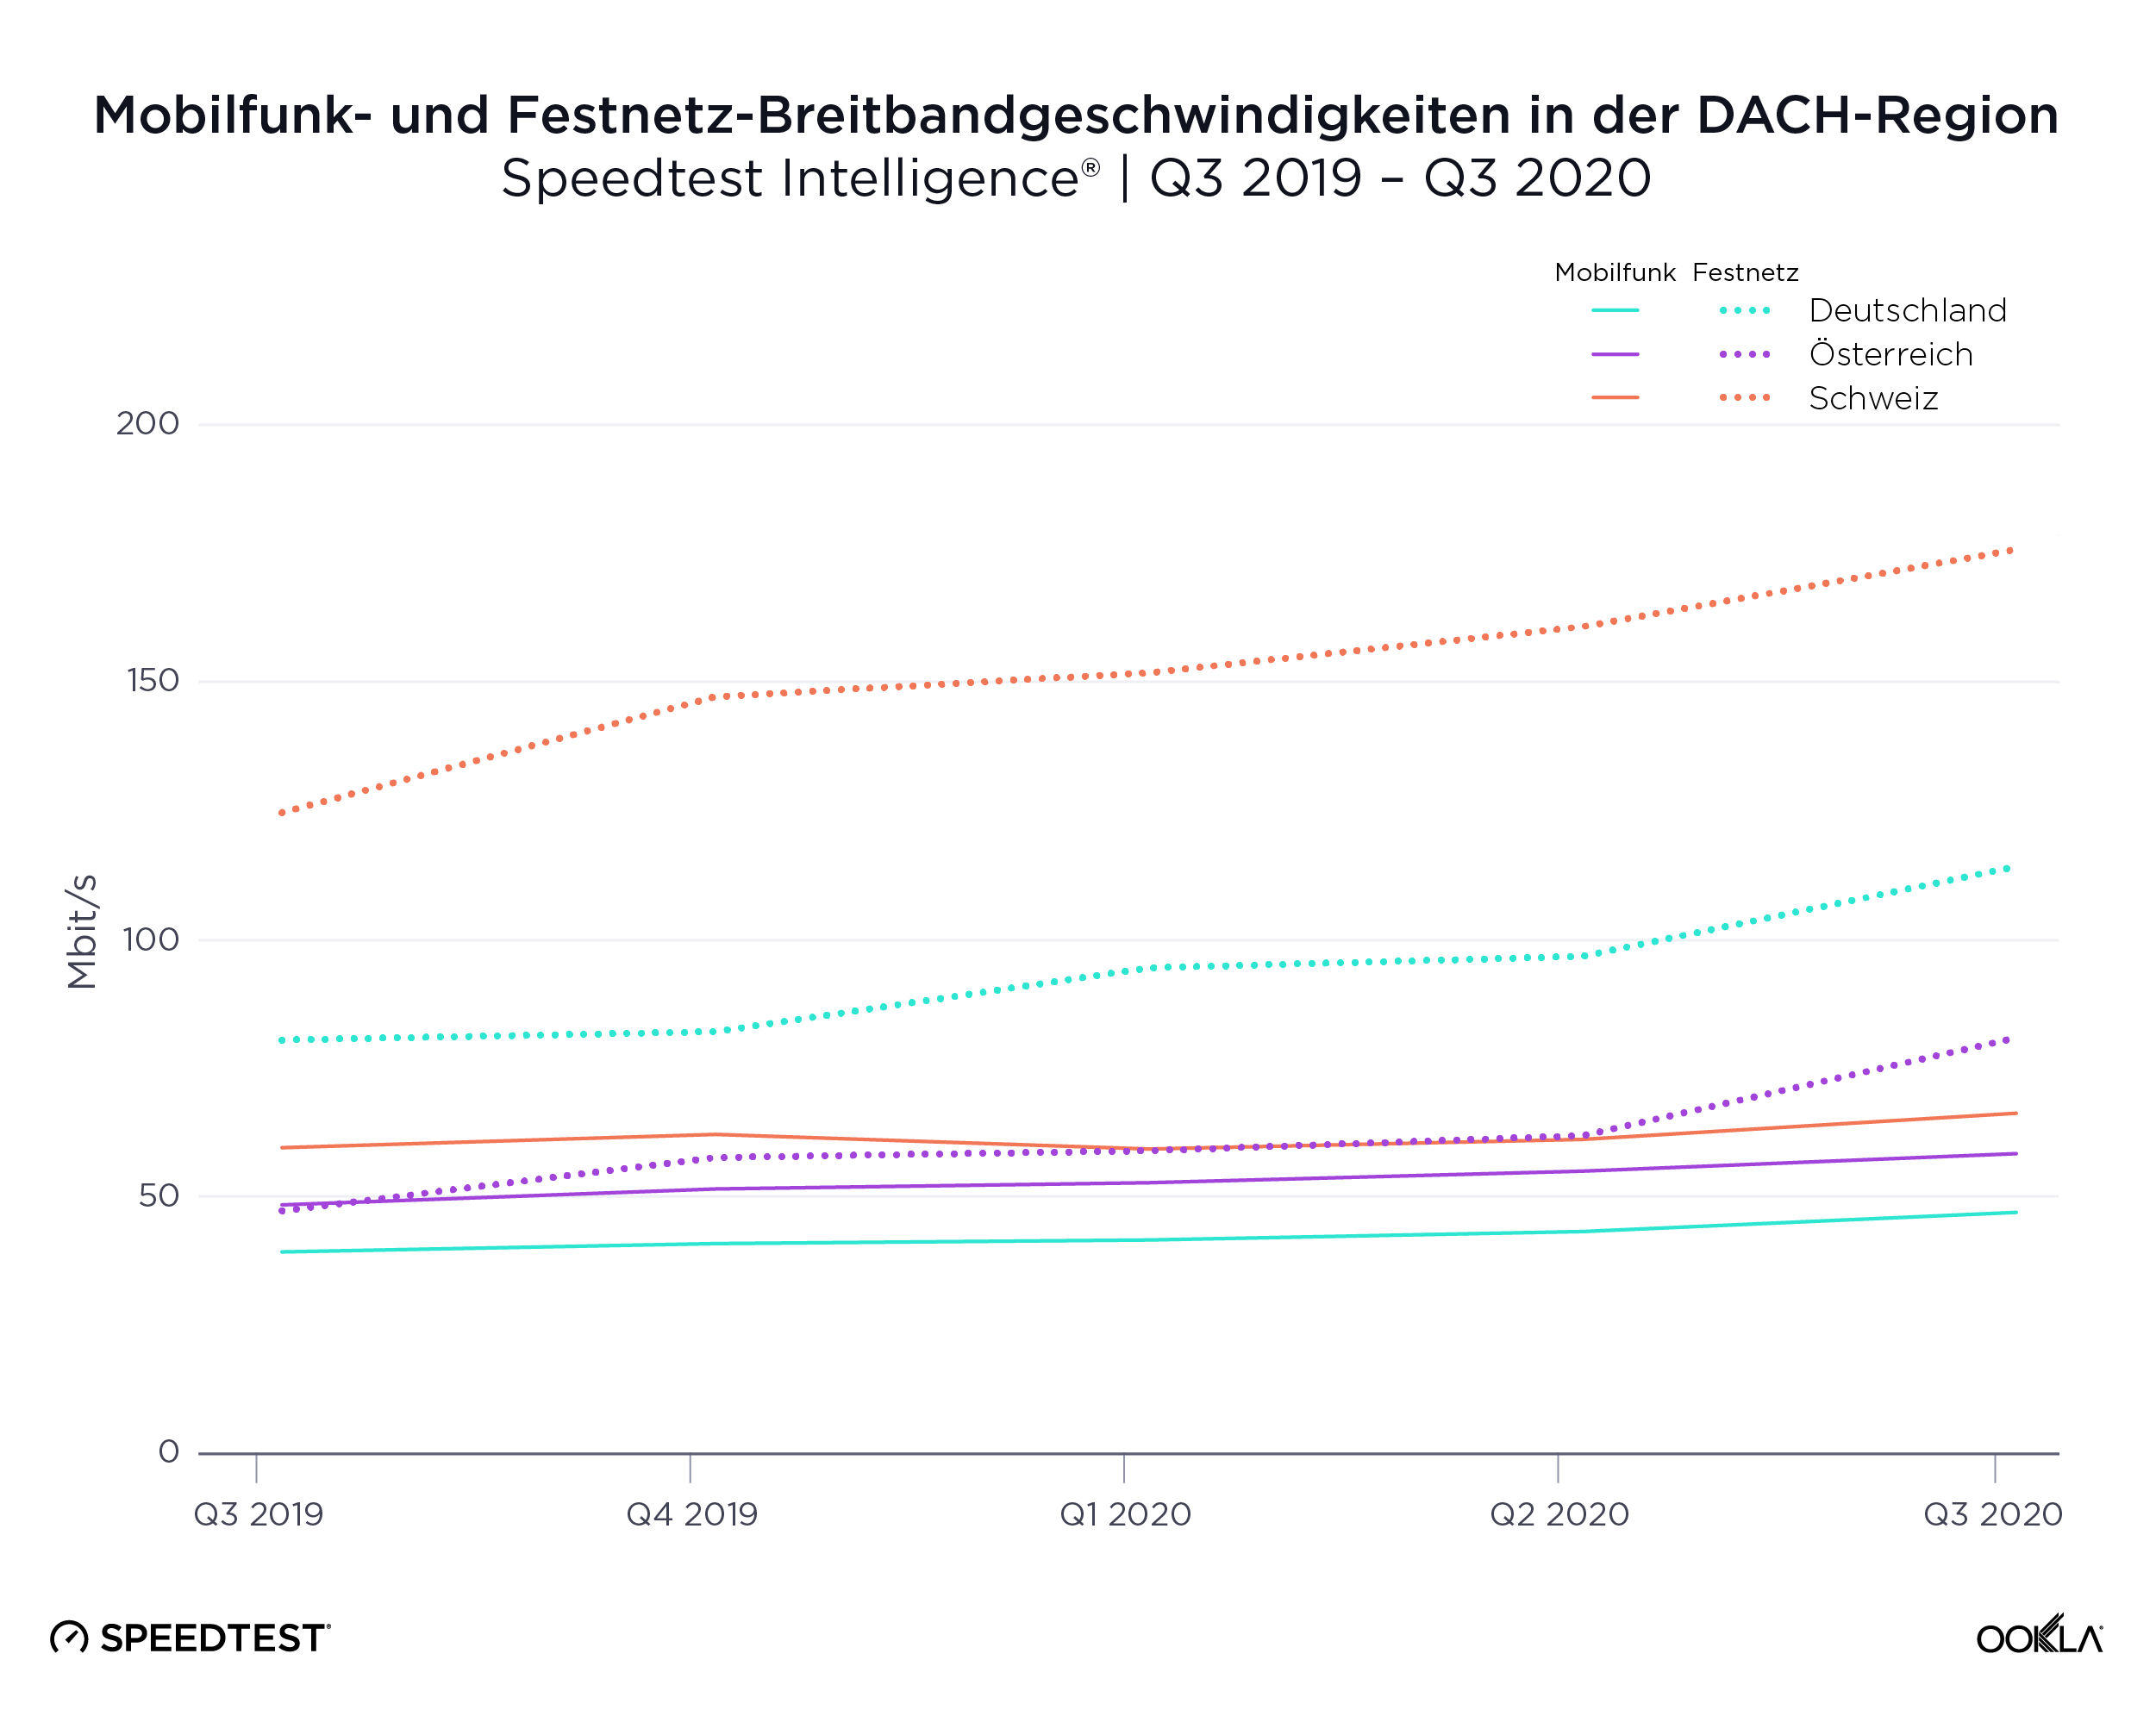
Speeds-Chart_Austria_Germany_Switzerland_1220_de-1

Die Schweiz übertraf Österreich und Deutschland in Bezug auf die durchschnittliche mobile Downloadgeschwindigkeit: Sie erreichte einen Durchschnittswert von 60,61 Mbit/s im dritten Quartal. Die Schweiz belegte im September 2020 weltweit Platz 12 im Speedtest Global IndexTM. Österreich schaffte es mit einer Downloadgeschwindigkeit von 52,76 Mbit/s im Mobilfunk im 3. Quartal 2020 weltweit auf Platz 20. Deutschland wies im 3. Quartal 2020 eine Mobilfunk-Downloadgeschwindigkeit von 41,34 Mbit/s auf und belegte Platz 35. Alle drei Länder haben in großem Umfang in 5G investiert, wobei Deutschland laut der Europäischen Kommission am 4. November 2020 die größte Anzahl von Städten mit 5G-Installationen aufwies. Laut der Ookla 5G MapTM belief sich die Zahl der Installationen auf 2.311. In der Schweiz waren es 554, in Österreich 1.104. Interessanterweise erlebte die Schweiz nach einem Rückgang im Q1-Q2 2020 in Q3 2020 sogar einen Höhepunkt der mobilen Downloadgeschwindigkeit.

Auf der Festnetzseite schnitt die Schweiz mit einer durchschnittlichen Downloadgeschwindigkeit von 170,21 Mbit/s im dritten Quartal noch besser ab. Laut dem Speedtest Global Index vom September 2020 belegte die Schweiz weltweit den 4. Platz im Bereich Festnetz-Breitband. Deutschlands Downloadgeschwindigkeit im 3. Quartal 2020 über Festnetz-Breitband betrug 108,57 Mbit/s und das Land belegte weltweit Platz 29. Österreich hatte im 3. Quartal 2020 mit 75,27 Mbit/s die niedrigste Downloadgeschwindigkeit über Festnetz-Breitband und belegte damit Platz 50. Die Schweiz war das einzige der drei Länder, das im 3. Quartal 2020 mit einer durchschnittlichen Upload-Geschwindigkeit von 110,09 Mbit/s einen gleichen Wert für die Download- und Upload-Geschwindigkeit über Festnetz-Breitband-Verbindungen aufwies. Zum Vergleich: Im selben Zeitraum beliefen sich die Werte in Deutschland auf 25,84 Mbit/s und in Österreich auf 18,42 Mbit/s.

Schnellste Anbieter in Österreich, Deutschland und der Schweiz

Wir verglichen die Internetleistung in Q3 2020 der Top-Anbieter in Österreich, Deutschland und der Schweiz mit Speed ScoreTM. Im Mobilfunkbereich werden hier nur Geräte berücksichtigt, die moderne Chipsätze verwenden.

A1 (Mobilfunk) und Magenta (Festnetz-Breitband) sind in Österreich am schnellsten

Internetleistung der Top-Mobilfunkanbieter in Österreich
Speedtest Intelligence® | Moderne Chipsätze in Q3 2020
Anbieter Speed Score
A1 61,55
3 43,55
Magenta Telekom 41,00

A1 hatte von allen Mobilfunkanbietern in Österreich in Q3 2020 mit 61,55 den schnellsten Speed Score. Three erreichte den zweitschnellsten Speed Score, gefolgt von Magenta Telekom.

Internetleistung der Top-Festnetz-Breitband-Anbieter in Österreich
Speedtest Intelligence® | Q3 2020
Anbieter Speed Score
Magenta 81,21
3 26,39
A1 24,84

Auf der Festnetz-Breitband-Seite auf nationaler Ebene war Magenta im 3. Quartal 2020 der schnellste Anbieter in Österreich. Three belegte den zweiten und A1 den dritten Platz. LIWEST, kabelplus und CableLink hatten zwar höhere Speed Scores als 3 und A1, aber diese regionalen Anbieter sind nur in Teilen Österreichs verfügbar.

Telekom (Mobilfunk) und Vodafone (Festnetz-Breitband) sind in Deutschland am schnellsten

Internetleistung der Top-Mobilfunkanbieter in Deutschland
Speedtest Intelligence® | Modern Chipsets in Q3 2020
Anbieter Speed Score
Telekom 49,09
Vodafone 29,69
1&1 23,18
O2 22,65

Telekom war in Q3 2020 der schnellste Mobilfunkanbieter in Deutschland und lag mit einem Speed Score von 49,09 weit vor dem Zweitplatzierten Vodafone. Platz 3 belegt 1&1 und O2 war auf dem vierten Platz.

Internetleistung der Top-Festnetz-Breitband-Anbieter in Deutschland
Speedtest Intelligence® | Q3 2020
Anbieter Speed Score
Vodafone 103,57
Telekom 44,28
O2 38,38

Vodafone war mit einem Speed Score von 103,57 der schnellste Festnetz-Breitband-Anbieter in Deutschland in Q3 2020. Der Speed Score war doppelt so hoch wie beim Zweitplatzierten, der Telekom. O2 belegte Platz 3.

Die schnellsten Anbieter in der Schweiz sind Swisscom (Mobilfunk) und Salt (Festnetz-Breitband)

Internetleistung der Top-Mobilfunkanbieter in der Schweiz
Speedtest Intelligence® | Modern Chipsets in Q3 2020
Anbieter Speed Score
Swisscom 57,10
Sunrise 46,13
Salt 38,79

Der schnellste Mobilfunkanbieter in der Schweiz in Q3 2020 war Swisscom mit einem Speed Score von 57,10. Sunrise war zweiter und Salt dritter.

Internetleistung der Top-Festnetz-Breitband-Anbieter in der Schweiz
Speedtest Intelligence® | Q3 2020
Anbieter Speed Score
Salt 290,89
UPC 150,45
Quickline 95,18
net+ 82,98
Sunrise 79,40
Swisscom 76,73

Salt war in Q3 2020 der schnellste Festnetz-Breitband-Anbieter in der Schweiz und erreichte einen Speed Score von 290,89, fast zweimal so viel wie der Zweitplatzierte UPC. Quickline belegte Platz 3, net+ Platz 4, Sunrise Platz 5 und Swisscom Platz 6.

Wir haben Fünf-Sterne-Ratings und NPS-Daten mit der Leistung der Anbieter verglichen, um zu verstehen, wie sich die Geschwindigkeit auf die Kundenwahrnehmung deutscher, österreichischer und schweizerischer Anbieter auswirkte. Speedtest Consumer Sentiment-Daten werden über Umfragen mit einer einzigen Frage gesammelt, die den Anwendern am Ende eines Speedtest® angezeigt werden. Dieser Datensatz bietet wertvolle Einblicke in die Kundenzufriedenheit im Laufe der Zeit sowie Wettbewerbsvergleiche, indem er Daten sowohl zum Net Promoter Score (NPS) als auch zur Gesamtzufriedenheit der Kunden mit ihren Netzbetreibern liefert.

Anbieterleistung vs. Bewertungen

Consumer Sentiment erfasst Daten darüber, wie Anwender Anbieter auf einer Skala von eins bis fünf bewerten. Wir haben Bewertungsdaten aus österreichischen, deutschen und schweizer Anbietern in Q3 2020 mit Speed Score verglichen, um die Beziehung zwischen Netzwerkleistung und der Zufriedenheit der Kunden insgesamt mit ihren Netzwerkanbietern zu analysieren.

In Österreich bekam A1 die besten Bewertungen für Mobilfunk und kabelplus schnitt am besten beim Festnetz-Breitband ab

Internetleistung und Fünf-Sterne-Bewertungen der Top-Mobilfunkanbieter in Österreich
Speedtest Intelligence® | Modern Chipsets in Q3 2020
Anbieter Speed Score Bewertung
A1 61,55 3,8
3 43,55 3,3
Magenta Telekom 41,00 3,4

Die Bewertungen deckten sich in Österreich im 3. Quartal 2020 mit der Leistung, wobei A1 bei den Bewertungen und beim Speed Score unter den österreichischen Mobilfunkbetreibern den ersten Platz belegt.

Internetleistung und Fünf-Sterne-Bewertungen der Top-Festnetz-Breitband-Anbieter in Österreich
Speedtest Intelligence® | Q3 2020
Anbieter Speed Score Bewertung
Magenta 81,21 3,2
3 26,39 3,0
A1 24,84 2,7

Im Festnetz-Breitband-Bereich erhielt Magenta die besten Anwenderbewertungen in Q3 2020. Three belegte bei den Bewertungen für Festnetz-Breitband den zweiten Platz und A1 den dritten.

In Deutschland schnitt die Telekom bei den Bewertungen für Mobilfunk und Festnetz-Breitband am besten ab

Internetleistung und Fünf-Sterne-Bewertungen der Top-Mobilfunkanbieter in Deutschland
Speedtest Intelligence® | Modern Chipsets in Q3 2020
Anbieter Speed Score Bewertung
Tekelom 49,09 3,9
Vodafone 29,69 3,1
1&1 23,18 3,0
O2 22,65 3,2

In Deutschland war der Mobilfunkbetreiber mit den besten Bewertungen, die Telekom, gleichzeitig auch der schnellste Anbieter in Q3 2020. Die weitere Platzverteilung entsprach nicht der Reihenfolge der Netzwerkleistung, aber die Spanne zwischen den Platzierungen war relativ gering.

Internetleistung und Fünf-Sterne-Bewertungen der Top-Festnetz-Breitband-Anbieter in Deutschland
Speedtest Intelligence® | Q3 2020
Anbieter Speed Score Bewertung
Vodafone 103,57 2,9
Telekom 44,28 3,3
O2 38,38 3,1

Im Bereich Festnetz-Breitband schnitt die Telekom in Deutschland bei den Bewertungen in Q3 2020 am besten ab. Obwohl der Speed Score von Vodafone deutlich höher war, als bei anderen Mitbewerbern, fielen die Bewertungen der Verbraucher hier am niedrigsten aus.

Swisscom erhielt die besten Bewertungen für den Mobilfunkbereich in der Schweiz und Salt schnitt am besten bei Festnetz-Breitband ab

Internetleistung und Fünf-Sterne-Bewertungen der Top-Mobilfunkanbieter in der Schweiz
Speedtest Intelligence® | Modern Chipsets in Q3 2020
Anbieter Speed Score Bewertung
Swisscom 57,10 3,6
Sunrise 46,13 3,2
Salt 38,79 2,9

Swiscom wurde in Q3 2020 als bester Mobilfunkbetreiber in der Schweiz bewertet und hatte auch den besten Speed Score. Die Differenz zwischen den am besten und am schlechtesten bewerteten Mobilfunkbetreibern war sehr knapp und betrug weniger als einen Stern.

Internetleistung und Fünf-Sterne-Bewertungen der Top-Festnetz-Breitband-Anbieter in der Schweiz
Speedtest Intelligence® | Q3 2020
Anbieter Speed Score Bewertung
Salt 290,89 3,5
UPC 150,45 3,2
Quickline 95,18 3,5
net+ 82,98 3,5
Sunrise 79,40 3,4
Swisscom 76,73 3,5

Im Bereich Festnetz-Breitband gab es bei den Bewertungen einen Gleichstand: Salt, net+, Swisscom und Quickline belegten in Q3 2020 alle den ersten Platz, obwohl es einen großen Unterschied beim Speed Score gab. Die Differenz zwischen dem am besten und dem am schlechtesten bewerteten Anbieter war auch hier im Bereich Festnetz-Breitband sehr gering.

Anbieterleistung vs. NPS

Die Anwender von Speedtest werden auch gefragt, wie wahrscheinlich sie ihren Anbieter ihren Freunden oder ihrer Familie weiterempfehlen würden (Skala von 0 bis 10). NPS-Bewertungen werden in Kritiker (Punktzahl 0-6), Passive (Punktzahl 7-8) und Befürworter (Punktzahl 9-10) eingeteilt. Der NPS wird berechnet aus (% Unterstützer – % Kritiker) x 100. Jeder NPS-Wert über 0 zeigt an, dass die Kunden eines Anbieters eher loyal sind. Wir haben den erzielten Net Promoter Score (NPS) mit dem Speed Score verglichen, um zu sehen, wie die Leistung mit der Wahrscheinlichkeit, dass ein Anwender, einen Anbieter weiterempfiehlt, zusammenhängt.

A1 erzielte den höchsten NPS im Bereich Mobilfunk in Österreich, kabelplus erhielt den besten Wert im Bereich Festnetz-Breitband

Internetleistung der Top-Mobilfunkanbieter in Österreich
Speedtest Intelligence® | Modern Chipsets in Q3 2020
Anbieter Speed Score NPS
A1 61,55 1,58
3 43,55 -39,67
Magenta Telekom 41,00 -20,18

A1 erzielte den höchsten NPS bei den Mobilfunkbetreibern in Österreich in Q3 2020, während Magenta Telekom und 3 negative NPS-Ergebnisse aufwiesen. Daraus lässt sich schließen, dass Anwender diese Betreiber nicht weiterempfehlen würden.

Internetleistung der Top-Festnetz-Breitband-Anbieter in Österreich
Speedtest Intelligence® | Q3 2020
Anbieter Speed Score NPS
Magenta 81,21 -28,97
3 26,39 -36,00
A1 24,84 -51,63

Magenta hatte unter den Festnetz-Breitband-Anbietern den höchsten NPS in Österreich in Q3 2020, gefolgt von 3 und A1. Keiner der Anbieter erzielte positive NPS-Werte.

Die Telekom erzielte den höchsten NPS im Bereich Mobilfunk und Festnetz-Breitband in Deutschland

Internetleistung der Top-Mobilfunkanbieter in Deutschland
Speedtest Intelligence® | Modern Chipsets in Q3 2020
Anbieter Speed Score NPS
Tekelom 49,09 14,82
Vodafone 29,69 -37,74
1&1 23,18 -58,65
O2 22,65 -34,59

Die Telekom erzielte nicht nur den höchsten NPS im Bereich Mobilfunk in Deutschland in Q3 2020, das Unternehmen war auch der einzige Mobilfunkbetreiber mit einem positiven NPS, was bedeutet, dass die Verbraucher den Betreiber wahrscheinlich weiterempfehlen würden. Wie wir bereits gesehen haben, war die Telekom auch der schnellste Anbieter und der am besten bewertete.

Internetleistung der Top-Festnetz-Breitband-Anbieter in Deutschland
Speedtest Intelligence® | Q3 2020
Anbieter Speed Score NPS
Vodafone 103,57 -50,26
Telekom 44,28 -27,10
O2 38,38 -40,76

Die Telekom verzeichnete den höchsten NPS unter den Anbietern von Festnetz-Breitband in Deutschland in Q3 2020. Alle Festnetz-Breitband-Anbieter erzielten jedoch negative NPS-Werte.

Swisscom holte den höchsten NPS im Mobilfunkbereich in der Schweiz ein, Salt im Festnetz-Breitband

Internetleistung der Top-Mobilfunkanbieter in der Schweiz
Speedtest Intelligence® | Modern Chipsets in Q3 2020
Anbieter Speed Score NPS
Swisscom 57,10 -2,74
Sunrise 46,13 -24,66
Salt 38,79 -46,75

Neben dem höchsten Speed Score in der Schweiz und den besten Bewertungen von Kunden erzielte Swisscom auch den höchsten NPS im Mobilfunkbereich in der Schweiz in Q3 2020. Dennoch wiesen alle schweizer Mobilfunkbetreiber negative NPS-Werte auf, was darauf hindeutet, dass die Verbraucher diese Betreiber wahrscheinlich nicht an Freunde oder Verwandte weiterempfehlen würden.

Internetleistung der Top-Festnetz-Breitband-Anbieter in der Schweiz
Speedtest Intelligence® | Q3 2020
Anbieter Speed Score NPS
Salt 290,89 -1,24
UPC 150,45 -23,70
Quickline 95,18 -18,29
net+ 82,98 -8,33
Sunrise 79,40 -10,93
Swisscom 76,73 -10,34

Salt, dessen Speed Score fast doppelt so hoch war wie der, des nächsten Mitbewerbers, hatte unter den Festnetz-Breitband-Anbietern in der Schweiz in Q3 2020 den höchsten NPS. Unter den anderen Anbietern entsprach die Geschwindigkeitsrangliste ansonsten nicht den NPS-Anbieterrankings in der Schweiz, wobei der zweitschnellste, UPC, den niedrigsten NPS aufweist.

Zwar entsprechen die schnellsten Geschwindigkeiten nicht immer den besten Kundenbewertungen, aber es besteht ein klarer Zusammenhang zwischen der Leistung, Qualität und Verfügbarkeit der Netze und der Kundenzufriedenheit. Da immer mehr Mobilfunkbetreiber in der DACH-Region zunehmend 5G bereitstellen – und das Hochgeschwindigkeits-Glasfaser-Internet in der Region immer besser verfügbar wird – ist es interessant zu beobachten, wie die Geschwindigkeiten weiter steigen. Wir werden weiterhin sowohl Netzwerkmetriken als auch die Verbraucherstimmung in der Region beobachten und diese Erkenntnisse aufbereiten, damit die Anbieter erkennen können, wie und wo Verbesserungsbedarf für ihre Netzwerke besteht.
Ookla retains ownership of this article including all of the intellectual property rights, data, content graphs and analysis. This article may not be quoted, reproduced, distributed or published for any commercial purpose without prior consent. Members of the press and others using the findings in this article for non-commercial purposes are welcome to publicly share and link to report information with attribution to Ookla.