| December 10, 2018

The World’s Internet in 2018: Faster, Modernizing and Always On

When it comes to the internet, the news is mostly good for 2018. Download and upload speeds are increasing across the globe on both mobile and fixed broadband. 5G is on the horizon and gigabit service is expanding.

We looked at data from Speedtest IntelligenceTM, Ookla’s flagship data platform, from December 2017 through November 2018, to analyze everything from global internet speeds to the world’s fastest countries to when people are online. We also investigated which parts of the world are seeing the most benefit from high speed LTE on mobile and gigabit speeds on fixed broadband.

Mobile speeds increased more than 15% in 2018

Graphic-Tables-Final-v2_mobile-average-speed-3

The world’s average mobile download speed of 22.82 Mbps increased 15.2% over the past year, while mobile upload speed increased 11.6% to reach 9.19 Mbps.

Graphic-Tables-Final-v2_android-vs-ios-1

With a mean download speed of 27.84 Mbps and a mean upload of 10.61 Mbps, worldwide speeds on iOS devices were faster than those on Android (21.35 Mbps download, 8.73 Mbps upload) in 2018. This is likely due to market factors as Android devices are more popular in emerging markets where internet speeds tend to be slower.

However, download speed on Android devices increased 19.0% and upload speed increased 15.1%, more than those on iOS (18.0% increase for download and 11.1% increase for upload), which is good news for those emerging markets.

Fixed broadband speeds increased more than 26% in 2018

Graphic-Tables-Final-v2_fixed-average

On a global level, fixed broadband speeds were nearly twice as fast as those on mobile in 2018. The world’s average download speed on fixed broadband was 46.12 Mbps, 26.4% faster than last year. Upload speed increased 26.5% to 22.44 Mbps.

All said, though, both mobile and fixed broadband speeds increased at a slower rate in 2018 than they did in 2017.

Countries with the fastest internet in 2018

Graphic-Tables-Final-v2_top-5-mobile

The countries with the fastest mean download speeds over mobile in the past 12 months were: Norway (63.19 Mbps), Iceland (58.68 Mbps), Qatar (55.17 Mbps), Singapore (54.71 Mbps) and the Netherlands (53.42 Mbps).

Graphic-Tables-Final-v2_top-5-fixed

Singapore showed the world’s fastest mean download speeds over fixed broadband during the past twelve months at 175.13 Mbps. Next fastest were Iceland (153.03 Mbps), Hong Kong (138.31 Mbps), South Korea (114.67 Mbps) and Romania (109.90 Mbps).

To keep up with month-to-month internet speeds at a global level, visit the Speedtest Global Index.

Most improved countries for 2018 internet speeds

Graphic-Tables-Final-v2_most-improved-mobile

Costa Rica saw the largest increase in mobile download speed over the past year at 194.6%. Myanmar was second with 121.8%, Saudi Arabia third (113.2%), Iraq fourth (92.3%) and the Ukraine fifth (82.1%).

The countries with the largest improvements in upload speeds were Bangladesh (179.2%), the Ukraine (172.5%), Costa Rica (163.4%), Myanmar (146.9%) and Iraq (126.7%).

Graphic-Tables-Final-v2_most-improved-fixed

Paraguay saw the biggest increase in mean download speed over fixed broadband in the world over the past year at 268.6%. Guyana was second with 113.5%, Libya third (108.0%), Malaysia fourth (89.5%) and Laos fifth (76.2%).

Libya showed the most improvement in mean upload speed over fixed broadband during the past twelve months at 176.4%. Guyana was second with 116.1%, Malaysia third (95.2%), Belize fourth (88.9%) and Iraq fifth (76.8%).

4G is increasing mobile speeds

2017-2018-LTE-growth

When we looked specifically at Speedtest results on 4G, we saw that mean download speeds increased in most countries. Costa Rica was most improved for 4G download speed as was the case with overall download speed on mobile increasing 184.3% year over year. Saudi Arabia was second at 110.2% and Myanmar third at 78.0%.

Most encouragingly, we saw the number of Speedtest results over 4G increase in all but 15 countries. This could indicate that 4G availability is expanding. Tanzania saw the greatest increase with 355.0% more tests over 4G in 2018 than in 2017. Malta was second at 267.2% and Algeria third at 143.7%. We can see this expansion on the map above as 4G results fill in areas of the globe that were previously blank.

Gigabit coverage is expanding globally

gigabit-fade-1

Gigabit is in the news as ISPs across the globe expand their high-speed networks. We looked at Speedtest results on fixed broadband in excess of 750 Mbps to see which cities are benefitting most. Comparing locations with 100 or more gigabit-speed results in 2017 with those in 2018, that expansion becomes obvious. In 2017, 60 countries met our gigabit test threshold. In 2018, 16 additional countries joined our gigabit list. We’re also seeing that more cities around the world now have access to gigabit speeds.

Also exciting is that cities which already had gigabit in 2017 saw increases in the number of gigabit-speed results in 2018 as ISPs continue to build out infrastructure across cities. Many cities saw their first real gigabit expansion in 2018. For example, we saw the number of gigabit tests in New Delhi increase from 119 gigabit speed results in 2017 to 20,239 in 2018, that’s a mind-boggling 16,908% increase. Chennai, India saw a 7,481% increase (from 763 to 57,840) and Cormeilles-en-Parisis, France jumped 6,480%. Huge leaps in the number of gigabit-speed results were also seen in Gdańsk, Poland (6,338%); Rome, Italy (4,909%); Lancashire, United Kingdom (3,962%); Ota, Japan (3,240%); São Paulo, Brazil (2,947%); Hangzhou, China (2,669%) and Turda, Romania (2,636%).

When people are online

point-3-sec-final-1

The internet is always on, but we were surprised to see how consistently and steeply usage fell off on both mobile and fixed broadband after 9 pm local time. Normalizing the time of day for Speedtest results from around the globe, we found that usage bottoms out at 4 am and then climbs steeply again until 10 am. From there, the internet gets gradually busier until that night time drop off.

Internet in the world’s largest countries

The world’s five most populous countries are notably absent from the lists of fastest and most improved countries on mobile and fixed broadband. China, India, the U.S., Indonesia and Brazil represent about 46% of the world’s population, which makes their internet speeds worth noting nonetheless.

Internet Speeds in the World’s Largest Countries
Speedtest Data | December 2017-November 2018
Country Mean Mobile Download Speed (Mbps) % Improvement in Mobile Speed Mean Fixed Download Speed (Mbps) % Improvement in Fixed Speed
China 30.96 -5.8% 76.03 42.5%
India 9.11 15.2% 23.00 50.4%
United States 28.50 22.3% 92.77 37.3%
Indonesia 10.39 5.3% 14.89 18.3%
Brazil 18.65 29.3% 22.95 39.4%

Mobile internet speeds in the world’s largest countries

China had the fastest average mobile download speed among the world’s most populous countries in the past twelve months. However, China’s mobile download speed decreased during that time. The United States is fast catching up with China on mobile download speed.

Brazil occupied a middle ground for mobile download speed among the world’s most populous countries and showed the fastest rate of increase. India and Indonesia were at the bottom of this list. While the two nations show similar mobile download speeds to each other, India’s mobile download speed is improving much more quickly than Indonesia’s.

Fixed broadband speeds in the largest countries in the world

The United States showed the fastest fixed broadband download speed among the world’s most populous countries over the past year. China was second, India and Brazil nearly tie for third and Indonesia follows.

India showed the largest improvement in mean download speed over fixed broadband of the world’s five largest countries. China was second, Brazil third, the U.S. fourth and Indonesia fifth.

We’ll be back throughout 2019 to report on the state of the world’s internet as it evolves. Until then, take a Speedtest to find out how your network compares.

Ookla retains ownership of this article including all of the intellectual property rights, data, content graphs and analysis. This article may not be quoted, reproduced, distributed or published for any commercial purpose without prior consent. Members of the press and others using the findings in this article for non-commercial purposes are welcome to publicly share and link to report information with attribution to Ookla.

| September 4, 2019

In-Depth Analysis of Changes in World Internet Performance Using the Speedtest Global Index

A lot has changed in the two years since 2017 when we first began ranking mobile and fixed broadband speeds of countries around the world with the Speedtest Global IndexTM. 5G is being deployed around the world and fiber continues to make gigabit speeds a reality in more and more countries. We’ve been tracking it all and are here to report on how much speeds have increased, which countries are leading internet performance and which are falling behind, and what trends we see across continents.

World mobile speed increased 21.4% with fixed broadband up 37.4%

World-Download-Speeds-2019-OG2

Looking just at the last year, the world’s mean download speed over mobile increased 21.4% from 22.81 Mbps in July 2018 to 27.69 Mbps in July 2019. Mean upload speed over mobile increased 18.1% from 9.13 Mbps to 10.78 Mbps. The world average for download speed over fixed broadband increased 37.4% from 46.48 Mbps in July 2018 to 63.85 Mbps in July 2019. Mean upload speed over fixed broadband increased 48.9% from 22.52 Mbps to 33.53 Mbps.

Shake-ups in the country rankings for internet performance

Fastest-Countries-Mobile-2018-2019

Mobile speeds in the fastest countries have skyrocketed in the past year which has dramatically shifted the rankings. South Korea, which was not even in the top ten a year ago, saw a 165.9% increase in mean download speed over mobile during the past 12 months, in large part due to 5G. Switzerland’s mean download speed increased 23.5%. Canada’s was up 22.2%, Australia 21.2%, the Netherlands 17.3%, UAE 11.1%, Malta 10.3% and Norway 5.8%. Qatar remained in the top ten, although the country’s mean download speed over mobile actually dropped 1.4% from July 2018 to July 2019.

Individual mobile operators can make a huge difference in a country’s speeds. In 2017 we were excited to see Telenor uncap their mobile speeds, which drove Norway to the top of the Speedtest Global Index. A big part of South Korea’s mobile success in the past year is the way KT, LG U+ and SK Telecom banded together to release 5G at the same time. Switzerland has also benefited from 5G and Sunrise leads the country with 262 5G deployments across the country while Swisscomm has 52.

Fastest-Countries-Fixed-2018-2019

Fixed broadband rankings on the Speedtest Global Index have not changed as dramatically during the past 12 months as those on mobile. Singapore remains the fastest country with an increase in mean download speed over fixed broadband of 5.6%. Taiwan had the largest jump in speeds among the top 10 with a 166.5% improvement in fixed download speed between July 2018 and July 2019. Mean download speed over fixed broadband increased 52.4% in South Korea, 26.4% in Macau, 21.7% in Romania, 21.0% in Switzerland, 19.3% in the United States and 3.5% in Hong Kong.

Monaco and Andorra did not have enough tests to qualify for the Speedtest Global Index one year ago, but massive fixed broadband improvements in both countries inspired us to lower our test count threshold for inclusion and also share these smaller countries’ success stories.

Technologies paving the way: 5G and gigabit

The presence of 5G is not enough to change a market

As discussed above, 5G has the potential to rocket a country to the top of the mobile rankings on the Speedtest Global Index. In practice, we’ve seen 5G speeds that were over 1000% faster than those on LTE.

Mobile-Download-Speeds-by-Country

In reality, though, unless 5G is commercially available widely across a country and from all mobile operators (as was the case in South Korea), the change in speeds at the country level is not that significant. Though commercial 5G was launched widely across Switzerland by Sunrise and Swisscom in April 2019, the country’s mean download speed only increased 2.8% in the three months since. The average mobile download speed in the U.S. has actually declined slightly since 5G was initially deployed. This is because 5G is still only available in a very limited number of markets to consumers with 5G-capable devices.

Visit the Ookla 5G Map for the latest on 5G deployments across the globe.

Gigabit is a game-changer, if you can get it

Unlike 5G, fiber connections have been rolling out since 2007, opening up the possibility of gigabit-speed fixed broadband. That said, it’s costly and time-intensive to lay miles and miles of fiber so progress has varied widely across the globe.

Gigabit-Test---Performance_Singapore-1

Geographically small countries like Singapore have the advantage when it comes to fiber, because It’s easier and cheaper to lay fiber optic cable across the country’s small footprint. Singaporean internet service providers (ISPs) have used this advantage to go beyond mere gigabit and offer connections as fast as 10 Gbps. This is reflected both in Singapore’s dominance of the fixed rankings on the Speedtest Global Index and in the fact that 2.87% of their total Speedtest results over fixed broadband are gigabit-speed (800 Mbps or higher).

Gigabit-Test---Performance_Brazil-1

Brazil offers a good contrast for how difficult it can be for gigabit to reach the masses. While the first Brazilian ISP to offer fiber-to-the-premises (FTTP) initially did so in 2007, easy access to gigabit speeds was slow to follow. However, that may be starting to change. Between June and July 2019 we saw a large uptick in gigabit-speed results in Brazil, where the proportion of gigabit speed tests increased from 0.02% of total fixed broadband tests to 0.17%. This corresponded with a large increase in mean download speed at the country level.

Comparing world mobile and fixed broadband at a glance

We were curious to see just how different internet performance experiences were around the world, so we plotted average mobile download speed against average download speed on fixed broadband. All of the graphs below use a percentage difference from the global average, a number that changed between 2018 and 2019.

fade-Performance-vs-Global---Quadrant-All

Speed Leaders

There was not much change in the list of countries that showed above-average download speeds on both mobile and fixed broadband between July 2018 and July 2019, the “Speed Leaders.” What did change was that fixed broadband speeds increased significantly enough among the group to bring the whole pack closer to Singapore and Hong Kong. On the mobile axis, South Korea’s major increase in download speed made that country more of an outlier, pushing the boundaries of what great performance can look like.

Fixed-Focused countries

Between July 2018 and July 2019 we saw the number of countries considered to be “Fixed-Focused” (having faster download speeds over fixed broadband than the world average while their average mobile download speeds were slower than average) increase. Ireland was the only country that solidly fit this category in 2018. Thailand and Chile started near the midline for fixed speeds and below-average for mobile speeds in 2018. 2019 found both countries squarely in the Fixed-Focused category. Israel also edged into this category as their mobile download speed fell between July 2018 and 2019.

Mobile-Focused countries

The “Mobile-Focused” category saw the most movement between July 2018 and July 2019 as some countries (the UAE and Qatar) increased their fixed speeds sufficiently to join the Speed Leaders. Meanwhile, Bosnia and Herzegovina’s mobile download speed increased year-over-year to move them into the Mobile-Focused quadrant. Georgia’s mobile download speed decreased enough to move them from Mobile-Focused to Speed Laggers.

It will be interesting to see how many of these Mobile-Focused countries double down on their mobile investments and explore 5G alternatives to fixed broadband.

Speed Laggers

No country wants to be in the position of having slower than average mobile and fixed broadband speeds. We saw 57 countries in this “Speed Laggers” quadrant in July 2018 and 78 in July 2019. This increase is mostly due to our expansion of the number of countries we consider for the Speedtest Global Index based on test count. There were enough countries in this category that we’ve considered them separately by continent below.

Regional views of mobile and fixed broadband performance

Mobile-and-Fixed-Broadband-Improvement-by-Continent-02

We aggregated Speedtest results by continent to analyze mobile and fixed broadband performance by continent.

Mobile-and-Fixed-Performance-by-Continent-01

Asia had the highest percentage increase in mobile download speed followed by North America, Oceania, South America, Africa and Europe. Oceania had the fastest mean download speed in July 2019. North America placed second, Europe third, Asia fourth, South America fifth and Africa sixth.

On the fixed broadband side, South America saw the highest percentage increase in download speed. Asia came in second, Europe third, Africa fourth, North America fifth and Oceania sixth. North America had the fastest mean download speed in July 2019. Europe was second, Asia third, and Oceania fourth. As we saw with mobile, South America and Africa again ranked fifth and sixth, respectively.

A zoomed-in view of the speed quadrants separated by continent offers a more detailed view of each country’s role in these rankings.

Africa mostly lags in internet speeds

2019-Performance-vs-Global---Africa

In July 2019, all but two African countries in the Speedtest Global Index fell into the Speed Laggers category, having mobile and fixed broadband speeds that were below global averages. The exceptions were South Africa and Guinea, which both had fast enough mobile speeds to place them in the mobile-focused quadrant.

Asian markets show a wide breadth of internet performance

2019-Performance-vs-Global---Asia

Asia was the most diverse continent we examined in terms of internet performance. We saw a plurality of countries in each of the four quadrants in July 2019. Most of the Speed Leaders were in East Asia: China, Hong Kong (SAR), Japan, Macau (SAR), South Korea, and Taiwan. If we include Singapore, another Speed Leader, these are among the wealthiest nations in Asia (using GDP per capita). Two of Asia’s Fixed-Focused countries are in Southeast Asia (Malaysia and Thailand) and one is in the Middle East (Israel).

The Speed Laggers category contained countries from South Asia (including Afghanistan, India and Pakistan), Southeast Asia (Brunei, Cambodia, the Philippines and Vietnam) and the Middle East (Jordan). Mobile-Focused countries in Asia were mostly Middle Eastern, including Kuwait, Lebanon, Oman, Saudi Arabia and Turkey.

European mobile performance is mostly strong, fixed varies

2019-Performance-vs-Global---Europe

With the exception of Ireland, the European countries on the Speedtest Global Index fell into the Speed Leaders, Mobile-Focused, and Speed Laggers categories. All of the Speed Laggers (Belarus, Kazakhstan, Russia and the Ukraine) were from Eastern Europe. Countries from Southeast Europe (including Albania, Bosnia and Herzegovina, Croatia, Greece, Montenegro, Moldova, Serbia and Slovenia) and Central Europe (Austria and the Czech Republic) made up the bulk of the Mobile-Focused category.

Speed Leaders included countries from the Baltics (Estonia, Latvia and Lithuania), the Nordics (Denmark, Norway and Sweden), Central Europe (Poland and Romania), and Western Europe (including Belgium, France, Germany, the Netherlands, and Spain).

North American internet performance is sharply divided

2019-Performance-vs-Global---North-America

Canada and the U.S. are the only two North American countries in the Speed Leaders category. Panama is the only North American country under Fixed-Focused. Mexico and all of the Central American countries fall into the Speed Laggers category. There are no North American countries that are Mobile-Focused.

Each country in Oceania has a very different internet story

2019-Performance-vs-Global---Ocean

Oceania is represented in three of the four quadrants: Speed Leaders (New Zealand), Mobile-Focused (Australia) and Speed Laggers (Papua New Guinea) with Fiji straddling the divide between Speed Laggers and Mobile-Focused.

South America mostly lags in mobile and fixed internet speeds

2019-Performance-vs-Global---South-America

Most of the South American countries represented on the Speedtest Global Index are in the Speed Laggers quadrant (Argentina, Bolivia, Brazil, Colombia, Ecuador, Paraguay, Peru, Suriname and Venezuela). Chile is an exception, being part of the Fixed-Focused group, as is Uruguay which sits in Mobile-Focused.

Global internet speeds are improving on average and 5G and gigabit are compounding those advances where available. However, not all countries are benefitting equally. We’ll be interested to see how 5G continues to push mobile speeds in the next year and also whether 5G Wi-Fi becomes a game changer for fixed broadband. Remember to check the Speedtest Global Index on a monthly basis for updated country rankings. And take a Speedtest to make sure your experience is represented in your country’s averages.

Editor’s Note: This article was edited on September 10, 2019 to correct an error in the labeling on the first image. The colors in a later image were updated for consistency.

Ookla retains ownership of this article including all of the intellectual property rights, data, content graphs and analysis. This article may not be quoted, reproduced, distributed or published for any commercial purpose without prior consent. Members of the press and others using the findings in this article for non-commercial purposes are welcome to publicly share and link to report information with attribution to Ookla.

| March 13, 2020

Tracking COVID-19’s Impact on Global Internet Performance (Updated July 20)

We are no longer updating this article as internet speeds in most countries have stabilized to pre-pandemic levels. For ongoing information about internet speeds in specific countries, visit the Speedtest Global IndexTM or contact our press team.

Ookla® closely monitored the impact of COVID-19 on the performance and quality of global mobile and broadband internet networks in the early days of the pandemic. We shared regular information based on Ookla data to assist in the understanding of this unprecedented situation. You can still download the July 20, 2020 CSV here which contains all the public data we tracked in this article. If you are looking for information on internet or online service outages, please check Downdetector®.

Ookla retains ownership of this article including all of the intellectual property rights, data, content graphs and analysis. This article may not be quoted, reproduced, distributed or published for any commercial purpose without prior consent. Members of the press and others using the findings in this article for non-commercial purposes are welcome to publicly share and link to report information with attribution to Ookla.

| January 12, 2021

2020 Recap: How the Internet Held Up During a Global Pandemic


There was major concern last year that the internet might fail under the pressure of increased use as COVID-19 drove unparalleled waves of remote work and schooling. We watched internet performance carefully using data from Speedtest Intelligence® as conditions changed in different areas of the world. Now we’re back to assess what happened during the year as a whole.

A note on the methodology: 5G launches drove up mean internet speeds on mobile in many countries. For this reason we’ve simplified our view to include only median speeds, which are less subject to being skewed by especially fast 5G tests.

Mobile speeds dipped in many G20 countries in the spring of 2020

Mobile-Broadband-Speeds-in-G20-Countries_0121

Median download speeds over mobile in many G20 countries dropped at some point during 2020. Countries that saw month-to-month declines during the spring include: Australia, Canada, France, India, Italy, Saudi Arabia, South Korea, Spain and Turkey. China saw a decline in mobile speed in February while Japan suffered a drop in June and July. Argentina, Brazil, Indonesia, Russia and the United Kingdom showed only very minor decreases, while speeds in Germany, Mexico, South Africa and the United States remained unchanged or increased.

Despite the drops, almost all G20 countries saw higher median download speeds over mobile in December 2020 than they had in January 2020. Median download speed over mobile increased 76.3% in China during that time. Germany saw a 62.8% increase, the United States 56.9%, South Korea 55.5% and Saudi Arabia 48%. Turkey saw a 0.7% decrease in median download speed over mobile during the same period.

Despite interim dips, fixed broadband improved in all G20 countries during 2020

Fixed-Broadband-Speeds-in-G20-Countries_0121

There were notable dips in median download speeds over fixed broadband in many countries during the spring of 2020. G20 countries that saw these declines on a monthly basis include: Argentina, Canada, France, India, Indonesia, Italy, Japan, South Korea, Spain, Turkey and the United States. Brazil, China, Germany and Russia notably showed only increases in month-to-month median download speed over fixed broadband during this time. Other countries showed only very minor decreases.

Perhaps most important, all G20 countries saw higher median download speeds over fixed broadband in December 2020 than they had in January 2020. Median download speed over fixed broadband increased 51.9% in Brazil during that time. France saw a 48.3% increase, Japan 46.5%, Saudi Arabia 43.7% and South Africa 40%. South Korea saw the smallest increase in median download speed over fixed broadband over the same period at 8.1%.

We are impressed, on the whole, with how well the internet held up to the massive scale of increased use during the past year. Of course, month-by-month, country-level views are averages that might not reveal problems with specific mobile operators or internet service providers on individual days. If you want to assess how your internet connection is performing right now, take a Speedtest®. And if you are unable to connect to a specific service on the internet, check Downdetector® to see the status of that service.

Ookla retains ownership of this article including all of the intellectual property rights, data, content graphs and analysis. This article may not be quoted, reproduced, distributed or published for any commercial purpose without prior consent. Members of the press and others using the findings in this article for non-commercial purposes are welcome to publicly share and link to report information with attribution to Ookla.

| August 23, 2023

Propelling Digital Transformation with Focused Measures: Key Takeaways from the APAC Regulatory Summit

Ookla® hosted its inaugural Telecommunications Regulatory Summit for policymakers across Asia Pacific on July 16, 2023, in Kuala Lumpur, Malaysia. The Summit event brought together over 40 regulatory participants from ten countries in the region, to examine how crowdsourced data can support more effective policy-making. The Summit also reflected on the regional telecommunication landscape, its challenges, opportunities, ways to bridge the digital divide, and ensuring consumers have a good quality of experience (QoE).

Key takeaways

  • Data-driven regulation to drive connectivity. The summit emphasized that crowdsourced data plays a crucial role in measuring progress, identifying connectivity gaps, and making informed decisions to bridge the digital divide, ensuring that high-quality broadband is accessible to everyone, including rural and remote areas. 
  • Diverse technology solutions for connectivity. While 5G technology can replace fixed broadband access in certain scenarios, satellite and 5G FWA technology are effective solutions for remote areas. Adopting these technologies, combined with digital literacy initiatives, can help address challenges related to device accessibility, affordability, and usage gaps. 
  • Regulation and collaboration as catalysts for digital transformation. Effective regulatory policies, collaboration with various stakeholders, and implementing programs like Malaysia’s Jendela initiative are instrumental in promoting digital infrastructure, improving customer experience, and ensuring widespread access to telecommunications services. When internet providers, governments, and regulators work together (like in the Malaysia example), internet service and coverage will continue to improve and expand, including in rural areas.

Data-driven regulation to increase connectivity

Many governments in Asia Pacific see improvements to broadband connectivity as a means to drive digital transformation of their economies. However, this requires that high-quality broadband be accessible nationwide.

Speedtest Intelligence data shows that fixed network performance varies across the region, while mobile networks are catching up in performance and are often the primary means of connection. 5G performance has already exceeded fixed network performance in Malaysia and Indonesia –  Speedtest Intelligence data shows that Malaysia recorded a median 5G download speed of 511.79 Mbps versus 93.19 Mbps for fixed, while in the Philippines, our results showed median download speeds of 133.47 Mbps on 5G versus 93.19 Mbps over fixed broadband.

Chart of median fixed and mobile download speed across a sample of Countries in Asia Pacific

Although connectivity continues to improve, connecting rural and remote areas remains a challenge. To tackle this issue, some countries have established programs like Malaysia’s Universal Service Provision and Indonesia’s Universal Service Obligation fund. These programs aim to provide basic telephony and internet services to individuals and communities. Operators contribute to the fund, which is then used to deploy networks in rural areas that may not be financially viable otherwise. Mr. Sam Majid, CTIO of the Malaysian Communications and Multimedia Commission (MCMC), emphasized the importance of making informed decisions, driving tangible improvements, and revolutionizing the approach to strengthen internet connectivity in the country. He added, “Crowdsourced data has become critical for us to understand where the demand for connectivity is, where we need to improve, and where we need to deploy. These insights help us manage regulatory policy to address the digital divide, support consumer protections, and increase competition within the market.” 

A mix of technologies is required to advance connectivity 

5G technology can potentially replace fixed internet access in situations where the cost of fiber deployments is high and rolling out traditional fixed broadband networks isn’t commercially viable. However, in countries like Indonesia, satellite technology may be a more effective solution for providing connectivity to remote areas. While 5G Fixed Wireless Access (FWA) and satellite technology can complement each other, the adoption of satellite technology is currently limited by factors such as coverage, device affordability, and cost of service (Starlink modems cost around $800) in comparison to existing fixed or mobile broadband options. On the other hand, based on our data from the U.S.A., we can see that in the best-case scenario, 5G-based FWA can compete with fiber in terms of median download speeds. 

Chart of median download speed in the U.S.A. by technology type

Malaysia has taken a proactive approach to address the growing demand for better quality fixed and mobile broadband coverage. The government’s 12th Malaysia Plan (2021-2025) includes the Jalinan Digital Negara (Jendela) initiative, which utilizes various technology solutions for different sub-areas. To achieve its objectives, Jendela uses Ookla’s crowdsourced data to monitor mobile broadband speeds and identify coverage gaps. In contrast to other countries, Malaysia has adopted a nationwide single wholesale network (SWN) approach for its 5G rollout. The Digital Nasional Berhad (DNB) was established in 2021 to construct and operate the 5G network infrastructure and provide 5G services to mobile network operators at wholesale prices. With 5G DNB coverage reaching 64.75% as of June 2023, Jendela is making significant progress in expanding internet access and achieving its goals of digital transformation.

Regulators play a role in advancing digital transformation

In a panel discussion about the impact of regulation on digital transformation, MTC Laos’ Ms. Phavanhna Douangboupha and Indonesia’s DG SDPPI, Mr. Adis Alifiawan, shared their strategies for increasing broadband connectivity and narrowing the digital divide. Ms. Douangboupha revealed that Laos is collaborating with the private sector and government agencies towards Digital Transformation and Digital Economy development. As part of this it recently launched the National Digital Transformation Committee, chaired by the Prime Minister, in order to reduce redundancy to improve efficiency. Laos also launched the 20-year Vision for Digital Economy Development (2021-2040), 10-year Strategy (2021-2030), and 5-year National Digital Development Plan for 2021-2025. The Ministry of Technology and Communications of Laos is also raising awareness for digital transformation by visiting each province and educating on its benefits.

Meanwhile, Indonesia has taken a targeted approach to accelerate the development of digital infrastructure and provide internet access in villages and public service locations as part of the “Connected Indonesia: the more digital, the more advanced” initiative. 

The government has developed all three layers of digital infrastructure, including its Fiber Optic Backbone Network “Palapa Ring,” high throughput satellite (SATRIA-1) for middle-mile connectivity, and last mile connectivity through 4G base stations and WiFi internet access deployed solely by the government in rural areas. Sharing telecom infrastructure is another supportive regulatory framework, which can reduce business costs, ensure faster rollouts and enhance a country’s connectivity, according to Ms. Syeda Shafaq Karim, a representative from the Pakistan’s Telecom Regulator. She also added that enabling Telecom Infrastructure Sharing brings multiple benefits for all stakeholders, from telecom consumers, operators, and regulatory perspective. Additionally, Mr. Tith, during his presentation, discussed how the Telecommunication Regulator of Cambodia intervened to address issues related to QoS and network coverage by setting a floor price for mobile data packages, ensuring they are not sold below the cost base. 

While much progress has been made, in our recent article, we shared how several markets in the Asia Pacific region experienced faster median download performance compared to that in the top five European economies. For example, Malaysia, South Korea, Singapore, India, New Zealand, China, and Australia achieved a median 5G download speed exceeding 200 Mbps. In comparison, only France recorded speeds above 200 Mbps among the European countries mentioned, while Italy, Germany, United Kingdom, and Spain, recorded median download speeds below 150 Mbps. However, there is another important factor to consider when discussing expanding broadband adoption, and that is the usage gap, those people that live within the footprint of mobile broadband networks and not using them. According to GSMA, almost half of the population in Asia Pacific is connected to the mobile internet. The mobile internet usage gap –  in the region has narrowed significantly from 60% in 2017 to 47% in 2022, reflecting the increasing affordability of devices and improving digital skills.

Mr. Kevin Henry, representing the GSMA, during Fireside Chat: Democratizing Broadband  Through 5G Fixed Wireless Access Implementation, discussed the current challenges to expanding internet adoption across the region, such as device accessibility, affordability, coverage, and usage gaps. These challenges can be addressed through digital literacy, relevant content, and education. He also added that governments and mobile operators have a crucial role to play in driving internet adoption via subsidies or tax, as well as educating the citizens on the benefits of being connected.

Overall, the event emphasized the importance of digital transformation, partnerships, and regulation in shaping the future of the telecom ecosystem. The focus of the APAC Regulatory Summit was on improving customer experience, digital advancement, and closing the digital gap, all of which depend on reliable mobile networks. While progress is clearly being made, we will keep a close eye on 5G and network development across Asia going forward. In the meantime, if you want to learn more, subscribe to Ookla research to be the first to read our analyses.

Ookla retains ownership of this article including all of the intellectual property rights, data, content graphs and analysis. This article may not be quoted, reproduced, distributed or published for any commercial purpose without prior consent. Members of the press and others using the findings in this article for non-commercial purposes are welcome to publicly share and link to report information with attribution to Ookla.

| June 6, 2022

Analyzing Time of Day Internet Usage During Ramadan

Arabic | Français | Bahasa Indonesia | Bahasa Malaysia

Muslims across the world recently observed the month of Ramadan. During this sacred time, observing Muslims abstain from eating and drinking sunrise to sunset, acts of charity are encouraged, and work hours are often shortened. People often gather with friends and family during the evening meal, iftar, and new entertainment programming is often released for people to enjoy together. We were curious how this observance affected internet usage, so we analyzed Speedtest Intelligence® data from a variety of Muslim-majority countries around the world. We looked specifically at test volume during local fast times and iftar (when the fast is broken) and how those numbers compared to test volume during the month prior. 

Only some countries showed fewer tests during fast times

We analyzed Speedtest Intelligence data from Algeria, Bangladesh, Egypt, Indonesia, Malaysia, Morocco, Pakistan, Saudi Arabia, Somalia, Sudan, Tunisia, and Turkey during Ramadan to see how the distribution of Speedtest results between fast and iftar times varied by country. It should be noted that while all of the countries we surveyed have a majority Muslim population, the percentage of the population that is Muslim (and therefore likely to observe Ramadan) varies from Somalia (99.8%) to Malaysia (61.3%). 

Internet usage patterns changed during Ramadan 

Speedtest Intelligence showed that testing behavior changed during Ramadan when compared with the month prior. There was a decrease in the percentage of tests completed in the daytime between Ramadan and the month prior in all of the countries we surveyed. Somalia, Algeria, Saudi Arabia, and Tunisia showed the highest change in trends of daytime Speedtest results when comparing the fasting part of the day during Ramadan to daytime during the month prior. Malaysia, Bangladesh, Turkey, Indonesia, and Pakistan showed the smallest difference between the two periods. 

There was also an increase in the percentage of Speedtest results from iftar when comparing Ramadan to the month prior. Somalia and Algeria saw the largest increase when compared with the month prior. Malaysia, Bangladesh, Turkey, and Pakistan saw the smallest increases. This corresponds with the idea that people shift their online activity to iftar during Ramadan, connecting with friends and family, donating to charity, and enjoying the variety of new shows that networks release to coincide with the holiday.

This is a good reminder that every country has special events that their network operators need to prepare in advance for as we saw recently with Expo 2020 Dubai. If you’re interested in coverage of major network events from around the world, subscribe to Ookla® InsightsTM.


Analyse de l’utilisation d’internet en journée durant le Ramadan

Les Musulmans du monde entier ont récemment observé le mois du Ramadan. Pendant ce temps sacré, les Musulmans pratiquants ne mangent pas et ne boivent pas de l’aube au coucher du soleil, les actes de charité sont encouragés et les heures de travail sont souvent réduites. Les gens se retrouvent fréquemment entre amis et en famille pour le repas du soir, l’iftar, et de nouveaux programmes de divertissement sont souvent diffusés pour que les gens puissent en profiter ensemble. Nous étions curieux de savoir comment cette observance affectait l’utilisation d’Internet. Nous avons donc analysé les données de Speedtest Intelligence® provenant de divers pays à majorité musulmane dans le monde. Nous avons particulièrement examiné le volume des tests pendant les heures de jeûne locales et l’iftar (lorsque le jeûne est rompu), puis nous avons comparé ces chiffres au volume des tests du mois précédent.

Seuls quelques pays témoignent d’une réduction de tests pendant les périodes de jeûne

Nous avons analysé les données de Speedtest Intelligence provenant d’Algérie, du Bangladesh, d’Égypte, d’Indonésie, de Malaisie, du Maroc, du Pakistan, d’Arabie Saoudite, de Somalie, du Soudan, de Tunisie et de Turquie pendant le Ramadan pour voir comment la répartition des résultats de Speedtest entre les heures de jeûne et l’iftar variait selon les pays. Il convient de noter que si tous les pays étudiés ont une population majoritairement Musulmane, le pourcentage de la population Musulmane (et donc susceptible d’observer le ramadan) varie de la Somalie (99,8 %) à la Malaisie (61,3 %).

La Turquie, le Bangladesh, la Malaisie, l’Indonésie et le Pakistan ont montré un pourcentage plus élevé de résultats Speedtest pendant le jeûne que pendant l’iftar tout au long du Ramadan 2022. Les pourcentages de tests pendant le jeûne et l’iftar étaient presque équivalents au Maroc, en Égypte, en Algérie, en Tunisie et en Somalie. L’Arabie Saoudite et le Soudan avaient plus de résultats Speedtest pendant l’iftar que pendant le jeûne.

Les habitudes d’utilisation d’internet ont changé pendant le Ramadan

Speedtest Intelligence a montré que le comportement de test a changé pendant le Ramadan par rapport au mois précédent. Il y a eu une diminution du pourcentage de tests effectués dans la journée entre le Ramadan et le mois précédent dans tous les pays que nous avons étudiés. La Somalie, l’Algérie, l’Arabie Saoudite et la Tunisie ont enregistré la plus forte baisse du pourcentage de résultats de Speedtest effectués dans la journée lors de la comparaison entre la journée de jeûne au cours du Ramadan à la journée du mois précédent. La Malaisie, le Bangladesh, la Turquie, l’Indonésie et le Pakistan ont montré la plus petite différence entre les deux périodes.

Une augmentation du pourcentage de résultats Speedtest a été observée lors de l’iftar en comparant le Ramadan au mois précédent. La Somalie et l’Algérie ont connu la plus forte augmentation par rapport au mois précédent. La Malaisie, le Bangladesh, la Turquie et le Pakistan ont connu les plus faibles augmentations. Ces résultats correspondent à l’idée que les gens reportent leur activité en ligne à l’iftar pendant le Ramadan, pour passer du temps avec leurs amis et leur famille, faire des dons à des œuvres de charité et profiter de la variété des nouveaux programmes que les réseaux diffusent pour coïncider avec la période des fêtes.

Cette étude est un bon rappel que chaque pays a des événements spéciaux auxquels ses opérateurs de réseau doivent se préparer à l’avance, comme nous l’avons vu récemment avec l’Expo 2020 Dubaï. Si vous êtes intéressé par la couverture des grands événements réseau du monde entier, abonnez-vous à Ookla® Insights™.


Analisis Waktu Penggunaan Internet Selama Ramadan

Umat Islam di seluruh dunia baru-baru ini merayakan bulan Ramadan. Selama bulan suci ini, umat Islam menjalani ibadah puasa sejak matahari terbit hingga terbenam, banyak beramal, dan sering kali mengurangi jam kerja. Orang-orang berkumpul dengan teman dan keluarga saat makam malam, berbuka puasa, dan program hiburan baru seringkali dirilis untuk dinikmati bersama. Kami penasaran bagaimana kepatuhan ini memengaruhi penggunaan internet, jadi kami pun menganalisis data Speedtest Intelligence® dari berbagai negara mayoritas Muslim di seluruh dunia. Kami secara khusus mencermati volume tes pada waktu puasa dan berbuka (saat puasa dihentikan) setempat dan bagaimana perbandingan angka-angka tersebut dengan volume tes di bulan sebelumnya.

Hanya beberapa negara yang menunjukkan tes yang lebih sedikit di waktu puasa

Kami menganalisis data Speedtest Intelligence dari Aljazair, Bangladesh, Mesir, Indonesia, Malaysia, Maroko, Pakistan, Arab Saudi, Somalia, Sudan, Tunisia, dan Turki selama Ramadan untuk mencari tahu bagaimana distribusi hasil Speedtest antara waktu puasa dan waktu berbuka puasa bervariasi antarnegara. Perlu dicatat bahwa meskipun semua negara yang kami survei berpenduduk mayoritas Muslim, persentase penduduk yang beragama Islam (dan, karena itu, mungkin merayakan Ramadan) itu bervariasi, dari Somalia (99,8%) hingga Malaysia (61,3%).

Data dari Turki, Bangladesh, Malaysia, Indonesia, dan Pakistan menunjukkan persentase hasil Speedtest yang lebih tinggi selama waktu puasa dibandingkan waktu berbuka selama Ramadan 2022. Adapun menurut data dari Maroko, Mesir, Aljazair, Tunisia dan Somalia, persentase tes waktu puasa dan berbukanya kurang lebih sama. Sementara Arab Saudi dan Sudan hasil Speedtest-nya selama waktu berbuka lebih banyak daripada waktu puasa.

Pola penggunaan internet berubah selama Ramadan

Speedtest Intelligence menunjukkan bahwa perilaku pengujian berubah selama Ramadan jika dibandingkan dengan bulan sebelumnya. Terjadi penurunan persentase tes yang dilaksanakan pada siang hari antara bulan Ramadan dan bulan sebelumnya di semua negara yang kami survei. Somalia, Aljazair, Arab Saudi, dan Tunisia menunjukkan penurunan persentase hasil Speedtest terbesar di siang hari bulan Ramadan dibandingkan siang hari di bulan sebelumnya. Data dari Malaysia, Bangladesh, Turki, Indonesia, dan Pakistan menunjukkan selisih terkecil di antara kedua periode tersebut.

Juga terjadi peningkatan persentase hasil Speedtest mulai waktu berbuka puasa di bulan Ramadan dengan bulan sebelumnya. Somalia dan Aljazair mengalami peningkatan terbesar jika dibandingkan dengan bulan sebelumnya. Malaysia, Bangladesh, Turki, dan Pakistan mengalami peningkatan terkecil. Ini selaras dengan asumsi bahwa orang-orang mengalihkan aktivitas online mereka ke waktu berbuka selama Ramadan, berbaur dengan teman dan keluarga, bederma, dan menikmati berbagai acara baru yang dirilis oleh jaringan bertepatan dengan hari raya.​​

Ini adalah pengingat yang bagus bahwa setiap negara memiliki acara-acara khusus yang perlu dipersiapkan terlebih dulu oleh para operator jaringan seperti yang kita lihat baru-baru ini pada Expo 2020 Dubai. Jika Anda tertarik dengan liputan acara-acara jaringan utama dari seluruh dunia, silakan berlangganan Ookla® Insights™.


Menganalisis Masa Penggunaan Internet Semasa Bulan Ramadan

Orang islam di seluruh dunia baru-baru ini telah menyambut bulan Ramadan. Semasa bulan suci ini, mereka menahan diri dari makan dan minum bermula dari waktu matahari terbit hingga matahari terbenam, aktiviti kebajikan digalakkan, dan waktu bekerja kebiasaannya dipendekkan. Orang ramai biasanya akan berkumpul bersama-sama rakan dan keluarga semasa waktu berbuka puasa, iftar, dan rancangan hiburan baru sering disiarkan untuk ditonton dan dinikmati bersama-sama.

Kami ingin tahu bagaimana sambutan bulan Ramadan ini memberi kesan terhadap penggunaan internet, jadi kami telah menganalisis data Speedtest Intelligence® dari pelbagai negara dengan majoriti Muslim di seluruh dunia. Kami melihat secara khusus jumlah ujian semasa waktu berpuasa dan iftar (waktu berbuka puasa) tempatan dan membandingkan nilai tersebut dengan jumlah ujian semasa bulan sebelumnya.

Hanya beberapa negara yang menunjukkan bilangan ujian lebih rendah semasa waktu berpuasa

Kami telah menganalisis data Speedtest Intelligence dari Algeria, Bangladesh, Mesir, Indonesia, Malaysia, Maghribi, Pakistan, Arab Saudi, Somalia, Sudan, Tunisia, dan Turki semasa bulan Ramadan untuk melihat pengagihan keputusan Speedtest di antara waktu berpuasa dan iftar yang berbeza mengikut negara. Perlu dinyatakan bahawa, walaupun semua negara yang diselidik mempunyai penduduk majoriti Muslim, peratusan penduduk yang beragama Islam (dan oleh itu lebih berkemungkinan menyambut Ramadan) berbeza-beza dari Somalia (99.8%) ke Malaysia (61.3%).

Turki, Bangladesh, Malaysia, Indonesia, dan Pakistan menunjukkan peratusan keputusan Speedtest yang lebih tinggi semasa waktu berpuasa berbanding waktu berbuka semasa bulan Ramadan 2022. Peratusan ujian waktu berpuasa dan iftar adalah agak sama dengan Morocco, Mesir, Algeria, Tunisia dan Somalia. Saudi Arabia dan Sudan mempunyai keputusan Speedtest yang lebih tinggi semasa waktu berbuka berbanding waktu berpuasa.

Corak penggunaan Internet berubah semasa bulan Ramadan

Speedtest Intelligence menunjukkan bahawa tingkah laku ujian berubah semasa bulan Ramadan apabila dibandingkan dengan bulan sebelumnya. Terdapat penurunan dalam peratusan ujian yang dilengkapkan semasa waktu siang antara bulan Ramadan dan bulan sebelumnya dalam semua negara yang dikaji selidik. Somalia, Algeria, Saudi Arabia, dan Tunisia menunjukkan penurunan terbesar dalam peratusan keputusan waktu siang Speedtest apabila dibandingkan dengan waktu berpuasa semasa bulan Ramadan dengan waktu siang bulan sebelumnya. Malaysia, Bangladesh, Turki, Indonesia, dan Pakistan menunjukkan perbezaan terkecil di antara dua tempoh ini.

Terdapat juga peningkatan dalam peratusan keputusan Speedtest dari waktu iftar apabila membandingkan bulan Ramadan kepada bulan sebelumnya. Somalia dan Algeria mempunyai peningkatan terbesar apabila dibandingkan dengan bulan sebelumnya. Malaysia, Bangladesh, Turki, dan Pakistan mempunyai peningkatan terkecil. Ini selari dengan pendapat bahawa ramai yang menukar aktiviti dalam talian mereka kepada iftar semasa bulan Ramadan, berhubung dengan rakan dan keluarga, menderma kepada badan kebajikan, dan menikmati pelbagai rancangan baru yang disiarkan oleh rangkaian yang bersesuaian dengan sambutan ini.

Ini adalah satu peringatan yang baik bahawa setiap negara mempunyai peristiwa istimewa yang pengendali rangkaian perlu sediakan lebih awal seperti yang kita lihat baru-baru ini di Expo 2020 Dubai. Jika anda berminat dengan liputan acara rangkaian besar dari seluruh dunia, langganlah  Ookla® Insights™.

Ookla retains ownership of this article including all of the intellectual property rights, data, content graphs and analysis. This article may not be quoted, reproduced, distributed or published for any commercial purpose without prior consent. Members of the press and others using the findings in this article for non-commercial purposes are welcome to publicly share and link to report information with attribution to Ookla.

| June 30, 2022

The Philippines is a Duopoly No More: Assessing DITO’s Impact on 4G and 5G Performance

The Philippines is a country with the highest number of social media users globally. Filipinos also spend a lot of time online —according to the Digital 2022 report, internet users aged 16 to 64 spent an average of 10 hours and 27 minutes using the internet each day. Yet, the Philippines suffer in terms of having relatively low mobile internet speeds due to challenging geography and affordability. Recently, the Filipino mobile market witnessed the arrival of a third mobile player, DITO whose ambitions are to disrupt a duopoly of Globe and Smart, owned by PLDT (Philippine Long Distance Telephone Company). In this article we will review the current state of the Filipino mobile market, one year after it became a three-player market.

Key takeaways

  • The third operator, DITO, entered the market in March 2021 and is working to expand its market share. The operator has met all of its coverage and performance obligations, and it plans further investment and expansion of its 4G and 5G networks.
  • Overall 4G performance improved in the country thanks to a mix of more operator investments and regulatory reforms. Smart led on median 4G download speed in Q1 2022 at 18.57 Mbps. DITO, a 4G/5G player, had the best 4G Availability in Q1 2022 at 91.2%.
  • 5G Availability improved partially thanks to easing of the Right of Way (RoW) rules but also operators’ investment into 5G networks. Smart won both in terms of 5G speeds and 5G Availability in Q1 2022, it recorded 200.43 Mbps median download speed and 25.5% 5G Availability, ahead of Globe with 121.29 Mbps download speed and 15.3% 5G Availability. DITO has just started rolling out a 5G network.
  • Consumer attitudes shifted in a positive direction in the past year, both in terms of NPS score and rating of mobile operators.

Reintroducing a third player into the Filipino market

In 2011, PLDT acquired Digitel, which meant that the Philippines turned into a two-operator mobile market. This didn’t fare well for the Filipino consumers. A 2014 study by the think tank LIRNEasia found that internet users in the Philippines have paid more for worse connectivity compared to other Asian countries with investment into the telecom sector held back. A third player was introduced to the market to add competition, to improve network performance, and to reduce prices in the market. In November 2018, the Department of Information and Communications Technology (DICT) and the National Telecommunications Commission (NTC) declared Mislatel (now DITO Telecommunity Corporation), a new major telco player. DITO’s launched commercial operations in March 2021 in Visayas and Mindanao.

DITO market share after a year of commercial availability

Entering an already saturated telecom market wasn’t an easy task. According to GSMA Intelligence, Filipino market penetration stood at 137.5% with an average of 2.1 SIMs per user in Q1 2021. In addition, the new operator’s license came with coverage and performance obligations, which are tracked by technical audits performed on behalf of the NTC. Repetitive failure to deliver on its commitments would result in the loss of its franchise and the forfeiture of a multi-billion-Peso bond. DITO committed to a five-year network rollout plan as follows:

  • First Year: commitment to reach more than 37.01% country population with a minimum average broadband speed of 27 Mbps — DITO achieved 37.48% population coverage as per February 2021 Audit
  • Second Year: DITO exceeded its 51.01% population coverage target (achieved 52.57% population coverage) as per September 2021 Audit.
  • Third Year: 70% population coverage audited in July 2022, DITO’s current coverage is around 64%-65%.
  • Fifth Year: 84% population coverage obligation, which the operator itself has increased to over 90% by the end of its five-year network rollout program and average mobile internet speed of 55 Mbps speed.

As a result, the newcomer’s strategy wasn’t to start a price war with the incumbent operators. Rather, the goal is to win consumers’ mindshare by delivering faster speeds, differentiated customer experience and simpler products. The operator tapped into its parent company’s distribution network — retail stores of Udenna Group and gasoline stations of Phoenix Petroleum to distribute its services. It also leveraged China Telecom’s know-how and funding.

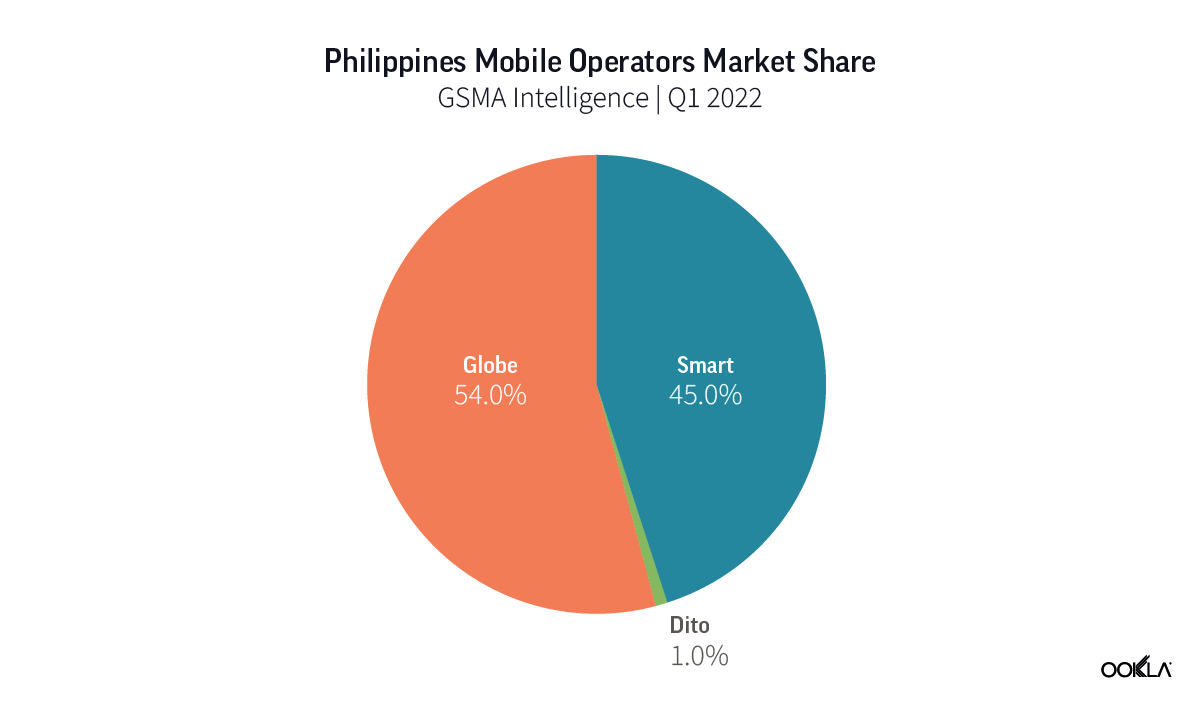
One year on, in Q1 2022, Globe was the market leader by subscriber numbers, with 87.4 million, Smart followed with 70.3 million. The newcomer, DITO, held a 1% market share — on March 15, 2022 it announced it had 7 million subscribers, which is lower than we would expect from a new market entrant. DITO targets 12 million subscribers by year end, which seems within its reach, as it has recently announced reaching 9 million customers as of June 2022. Its gains are aided by its promotional packages such as unlimited data for 30 days promotion with 25 GB of data, unlimited text and 300 minutes of calls. One of DITO’s challenges is that it doesn’t operate 2G and 3G networks so its customers have to have 4G-capable phones.

Chart of mobile operator market share in the Philippines

Furthermore, the introduction of Mobile Number Portability (MNP) in September 2021 could shift the landscape. MNP allows subscribers to keep their existing mobile number when changing mobile providers, helping to remove the hassle of losing an existing number when switching operators. This hasn’t been as successful as expected — with only 5,000 requests being made in a space of three months (September to December 2021). In time, and with more customer education, we foresee MNP to have more of an impact on the market.

Philippines catching up on 4G

Chart of 4G performance in Philippines in comparison to other south eastern Asian countries

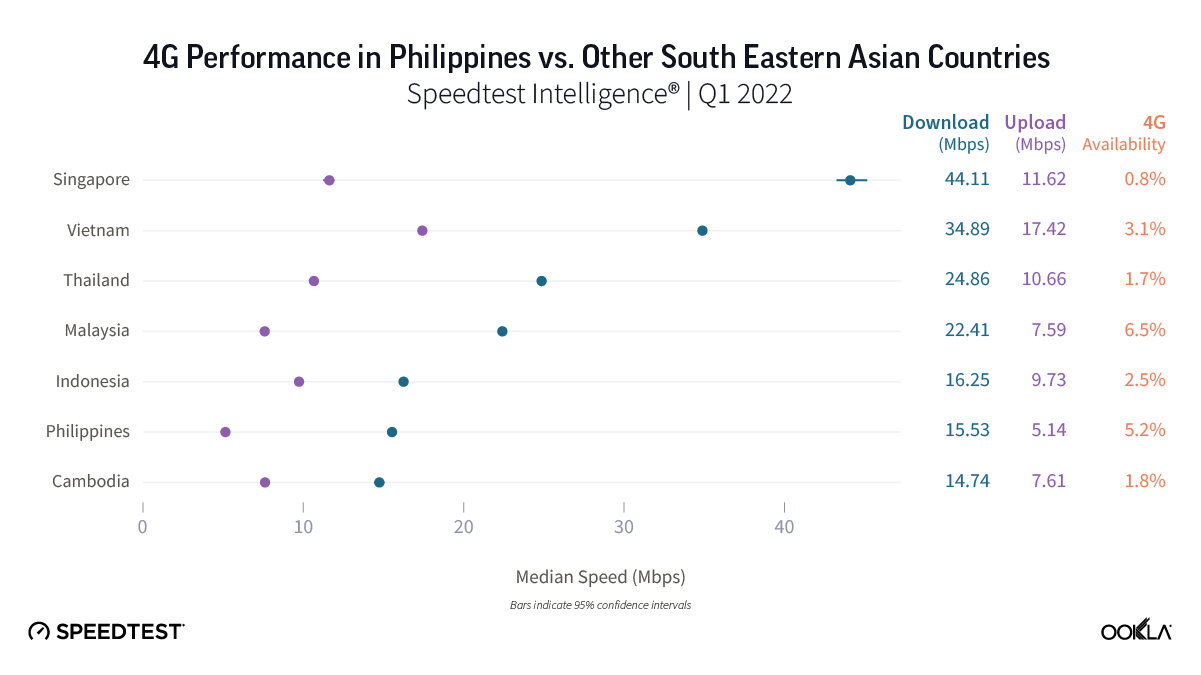
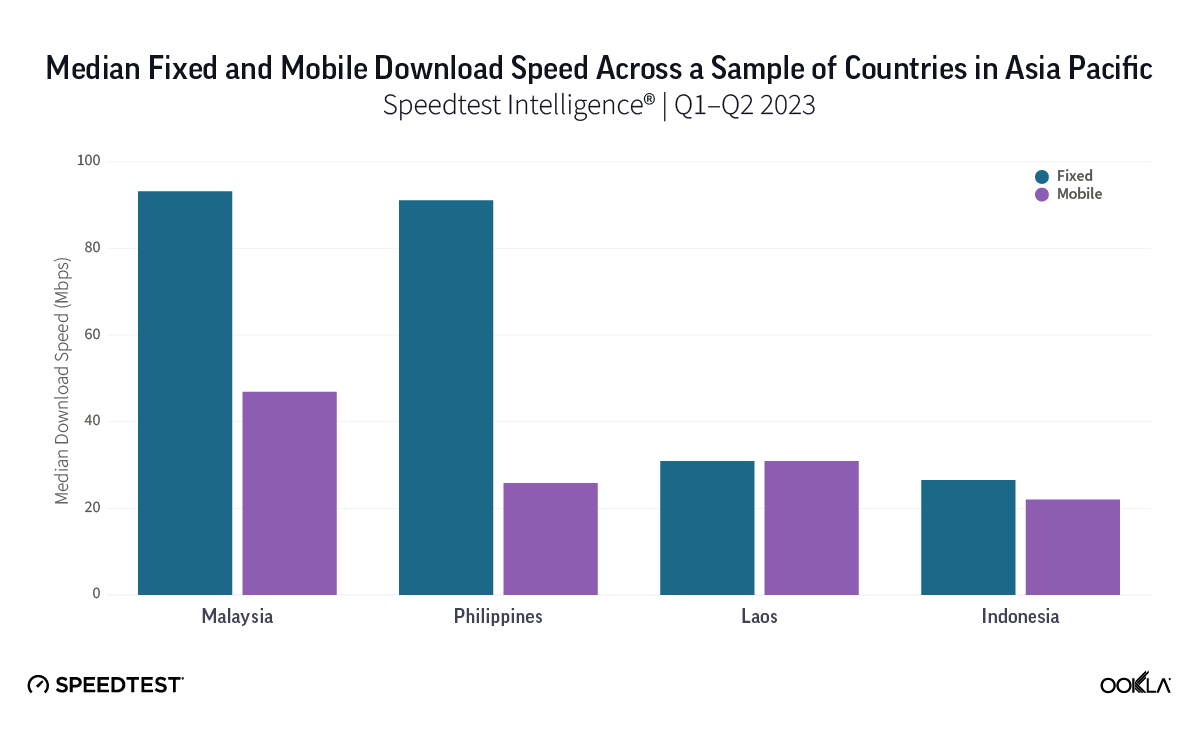
Using Speedtest Intelligence® data, we compared 4G performance in the Philippines against that of its regional peers in Q1 2022. Singapore came first with a 44.11 Mbps median 4G download speed ahead of Vietnam (34.89 Mbps), followed by Thailand (24.86 Mbps) and Malaysia (22.41 Mbps). Across Indonesia, the Philippines, and Cambodia, the 4G median speeds were well under 20 Mbps, with the Philippines coming with a 15.53 Mbps median download speed and a 5.14 Mbps median upload speed.

Smart leads on median 4G download speed; DITO on 4G Availability

Chart of LTE performance comparison in Q1 2022 versus Q1 2021 among operators in the Philippines

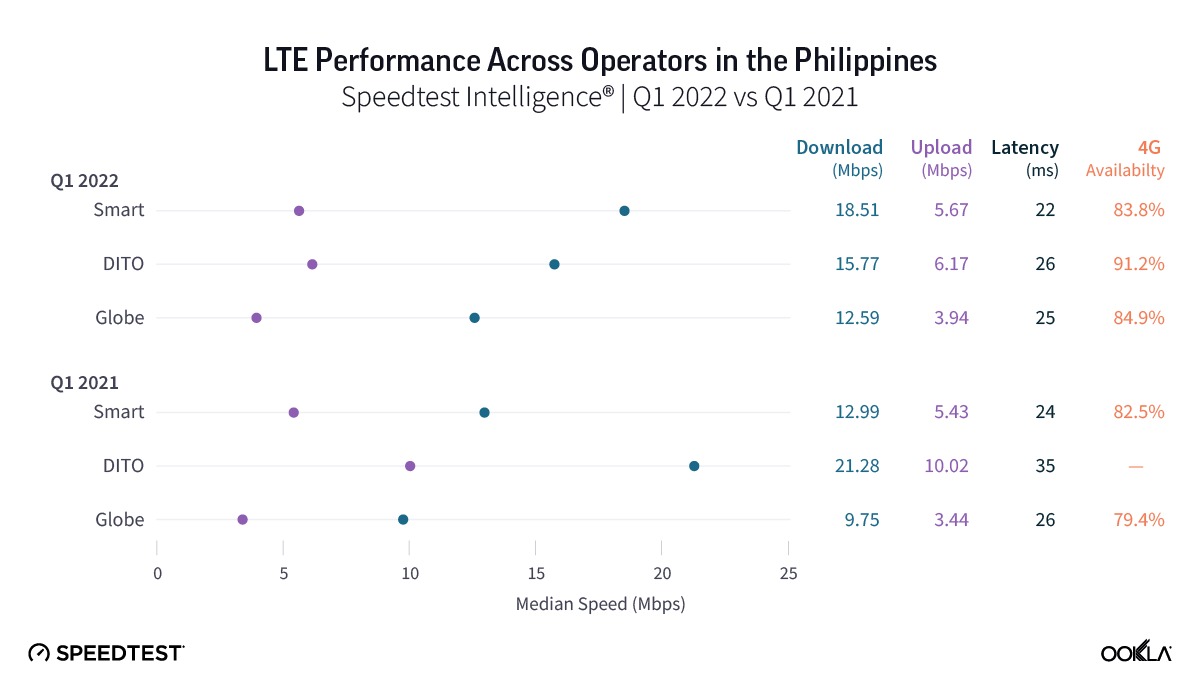
Using Speedtest Intelligence® data, we analyzed LTE Performance in the Philippines comparing Q1 2021 (when DITO commercially launched), and Q1 2022 (almost one year of DITO being in operation). The overall LTE performance has improved — increasing from 11.15 Mbps in Q1 2021 to 15.53 Mbps in Q1 2022. Smart came first in terms of median LTE download speed in Q1 2022, at 18.51 Mbps followed by DITO (15.77 Mbps) and Globe (12.59 Mbps). However, Dito’s median 4G speeds have decreased over a space of a year, which is quite common as a network gets more congested. Latency, on the other hand, has improved across all operators, especially DITO which recorded latency of 26 ms in Q1 2022 versus 35 ms in Q1 2021.

Analysis based on data from Speedtest Intelligence shows that 4G Availability — the proportion of users on all devices who spend the majority of their time connected to 4G technology — has also improved to 84.8% in Q1 2022 from 80.6% in Q1 2021. One important distinction to bear in mind is that while 4G/5G Availability measures the time users spend on a 4G or 5G technology, coverage is a measurement of space and geo-spatial availability. Therefore, operator’s network coverage is just one part of the story. Compatible handsets, SIMs, and tariffs are important factors that influence it.

Since DITO is a 4G-only operator, it is not surprising that it also had the best 4G Availability in Q1 2022 (91.2%), ahead of Globe (84.9%) and Smart (83.8%) that provide access to all network technologies 2G, 3G, 4G, and 5G. Additionally, DITO, despite facing challenges raising funding, plans to invest PHP 50 billion ($915 million) during 2022 in the network roll out in order to adhere to its license obligations, which we outlined here, that specify its population coverage and network speeds.

Other operators also continue to commit capital expenditures for network investment. For instance, Globe Telecom earmarked PHP 89 billion ($1.6 billion) for CAPEX this year, and in Q1 2022 already spent PHP 21 billion ($384 million) — 10% higher than a year before, of which 82% was dedicated to data network builds “to help boost mobile and internet experiences for a greater number of Filipinos.” The operator has set a goal of building more than 1,700 new cell sites across the country in 2022 to extend its geographic reach and to expand beyond the 1,407 sites it deployed in FY21. In the first three months of this year it built out 234 cell sites nationwide, upgraded 2,344 mobile sites to 4G, and installed 380 5G sites.

Our analysis suggests that DITO’s entry combined with regulatory changes, resulted in more network investment and an overall improvement in 4G coverage and performance across all operators. As such, Smart reported that on December 31, 2021, Smart had a total of 38,600 4G/LTE base stations, which has further increased to 39,500 in Q1 2022. This corresponds to population coverage across Smart’s 3G, 4G and 5G networks of 97% in Q1 2022. The majority of devices (81%) are “latched” onto the operator’s 4G network.

Caloocan led on 4G speeds and 4G Availability

Map of LTE performance in Philippines cities

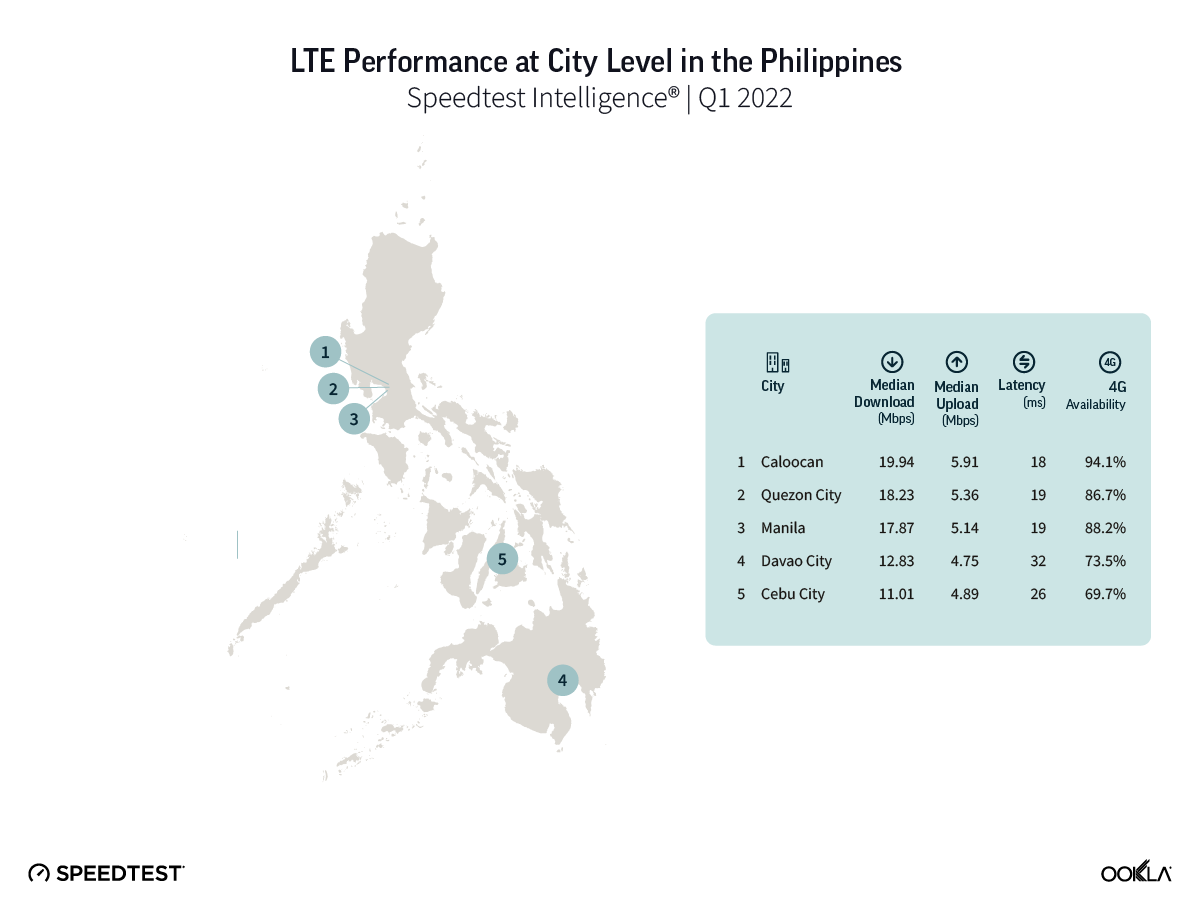
In the Philippines, up to one third of its population resides within Metro Manila, which comprises 16 cities, including the three most populous cities: Quezon (2.9 million), Manila (1.8 million), and Caloocan (1.6 million). Manila, the capital city, is one of the most densely populated cities in the world. Caloocan, Quezon, and Manila came closely together in terms of 4G performance. Smart came first in those three cities: Caloocan (28.66 Mbps), Quezon City (28.24 Mbps), and Manila (30.88 Mbps). DITO was fastest in Cebu, it recorded a 16.60 Mbps median download speed in Q1 2022 but its median upload speed was on par with Smart. While in Davao City, the biggest city outside of Metro Manila, DITO and Smart went head to head with 7.17 Mbps and 6.86 Mbps median download speed, respectively.

Based on Speedest Intelligence data, Caloocan performed best in terms of 4G Availability but 4G Availability improved across all five cities. Quezon and Manila showed the best year-on-year improvement, increasing its 4G Availability from 81.8% in Q1 2021 to 86.7% in Q1 2022 (Quezon) and 83.5% to 88.2% (Manila). Despite being a challenger, DITO managed to come first in terms of 4G Availability in a number of locations: Caloocan (98.3%), Cebu (80.0%), and Davao City (88.9%). Globe won 4G Availability in Quezon (88.3%) while there was not a sufficient statistically significant difference in Manila to declare a winner.

The Philippines fared well in 5G performance and 5G Availability

Chart of 5G performance in souther eastern Asian countries

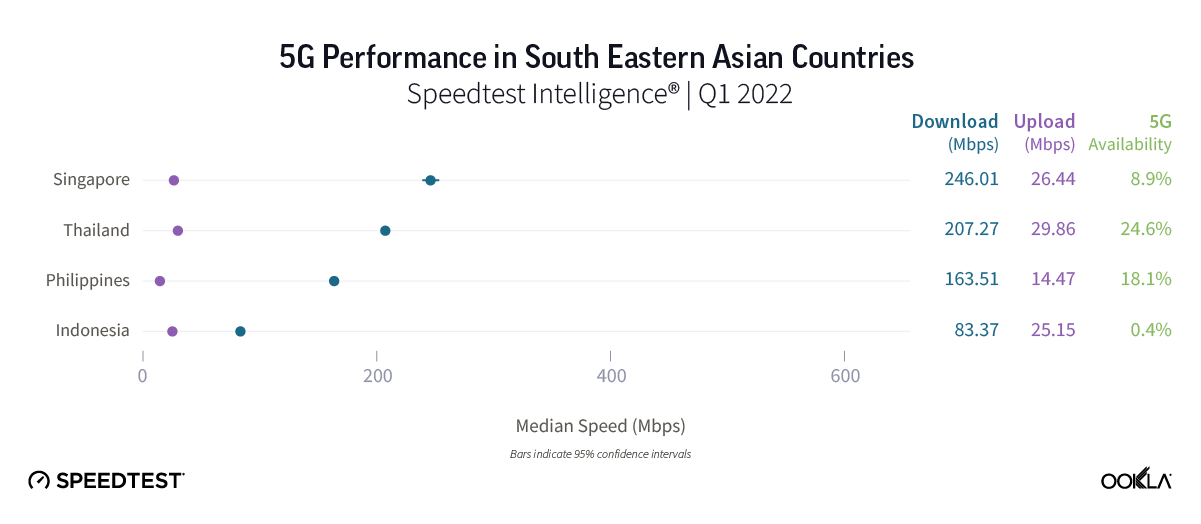
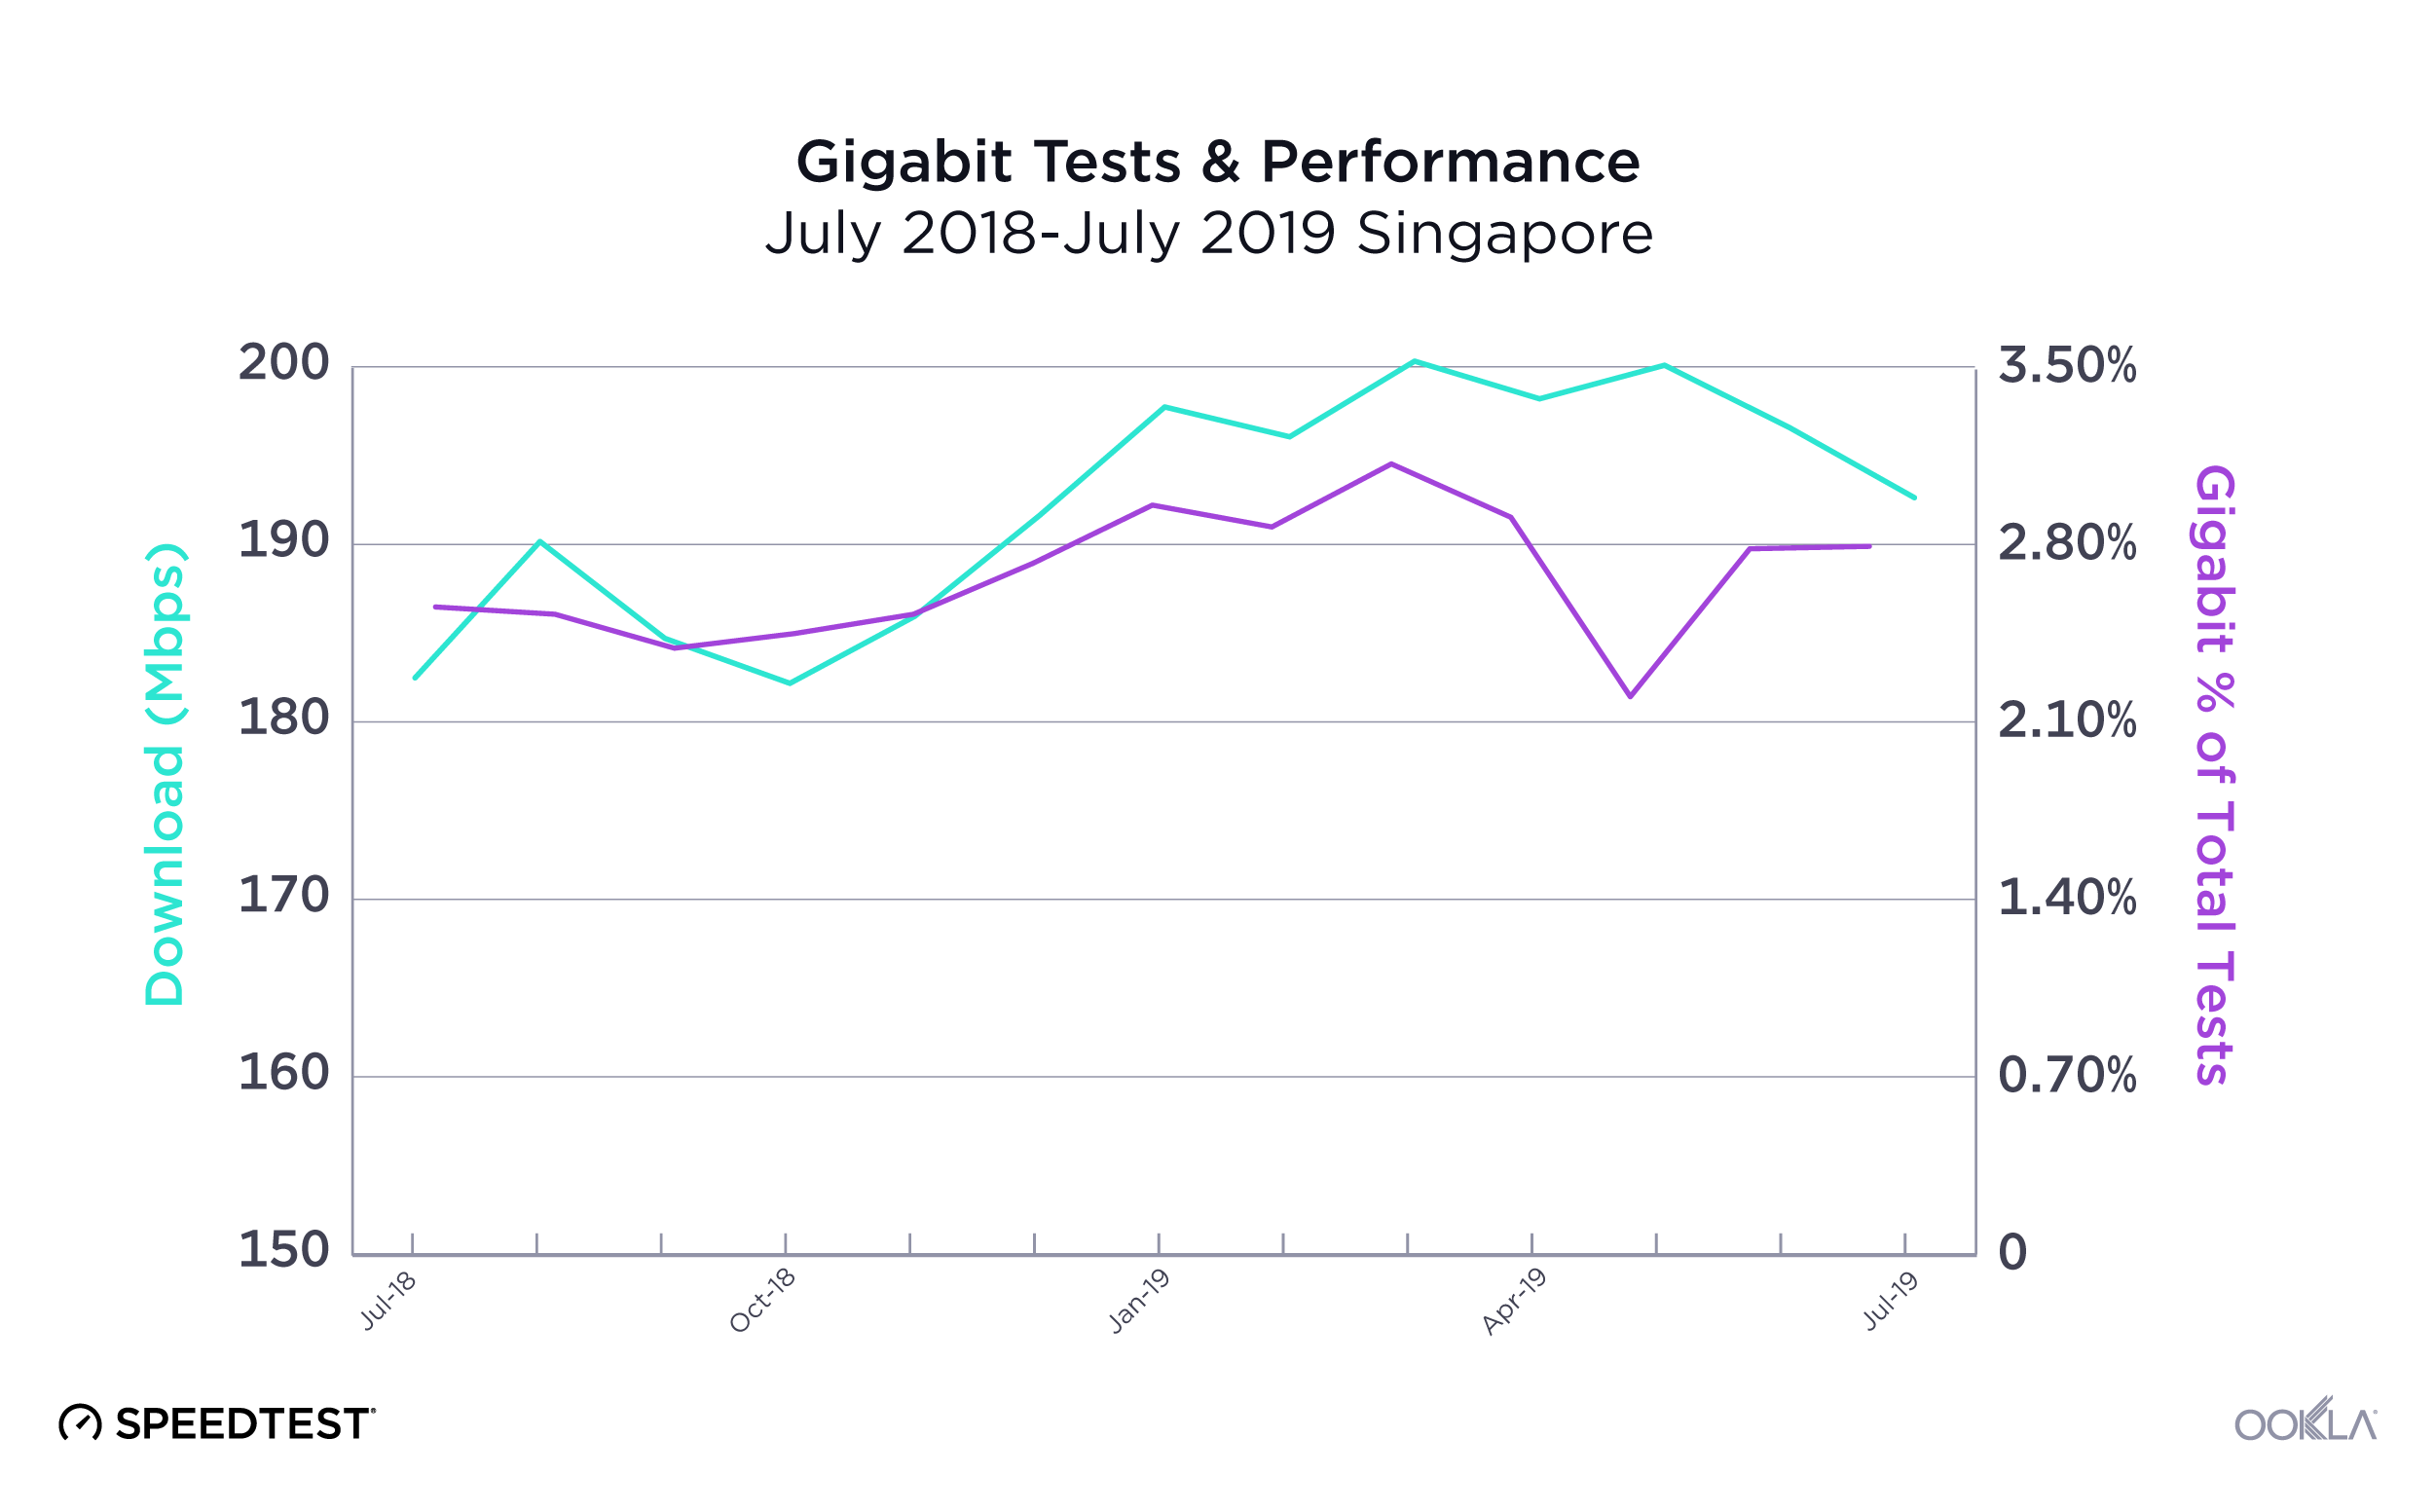
According to Speedtest Intelligence data, Singapore led Southeast Asian on median 5G upload speeds in Q1 2022, Thailand and the Philippines followed with 207.27 Mbps and 163.51 Mbps median download speed, respectively. We commented on the Singaporean roll out strategy in our recent article.

In terms of 5G Availability, (the proportion of users on 5G-capable devices who spend a majority of their time on 5G networks), Thailand came first among its regional peers. Thailand was one of the first markets to launch 5G in the Asia Pacific region, with AIS and TrueMove H both launching commercial 5G services in Q1 2020, shortly after the conclusion of the country’s 5G auction. In the Philippines, 5G Availability was 18.1% in Q1 2022, ahead of Singapore (8.9%) and Indonesia, where operators launched 5G in select cities in June 2021, which explains the very low 5G Availability in Q1 2022 at 0.4%.

The Philippines looks to 5G to achieve imperative digital transformation

The importance of 5G technology and its role in enabling digital transformation is one of the pillars of the National Broadband Plan (NBP) approved in 2017. It outlines strategies and initiatives that should be taken to increase accessibility, affordability, and network quality. NBP also addresses policy and regulatory issues, such as spectrum, infrastructure policy, and modernizing regulations. Apart from the release of 5G spectrum in 3.3 GHz and 3.5 GHz bands, the Filipino government also supports 5G via a technology neutral policy, where all existing frequency bands can be used for 5G deployment.

Spectrum is one part of the puzzle

Various blocks of spectrum in and around 3.5 GHz have been awarded on a technology-neutral basis and are suitable for 5G usage. For instance, Smart, in its Q1 2022 results, reported that its 1800 MHz frequencies, previously used for 2G service, were being reallocated to provide 4G LTE service to handle the increased volume of data traffic. In addition, the newcomer, DITO, was awarded various blocks of frequencies, including spectrum at 700 MHz, 900 MHz, 2000 MHz, 2100 MHz, 2600 MHz, 3300 MHz, and 3500 MHz.

Sharing passive infrastructure

The terrain of the country poses substantial challenges related to network deployments — the Philippines comprises around 7,640 islands — about 2,000 of which are inhabited. To expedite the construction of telecom towers, especially in the unserved and underserved areas, the DICT issued guidelines on Shared Passive Telecommunications Tower Infrastructure (PTTI). The Philippines government has been pushing since September 2018 to attract investment from international tower companies by promising to streamline the cumbersome procedures required to build and connect towers. Operators are also looking to rationalize their tower portfolio: in April 2022, PLDT sold its towers for PHP 77 billion ($1.4 billion) to Axiata’s Edotco unit and EdgePoint Infrastructure. This is to support DICT’s goal of improving tower density via tower sharing. PLDT/Smart retained ownership of the active infrastructure such as antennas, radios and fiber backhaul, TowerCos own the passive infrastructure. Globe isn’t averse to selling its passive infrastructure either, as it works with various tower companies for its network rollout. The newcomer, DITO, had to catch up pretty fast in terms of network buildout — since 2019 it built close to 5,000 cellular towers, over 100 data centers, and laid out more than 30,000 kilometers of fiber cable.

Fortifying infrastructure to ensure network resiliency

Another challenge is the country’s propensity to natural disasters. Ookla’s data showed that the country’s internet speed saw a slight decline in January 2022, due to infrastructure damages brought in 22 provinces by Typhoon Odette. To future-proof the network for that, PLDT launched a project to deploy additional submarine fiber links to upgrade connectivity in Luzon. The project will replace old domestic fiber optic network (DFON) links and enhance the resiliency of PLDT’s network, and fortify existing aerial cables with underground inland cables to ensure network resiliency.

Furthermore in March 2022, DICT unveiled a plan to spend PHP 50 billion ($915 million) over the next three years, to improve the country’s digital infrastructure, as within two years only 2,000 towers out of 50,000 needed have been built.

Smart wins the 5G game in the Philippines

Chart of 5G performance among top providers in the Philippines

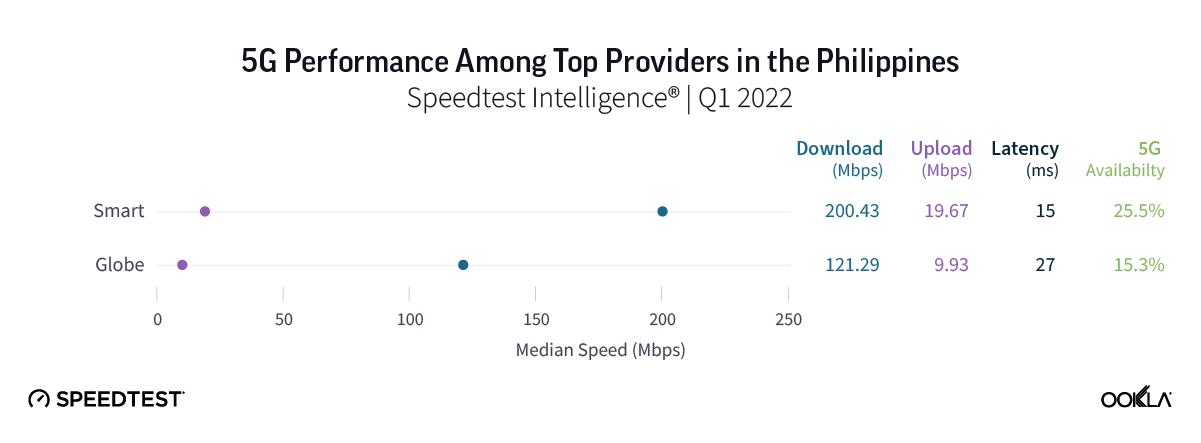
5G continues to advance in the Philippines. The operators have launched 5G mobile networks in 2020, not long after the Thai operators. Globe initially launched 5G technology for Fixed Wireless Access (FWA) in selected towns in June 2019, followed by 5G enhanced Mobile Broadband (eMBB) in February 2020 in Metro Manila, at the start available to premium “Globe Platinum” customers. Smart launched 5G network in July 2020, originally targeting postpaid subscribers in Metro Manila that had Smart-certified handsets — including devices from Huawei, Samsung, RealMe and Vivo — and 5G-activated SIM. Both operators utilized spectrum in the 3,500 MHz band, which is considered the sweet spot in terms of 5G network capacity and coverage. Our data shows that Smart recorded 200.43 Mbps median download/19.67 Mbps median upload speed in Q1 2022 ahead of Globe’s 121.29 Mbps download/ 9.93 Mbps upload.

Country-level 5G Availability almost doubled within a space of a year — from 9.4% in Q1 2021 to 18.1% in Q1 2022. Part of this is related to easing of the Right of Way (RoW) rules, which were adapted and rewritten in March 2021, when the Department of Public Works and Highways (DPWH) issued an order lifting the ban on the construction of critical infrastructure, particularly cell sites, along national roads. The Philippines are not the only country that benefits from RoW reform. In October 2021, India’s Department of Telecommunications (DoT) revised the Indian Telegraph Act Right of Way (RoW) rules which makes it easier to install aerial optical fiber cable in the country. To circumvent digging into the streets to lay fiber, the idea of deploying overhead fiber on street furniture such as light poles and traffic lights has been put forward.

Smart led in terms of 5G Availability, it reached 25.5% in Q1 2022, ahead of Globe (15.3%), due to different spectrum deployment strategies these operators take. Smart had 1.6 million connected 5G unique devices on its network in Q1 2022, more than triple the level than a year prior (376,000 in Q1 2021) while at end-March 2022, Globe logged over 2.0 million devices in its 5G network.

The operators plan further investment in 5G. In its Q1 2022 results, Smart’s parent company — PLDT — revised its 2022 CAPEX guidance to PHP 85 billion from PHP 76-80 ($1.39 – $1.46 billion) due to increased investment in the 5G rollout in different parts of the country. In December 2021, the US Trade and Development Agency (USTDA) awarded a grant to Smart to expand 5G to 96% of population and to support Smart’s investment in equipment and services from Cisco Systems. In Q1 2022, Smart reported its mobile data traffic grew 30% year-on-year to 1,010 petabytes. The number of its 5G base stations increased from 5,000 in 2020 to 7,300 in February 2022, corresponding to 66% 5G population coverage in Q1 2022. Aside from boosting its 5G network rollout, Smart introduced new 5G services to attract and migrate more data users to 5G, Signature Plans+, the first postpaid line-up in the country featuring Unlimited 5G, and also introduced the country’s first Unli 5G data offers for prepaid subscribers in April 2021.

Globe added 390 new sites in the first three months of 2022, extending its 5G network reach to 95% of NCR (National Capital Region) and 84% of key cities in Visayas and Mindanao. In 2021, Globe spent PHP 92.8 billion to achieve 2,000 5G outdoor sites and in-building solutions, build 1,407 new cell sites, and install 1.4 million fiber-to-the-home lines. Globe’s 5G services utilize a virtual 5G core network to deliver both FWA and mobile broadband service in areas where fiber deployment is challenged by various permit and RoW issues.

DITO selected Nokia to deploy 5G services in the island of Mindanao in May 2021 to augment an existing partnership on 4G roll out. In March 2022, Dito started the rollout of its 5G home Wi-Fi service pilot in 146 villages in the Metro Manila area. Villages in the City of Manila, Caloocan City, and Quezon City will be the first to access up to 500 Mbps of download speed through the Dito 5G Home WiFi Starter Kit. DITO 5G network isn’t available widely, we have however seen some 5G tests in Caloocan, where the operator reached a 5G median download speed of 512.66 Mbps in Q1 2022.

Consumer attitudes improve

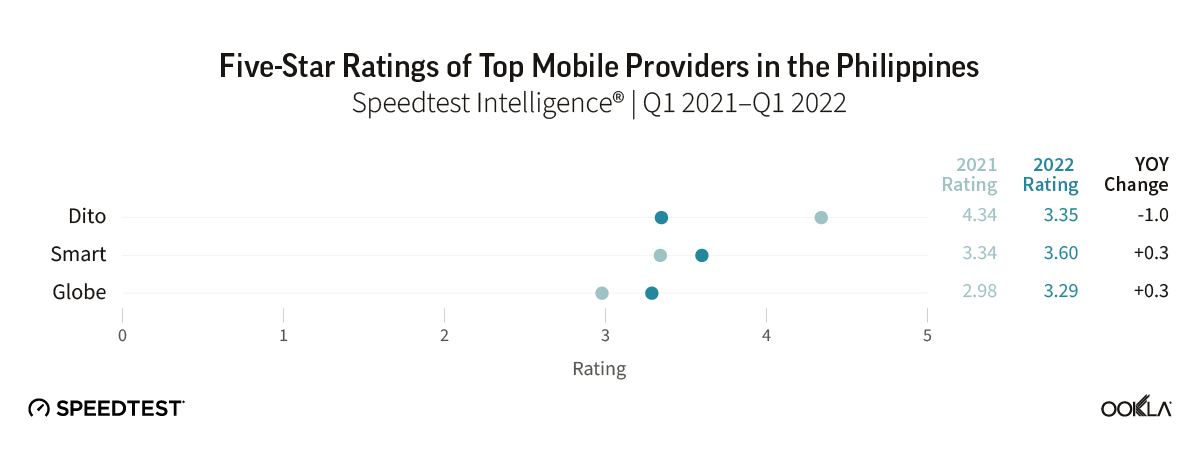
To assess whether there has been a shift in the consumer’s attitude towards mobile operators over the past year, we utilized Speedtest® Consumer Sentiment data, which is gathered from single-question surveys presented to users at the end of a Speedtest. This dataset provides rich insights into customer satisfaction over time, as well as competitive benchmarking, by providing data on both Net Promoter Score (NPS) and customers’ rating of their providers. Upon its entry into the market, DITO was rated most highly, which reflected its approach to winning customers’ mindshare. This, however, has changed — as of Q1 2022, Smart came first in ratings. Noteworthy though, is the overall improvement across operators, which is also linked with the mobile speeds increase.

Chart of five-star ratings of top mobile providers in the Philippines

Comparing NPS score to providers’ performance it is clear that better speeds impacted customer perception of operators. In Q1 2021, NPS for all cellular technologies was -34.53 with an average download speed of 6.47 Mbps, which improved to -25.32 in Q1 2022 (8.75 median download speed).

We’ll continue using data from Speedtest Intelligence to see how 4G and 5G in the Philippines improves with additional operator investment and how consumers benefit.
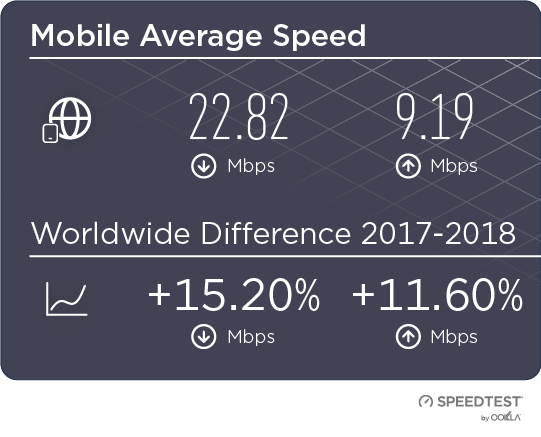
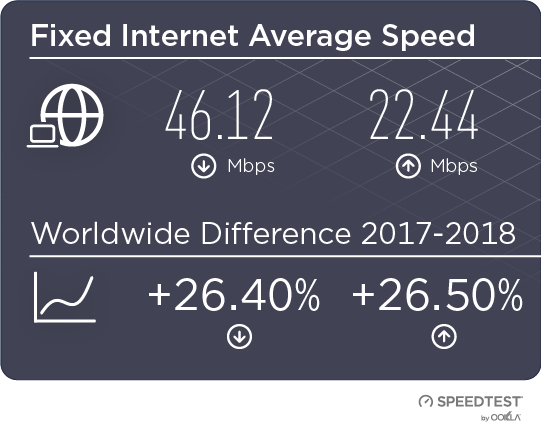
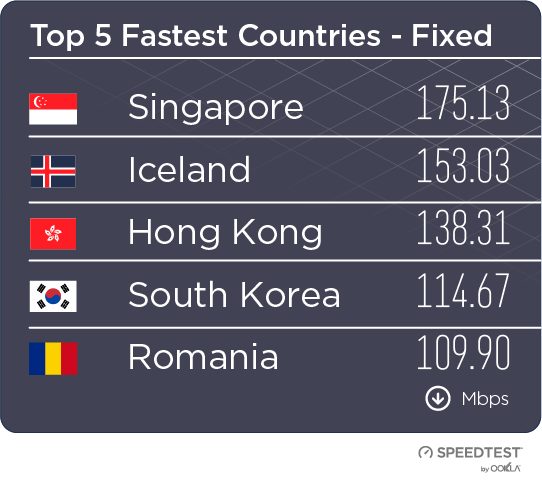
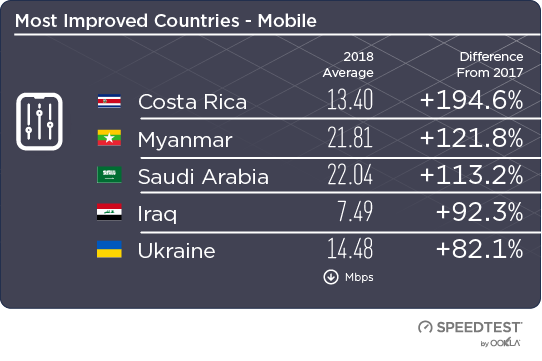
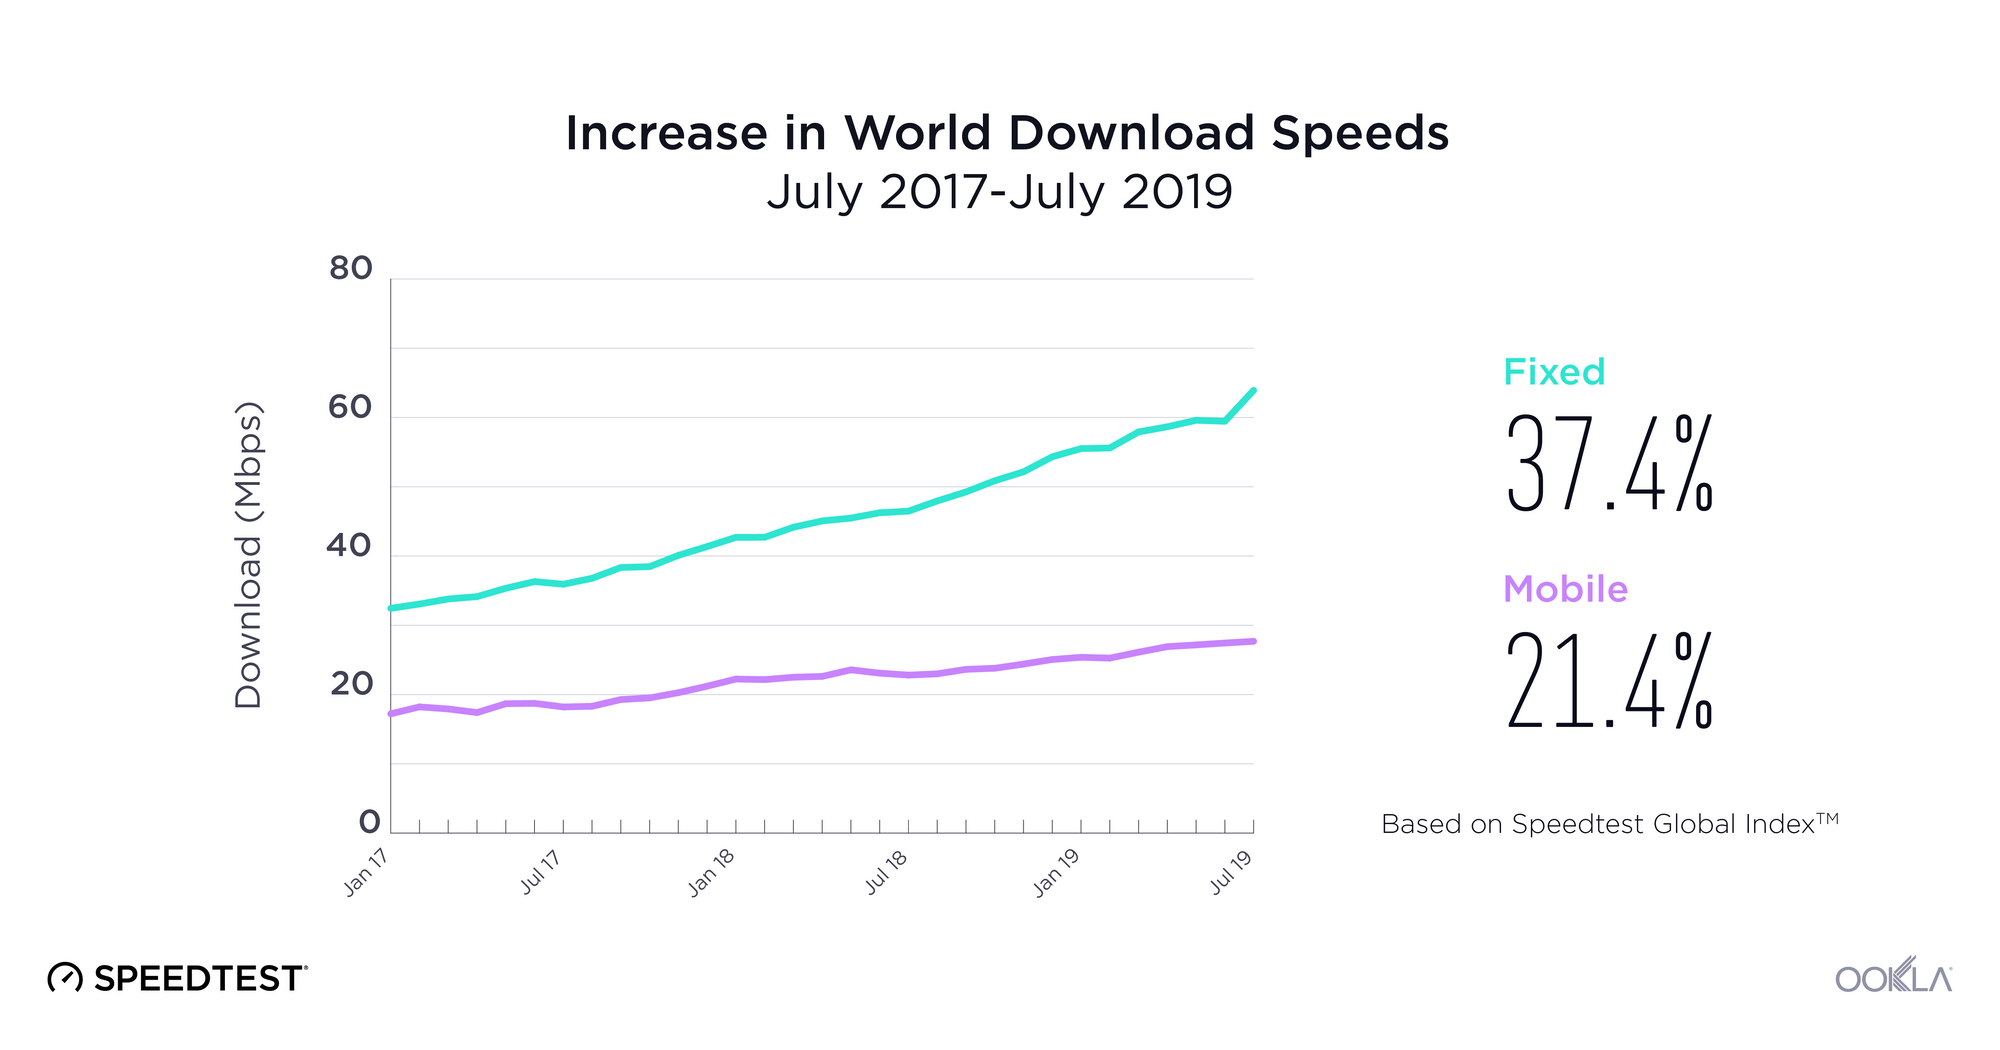
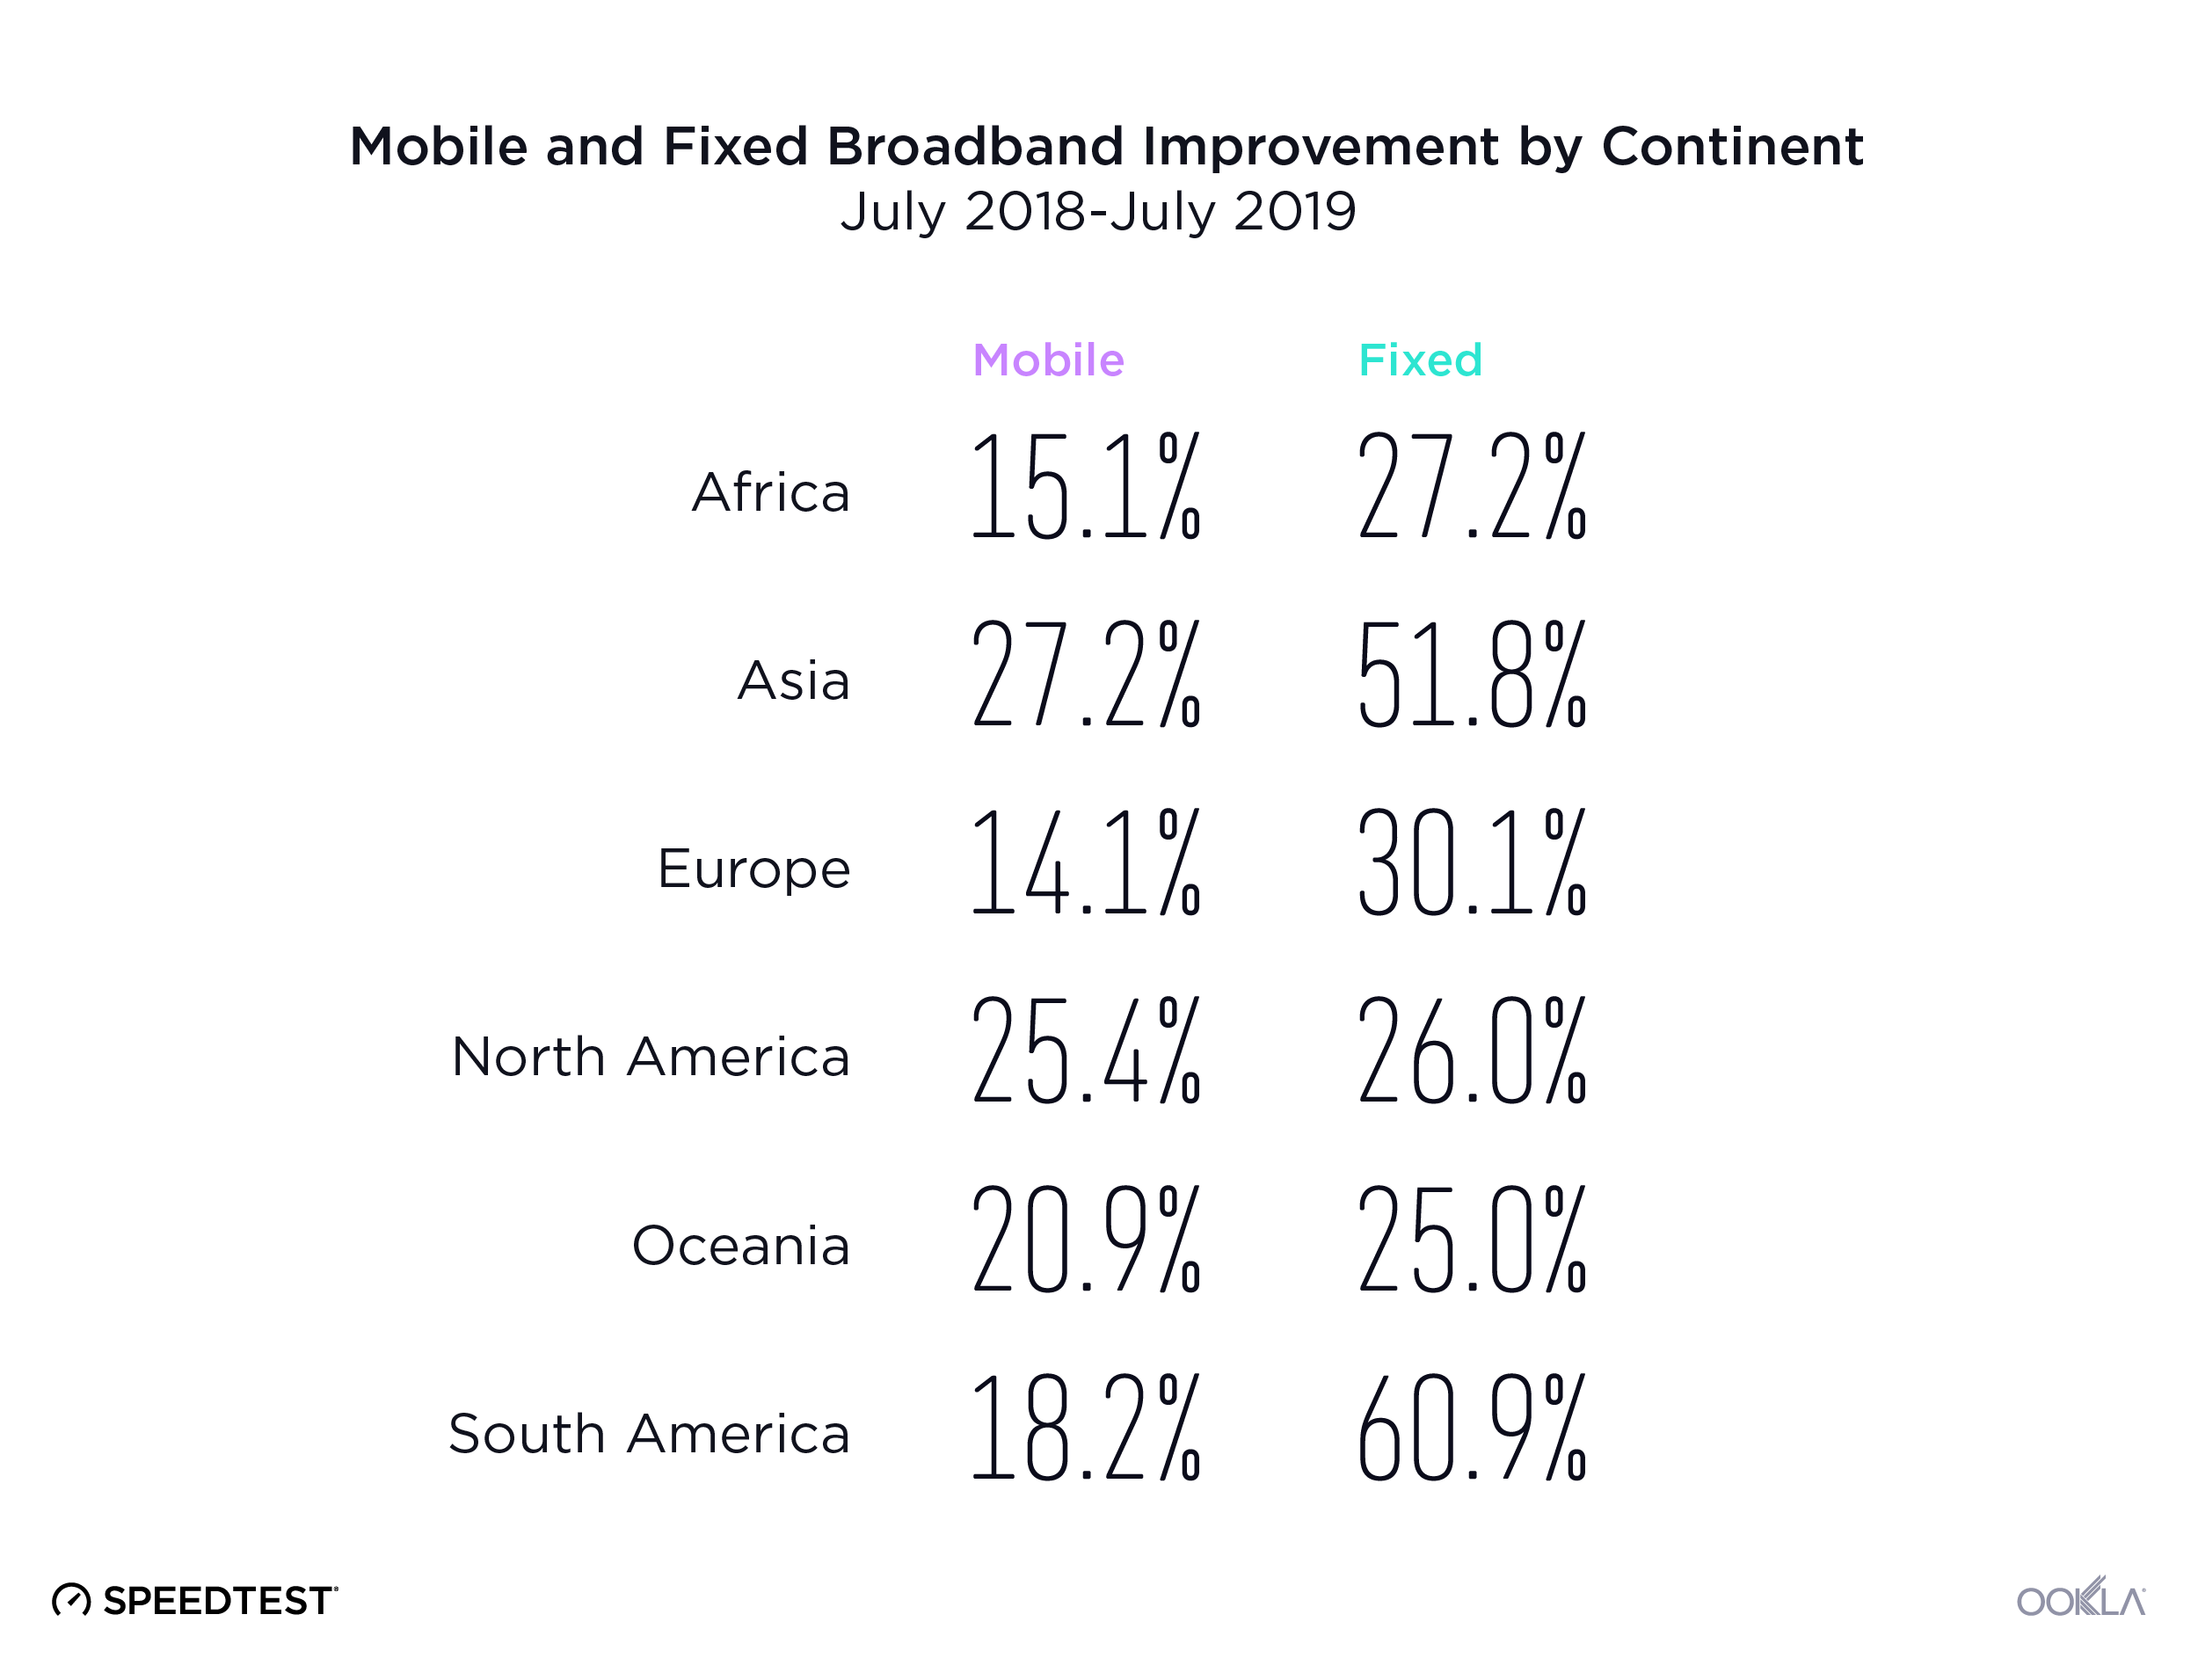
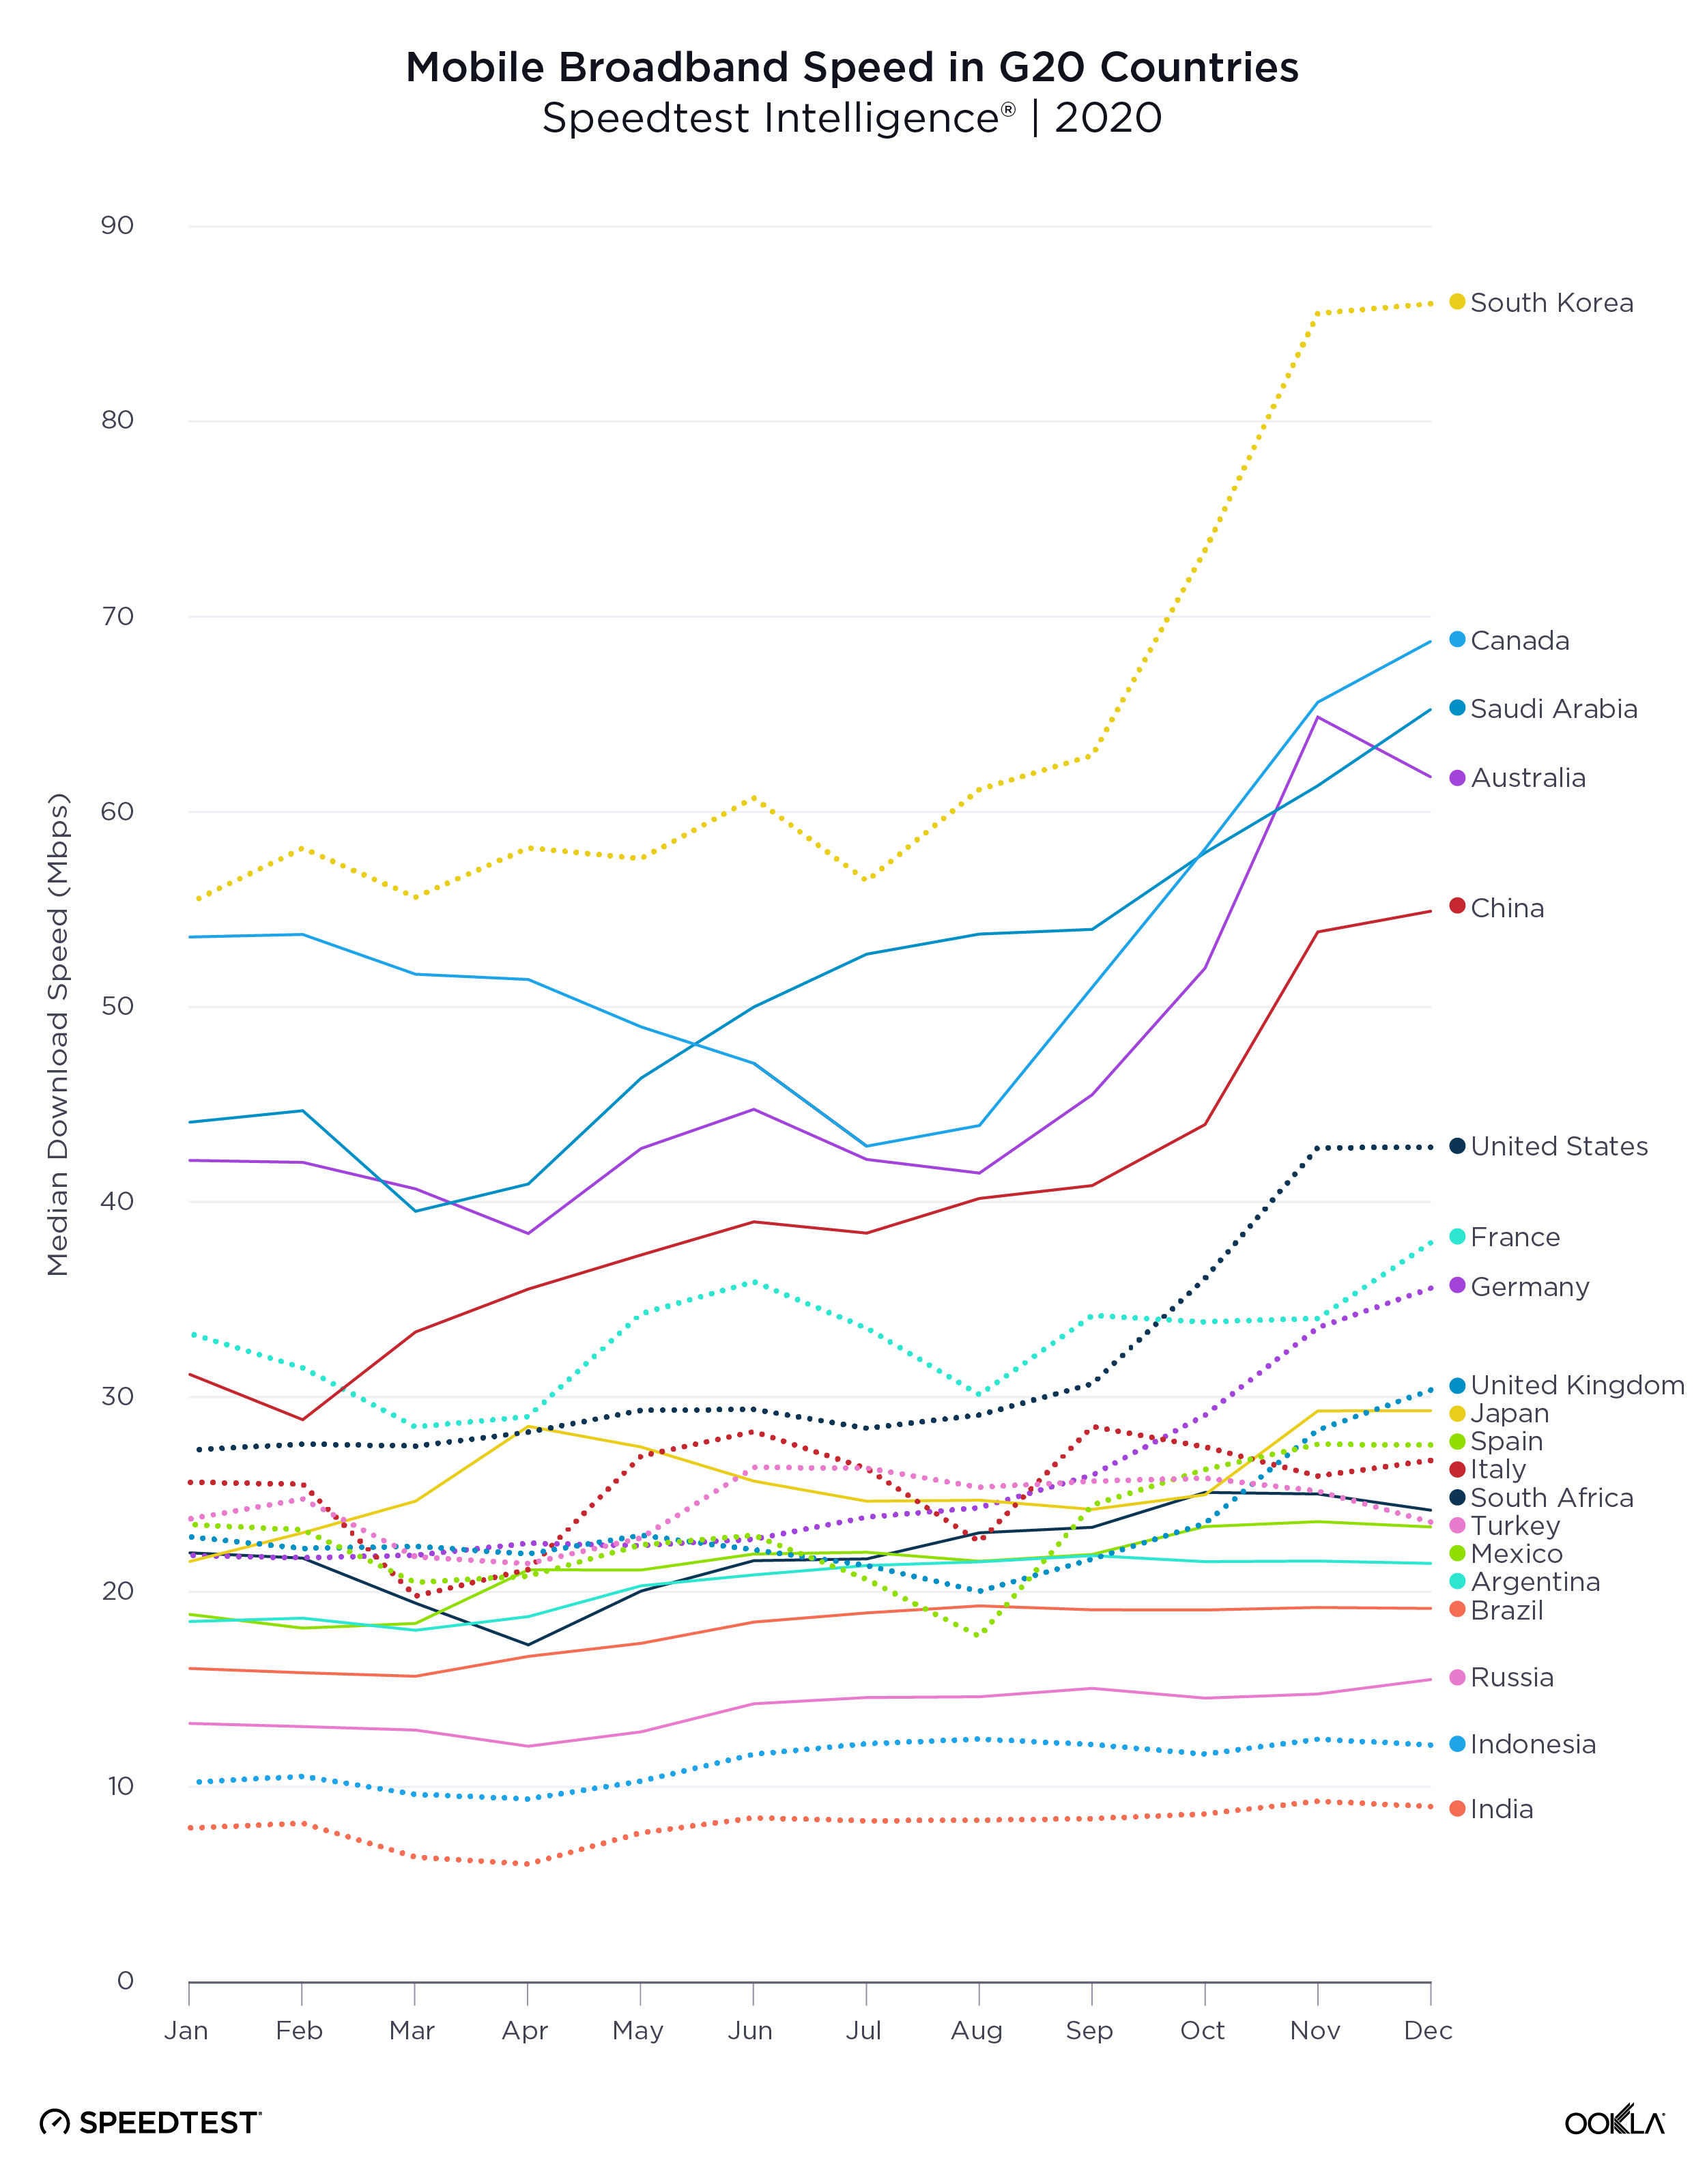
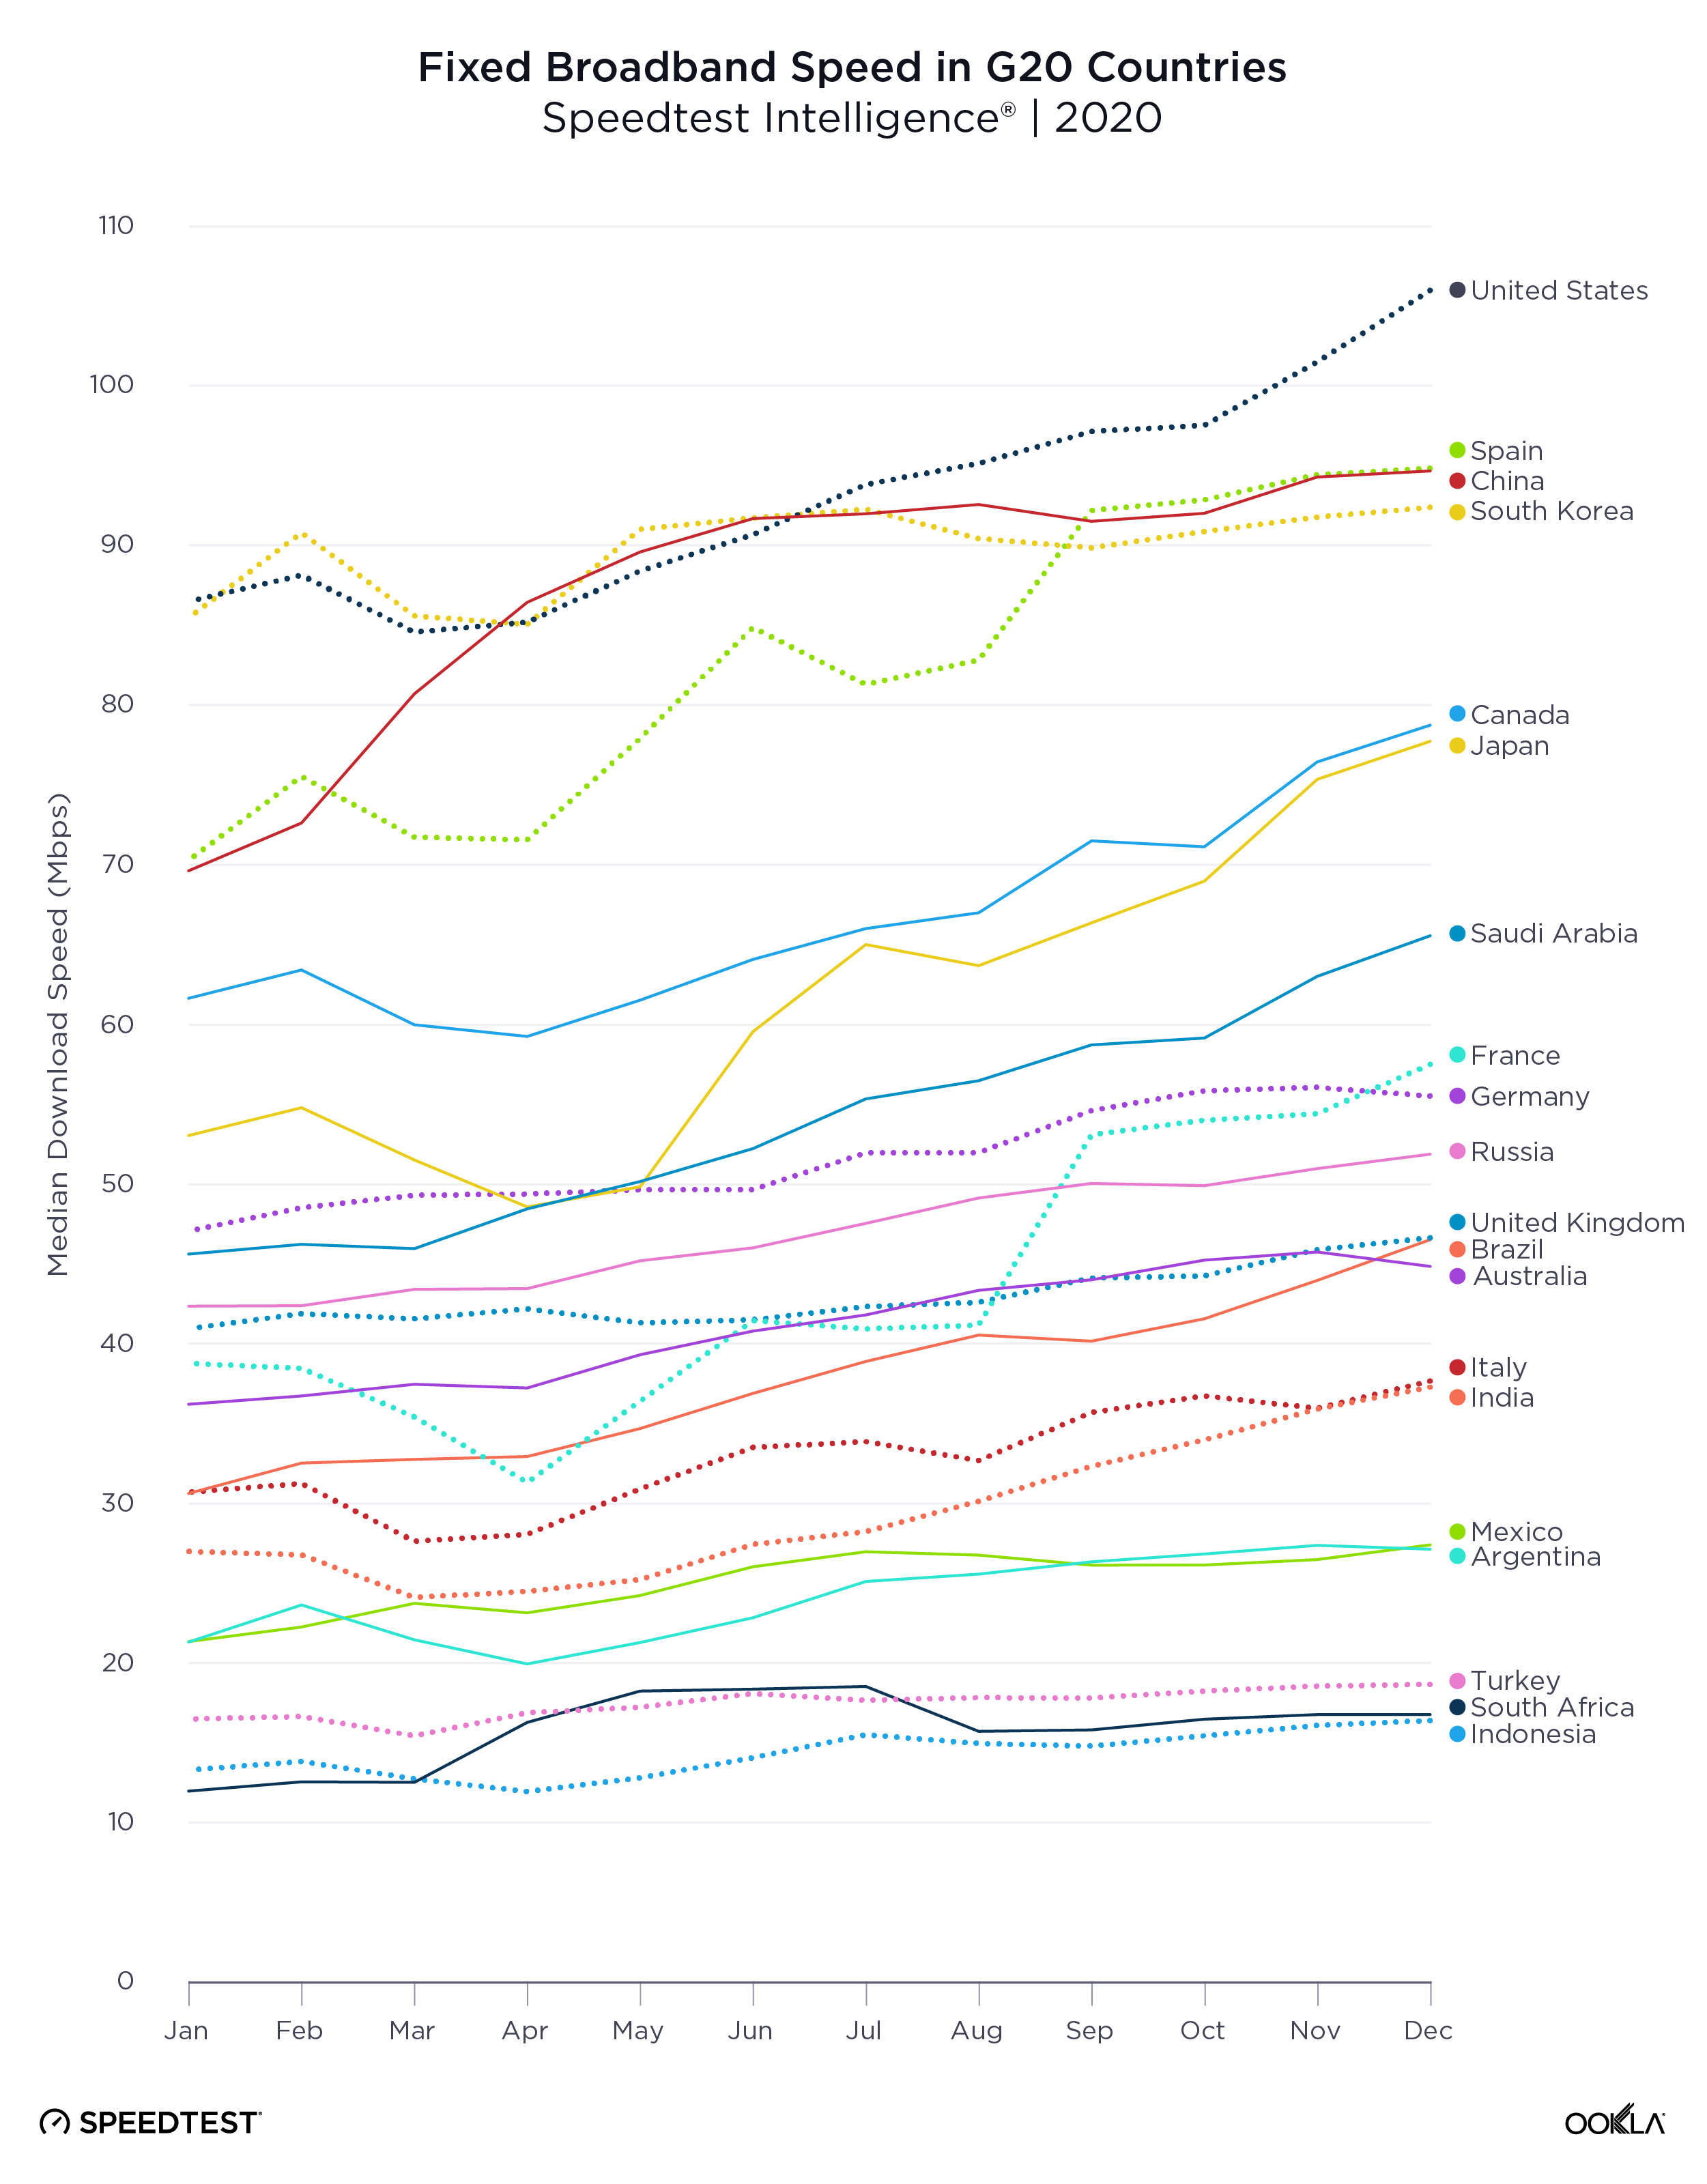
Ookla retains ownership of this article including all of the intellectual property rights, data, content graphs and analysis. This article may not be quoted, reproduced, distributed or published for any commercial purpose without prior consent. Members of the press and others using the findings in this article for non-commercial purposes are welcome to publicly share and link to report information with attribution to Ookla.

| December 12, 2017

The World’s Internet Speeds Increased More than 30% in 2017. Are You Keeping Up?

In a world where business and life are increasingly fast and global, you want to know if your country’s internet is up to speed. In August, we launched Speedtest Global IndexTM to provide you that objective look at internet performance around the world. Knowing what your speeds are and how they compare to your neighbors’ makes for a good story, but what was missing was a benchmark. To provide you that worldwide context, we’re introducing Global Speed, the average internet speed of the world, to the top of the Speedtest Global Index.

You can still use the Speedtest Global Index to see download and upload speeds by country and rank who’s fastest and slowest. Here we’ve paired data about those individual country speeds over the past year with the new global averages call out which countries have improved most over the past year, who’s shown the least improvement and what speeds are like in the world’s most populous countries. Read on to see who’s winning the internet speed race and who has a lot of catching up to do.

The comparisons here are based on Speedtest data from November 2016-November 2017. We used the same monthly threshold for this article that we do for inclusion in the Speedtest Global Index: to be ranked in each category, countries must have at least 670 Speedtest results from unique users on mobile and at least 3,333 for fixed broadband. Although we use the word “country” throughout, you will notice some regions like Hong Kong and Puerto Rico that are large or autonomous enough to call out as separate entities, even though they are not separate countries. Global speeds are a weighted average of all samples from around the world.

Global download speeds are up more than 30% across the board

With a mean global speed of 20.28 Mbps, mobile downloads increased 30.1% over the last 12 months and mobile uploads increased 38.9%. A global average of 40.11 Mbps makes fixed broadband downloads 97.8% faster than mobile and this speed increased 31.6% during the same period. Uploads over fixed broadband showed the smallest increase of 25.9%.

Global Internet Speeds
November 2016 – November 2017
Download: November 2017 Average (Mbps) Download: Year Over Year Increase Upload: November 2017 Average (Mbps) Upload: Year Over Year Increase
Mobile 20.28 30.1% 8.65 38.9%
Fixed 40.11 31.6% 19.96 25.9%

In November 2017, 119 countries boasted a faster mobile download speed than the global average while 134 were slower. On the fixed broadband side, 71 countries and regions beat the global average download speed and 185 were slower. As we reported last week, gigabit Speedtest results are rolling in from across the planet, but their distribution across continents is wildly uneven.

Most improved countries

It was a good year for Laotian mobile speeds. With a 249.5% jump in mobile download speeds, Laos showed the largest improvement in the world. Vietnam came in second with an increase of 188.7% and Trinidad and Tobago was third at 133.1%. All of the countries listed on the table below are to be commended for making mobile internet faster.

Countries with the Largest Improvement
Mobile Download Speed

November 2016 – November 2017
Year Over Year Increase November 2017 Speed (Mbps)
Laos 249.5% 13.77
Vietnam 188.7% 19.54
Trinidad and Tobago 133.1% 11.68
Hong Kong (SAR) 102.6% 35.64
Lebanon 92.3% 24.50
Cyprus 90.2% 26.14
Republic of the Union of Myanmar 81.0% 11.72
Costa Rica 80.9% 7.89
Cambodia 70.5% 14.97
Sudan 68.9% 9.85

The tiny island of Reunion, a region of France off the coast of Africa, saw the largest improvement in download speed over fixed broadband in the world with a gain of 141.5%. Guatemala was second at 116.7% and Ghana third at 82.1%.

Countries with the Largest Improvement
Fixed Broadband Download Speed

November 2016 – November 2017
Year Over Year Increase November 2017 Speed (Mbps)
Reunion 141.5% 62.64
Guatemala 116.7% 12.04
Ghana 82.1% 18.96
Peru 80.1% 16.48
India 76.9% 18.82
Panama 76.6% 28.62
Italy 72.1% 31.58
Libya 67.6% 3.84
Argentina 62.2% 15.49
Kenya 60.9% 15.59

In some countries, notably Libya, a small gain in megabits per second (Mbps) can result in a large percentage increase. Although the actual performance improvement is small, we’re glad to see speeds moving in the right direction.

Speeds in some countries declined

On the flip side, there were far too many countries and regions where internet speeds decreased. The devastation of Puerto Rico’s mobile infrastructure by Hurricane Maria surely contributed to the island’s 39.8% drop in mobile download speed during the past twelve months. Uzbekistan saw a decline of 31.8% and Côte d’Ivoire 26.1%.

Countries with the Smallest Improvement
Mobile Download Speed

November 2016 – November 2017
Year Over Year Change November 2017 Speed (Mbps)
Puerto Rico -39.8% 8.53
Uzbekistan -31.8% 6.47
Côte d’Ivoire -26.1% 10.95
Brunei -23.4% 9.83
Thailand -19.7% 13.38
Iraq -16.8% 3.12
Algeria -10.8% 7.19
Nigeria -8.4% 9.90
Bangladesh -7.4% 4.97
Morocco -6.3% 15.03

Algeria saw the largest decrease in download speed over fixed broadband speed in the world at 23.9%. Dips of 9.1% in Ecuador and 6.5% in Latvia were less troubling but still moving in the wrong direction.

Countries with the Smallest Improvement
Fixed Broadband Download Speed

November 2016 – November 2017
Year Over Year Change November 2017 Speed (Mbps)
Algeria -23.9% 3.76
Ecuador -9.1% 10.40
Latvia -6.5% 47.25
Tunisia -3.2% 6.90
Iraq -1.1% 7.87
Syria -0.3% 7.12
Taiwan 0.5% 42.32
Maldives 1.0% 12.04
Namibia 1.2% 9.74
Jamaica 1.5% 19.11

Performance in the world’s most populous countries

With 57% of the world’s population, any internet performance improvements seen in the world’s ten most populous countries have a wide reach. Pakistan came out on top of the world’s largest countries with a 56.2% jump in mobile download speed during the past 12 months. India came in second in this category at 42.4% and Brazil third at 27.6% .

World’s Most Populous Countries
Improvement in Mobile Downloads

November 2016 – November 2017
Year Over Year Change November 2017 Speed (Mbps)
Pakistan 56.2% 13.08
India 42.4% 8.80
Brazil 27.6% 16.25
Japan 23.5% 21.67
United States 22.0% 26.32
Russia 19.2% 15.80
Indonesia 18.1% 9.73
China 3.3% 31.22
Bangladesh -7.4% 4.97
Nigeria -8.4% 9.90

At the other end of the spectrum, Nigeria’s mobile download speed actually dropped 8.4% and Bangladesh’s dipped 7.4%. China showed only a modest 3.3% increase in mobile download speed in 2017.

On the fixed broadband side, India came out on top of the world’s most populous countries for improvements to download speed during the past 12 months with an increase of 76.9%, beating China’s second place 42.3% increase and a 37.3% gain in the U.S.

World’s Most Populous Countries
Improvement in Fixed Broadband Downloads

November 2016 – November 2017
Year Over Year Change November 2017 Speed (Mbps)
India 76.9% 18.82
China 42.3% 61.24
United States 37.3% 75.94
Japan 20.7% 73.51
Indonesia 18.9% 13.38
Brazil 18.5% 17.80
Pakistan 15.5% 6.13
Russia 14.6% 36.90
Bangladesh 13.7% 16.14
Nigeria 3.8% 9.53

Nigeria again came out at the bottom of the world’s largest countries, this time with a 3.8% increase in download speed over fixed broadband.

We’ll revisit global internet speeds periodically here on our blog, but you can keep up to date on the latest trends in worldwide internet speeds by visiting the Speedtest Global Index. It’s updated every month with individual country data and, now, global averages. Keep track of your country’s performance and see how you rank against the world.

Ookla retains ownership of this article including all of the intellectual property rights, data, content graphs and analysis. This article may not be quoted, reproduced, distributed or published for any commercial purpose without prior consent. Members of the press and others using the findings in this article for non-commercial purposes are welcome to publicly share and link to report information with attribution to Ookla.