| March 13, 2020

Tracking COVID-19’s Impact on Global Internet Performance (Updated July 20)

We are no longer updating this article as internet speeds in most countries have stabilized to pre-pandemic levels. For ongoing information about internet speeds in specific countries, visit the Speedtest Global IndexTM or contact our press team.

Ookla® closely monitored the impact of COVID-19 on the performance and quality of global mobile and broadband internet networks in the early days of the pandemic. We shared regular information based on Ookla data to assist in the understanding of this unprecedented situation. You can still download the July 20, 2020 CSV here which contains all the public data we tracked in this article. If you are looking for information on internet or online service outages, please check Downdetector®.

Ookla retains ownership of this article including all of the intellectual property rights, data, content graphs and analysis. This article may not be quoted, reproduced, distributed or published for any commercial purpose without prior consent. Members of the press and others using the findings in this article for non-commercial purposes are welcome to publicly share and link to report information with attribution to Ookla.

| January 4, 2021

Slack Starts the New Year Late


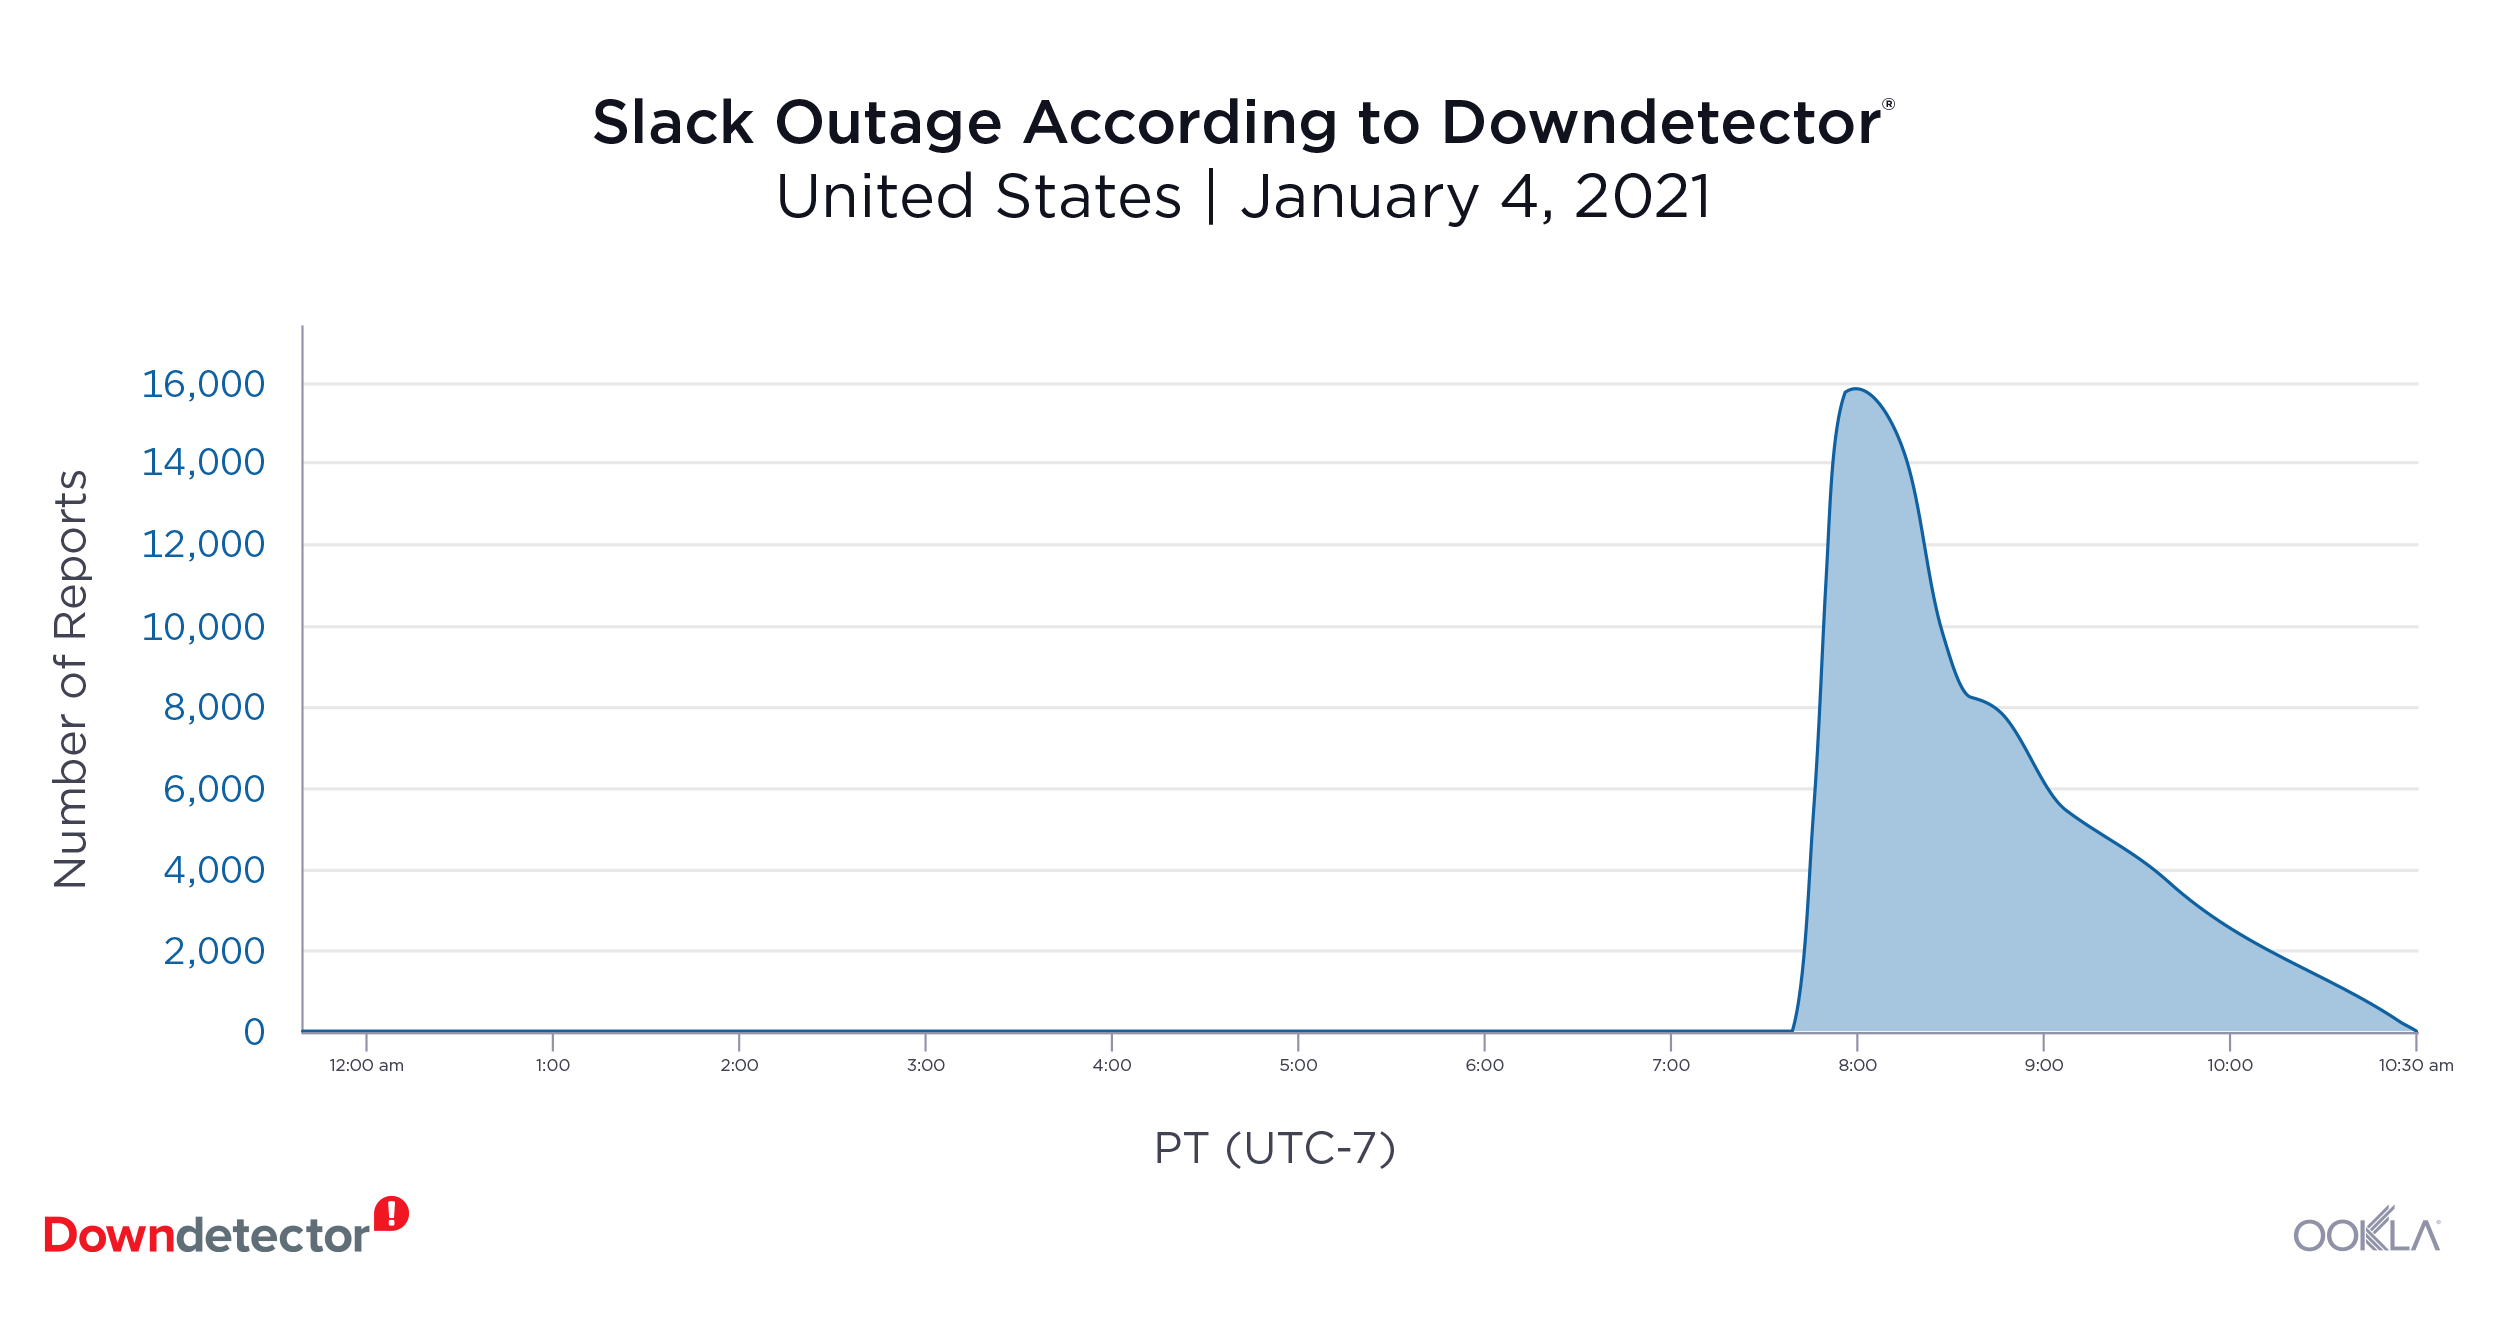
2021 started with a sigh today as workers across the globe rushed back to their desks only to find that Slack was down. Users flocked to Downdetector® to report problems with Slack across the globe just after 7:00 a.m. Pacific. Issues were reported in Asia (Japan), Australia, Europe (Finland, France, Germany, Italy, the Netherlands, Poland, Russia, Spain, Sweden and the United Kingdom), North America (United States and Canada) and South America (Brazil). The most frequently reported issue was the inability to connect at all and the majority of reports came from the U.S.

Downdetector_Slack_Outage_1020

Although the spike has passed and the outage seems to be resolving itself, the service is not fully operational yet. Now might be a good time to take a breath and catch up on all that post-holiday email. The little red notification will be back on your desktop soon enough.

Downdetector data can help your team resolve service issues faster and improve customer experience when an outage occurs, which becomes all the more important during periods of high usage. Contact us here to learn how your network operations center can get faster outage detection.

Ookla retains ownership of this article including all of the intellectual property rights, data, content graphs and analysis. This article may not be quoted, reproduced, distributed or published for any commercial purpose without prior consent. Members of the press and others using the findings in this article for non-commercial purposes are welcome to publicly share and link to report information with attribution to Ookla.

| January 12, 2021

2020 Recap: How the Internet Held Up During a Global Pandemic


There was major concern last year that the internet might fail under the pressure of increased use as COVID-19 drove unparalleled waves of remote work and schooling. We watched internet performance carefully using data from Speedtest Intelligence® as conditions changed in different areas of the world. Now we’re back to assess what happened during the year as a whole.

A note on the methodology: 5G launches drove up mean internet speeds on mobile in many countries. For this reason we’ve simplified our view to include only median speeds, which are less subject to being skewed by especially fast 5G tests.

Mobile speeds dipped in many G20 countries in the spring of 2020

Mobile-Broadband-Speeds-in-G20-Countries_0121

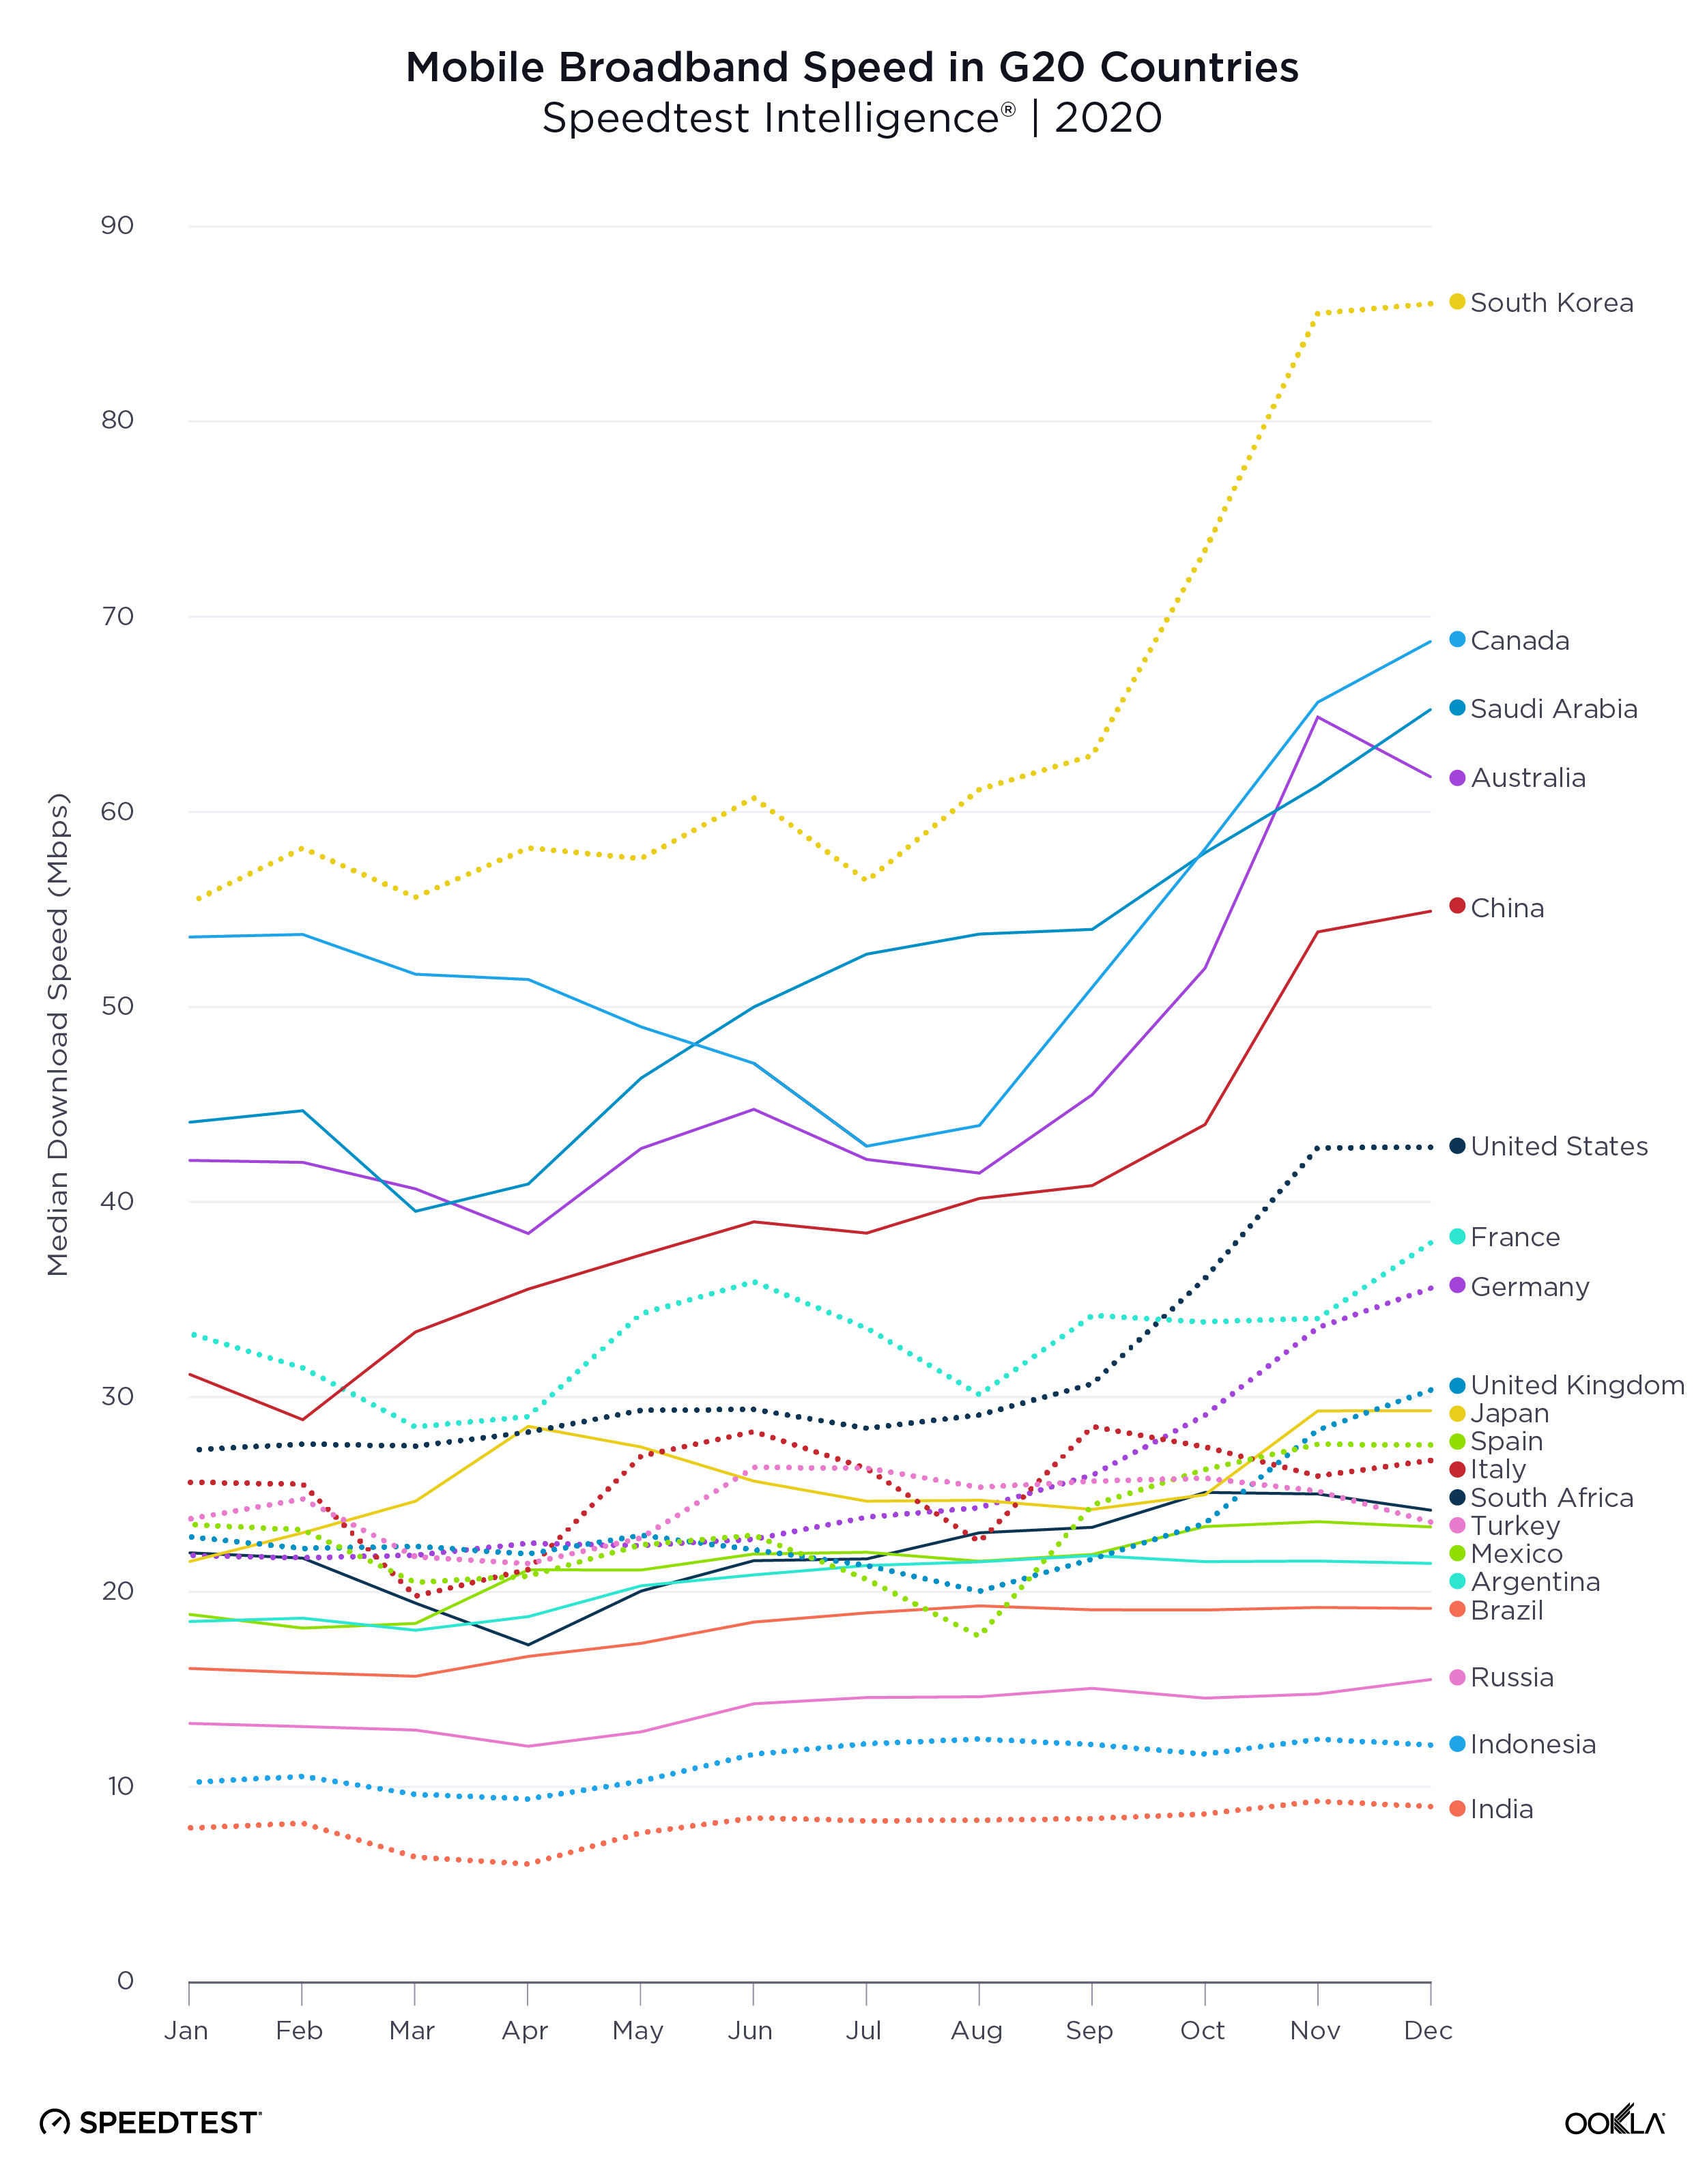
Median download speeds over mobile in many G20 countries dropped at some point during 2020. Countries that saw month-to-month declines during the spring include: Australia, Canada, France, India, Italy, Saudi Arabia, South Korea, Spain and Turkey. China saw a decline in mobile speed in February while Japan suffered a drop in June and July. Argentina, Brazil, Indonesia, Russia and the United Kingdom showed only very minor decreases, while speeds in Germany, Mexico, South Africa and the United States remained unchanged or increased.

Despite the drops, almost all G20 countries saw higher median download speeds over mobile in December 2020 than they had in January 2020. Median download speed over mobile increased 76.3% in China during that time. Germany saw a 62.8% increase, the United States 56.9%, South Korea 55.5% and Saudi Arabia 48%. Turkey saw a 0.7% decrease in median download speed over mobile during the same period.

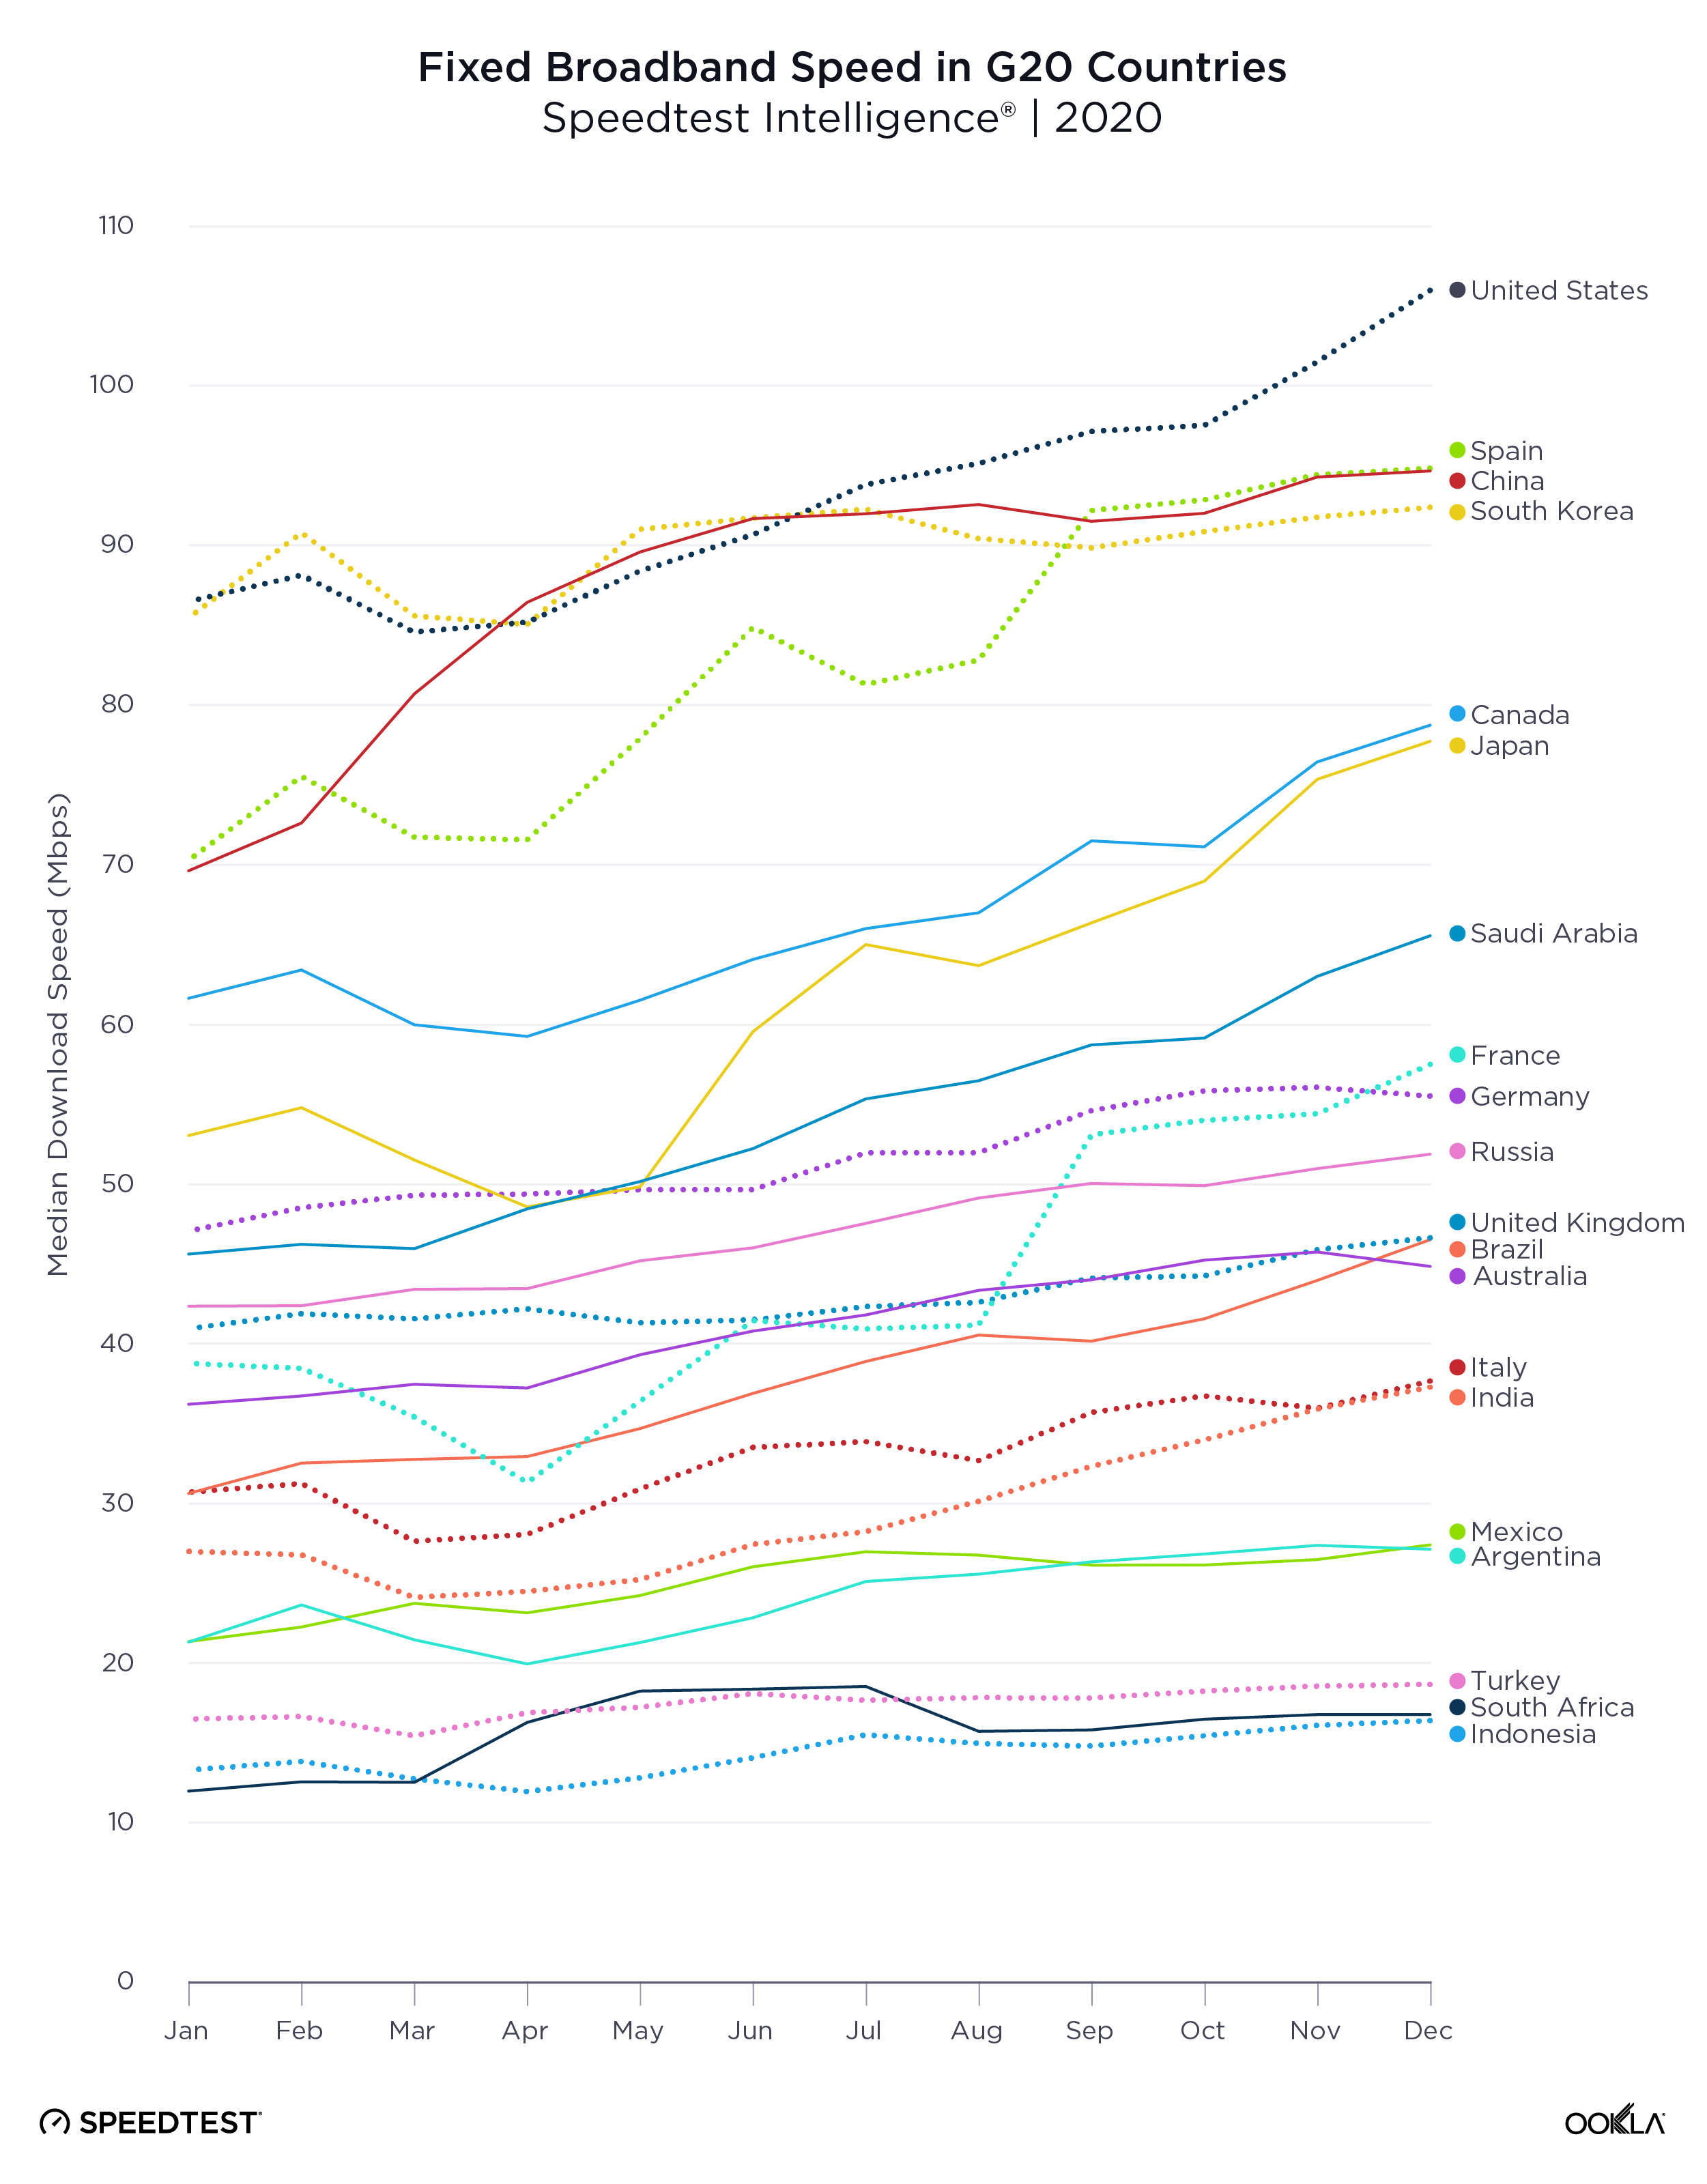
Despite interim dips, fixed broadband improved in all G20 countries during 2020

Fixed-Broadband-Speeds-in-G20-Countries_0121

There were notable dips in median download speeds over fixed broadband in many countries during the spring of 2020. G20 countries that saw these declines on a monthly basis include: Argentina, Canada, France, India, Indonesia, Italy, Japan, South Korea, Spain, Turkey and the United States. Brazil, China, Germany and Russia notably showed only increases in month-to-month median download speed over fixed broadband during this time. Other countries showed only very minor decreases.

Perhaps most important, all G20 countries saw higher median download speeds over fixed broadband in December 2020 than they had in January 2020. Median download speed over fixed broadband increased 51.9% in Brazil during that time. France saw a 48.3% increase, Japan 46.5%, Saudi Arabia 43.7% and South Africa 40%. South Korea saw the smallest increase in median download speed over fixed broadband over the same period at 8.1%.

We are impressed, on the whole, with how well the internet held up to the massive scale of increased use during the past year. Of course, month-by-month, country-level views are averages that might not reveal problems with specific mobile operators or internet service providers on individual days. If you want to assess how your internet connection is performing right now, take a Speedtest®. And if you are unable to connect to a specific service on the internet, check Downdetector® to see the status of that service.

Ookla retains ownership of this article including all of the intellectual property rights, data, content graphs and analysis. This article may not be quoted, reproduced, distributed or published for any commercial purpose without prior consent. Members of the press and others using the findings in this article for non-commercial purposes are welcome to publicly share and link to report information with attribution to Ookla.
| August 2, 2022

Find Out Which 50 Top European Vacation Destinations Have the Fastest Mobile Internet Speeds

Vacation season is upon us with millions of tourists already flocking to Europe’s top summer destinations despite the heat. Whether you’re a European looking for the best “staycation” or an American taking advantage of the exchange rates, our analysis of mobile internet performance in 50 popular destinations across the continent should help you see how well you will be able to connect (or disconnect, should you so choose) on vacation this summer.

We divided these towns and cities into four categories that might appeal to different types of travelers: big cities, beach life, cultural havens, and forest getaways. Then we compared Speedtest Intelligence® data for median download speeds and multi-server latency across each category. Of course many of the best vacation destinations belong in multiple categories, so be sure to check each list to find your favorite locale, and you’ll want to remember that your experience may vary based on your carrier’s roaming agreement.

“Big cities” with internet performance as exciting as the lifestyle

Oslo, Norway topped our list of 15 European vacation destinations full of big city excitement with the fastest mobile internet with a median download speed of 156.99 Mbps during Q2 2022. Perfect if you’re planning to do live updates from the Øya Festival. Two other Nordic cities rounded out the top three with Stockholm, Sweden showing a median download speed of 136.74 Mbps and Copenhagen, Denmark coming in at 133.16 Mbps. With speeds like these you should be able to host as many “see how glorious my vacation is?” video calls as you want.

There was a large gap between these three cities and the next fastest group, led by Lisbon, Portugal at 86.49 Mbps. Istanbul, Turkey and Rome, Italy had the lowest median download speeds on this list. These are still adequate mobile speeds, especially if you want to lean into the vacation experience and report back on it later (if ever).

Nicosia, Cyprus had the lowest median multi-server latency on our “big city” list at 17 ms during Q2 2022. This metric measures how quickly your device gets a response after you’ve sent out a request during three stages so you can understand if you’ll run into unnecessary lags in your connection. We’ve previously reported how latency in Europe increased while roaming, and higher latency could mean that you encounter glitches in video calls or even have to shut down apps to get your phone to respond in a timely fashion. Rome had the highest latency on this list.

Where internet speeds are fit for “beach life”

Nothing says summer like relaxing on the beach. If your beach vacation needs fast internet access, surf the web in Biarritz, France and Korčula, Croatia. These two locales had the fastest median download speeds on our beach life list during Q2 2022 at 155.65 Mbps and 133.67 Mbps, respectively, though this is not a statistically significant difference. Varna, Bulgaria and Faro, Portugal rounded out the top four at 104.00 Mbps and 101.74 Mbps, respectively.

Amalfi, Italy and Cefalù, Italy are good beach destinations if you’re looking for encouragement to log off. With median download speeds of 31.40 Mbps and 38.18 Mbps, respectively, during Q2 2022, your internet connection should be adequate (though less inspiring than the Tyrrhenian Sea).

Piran, Slovenia had the lowest median multi-server latency (20 ms) on this list while Cefalù had the highest (56 ms).

“Cultural havens” with research-ready internet speeds

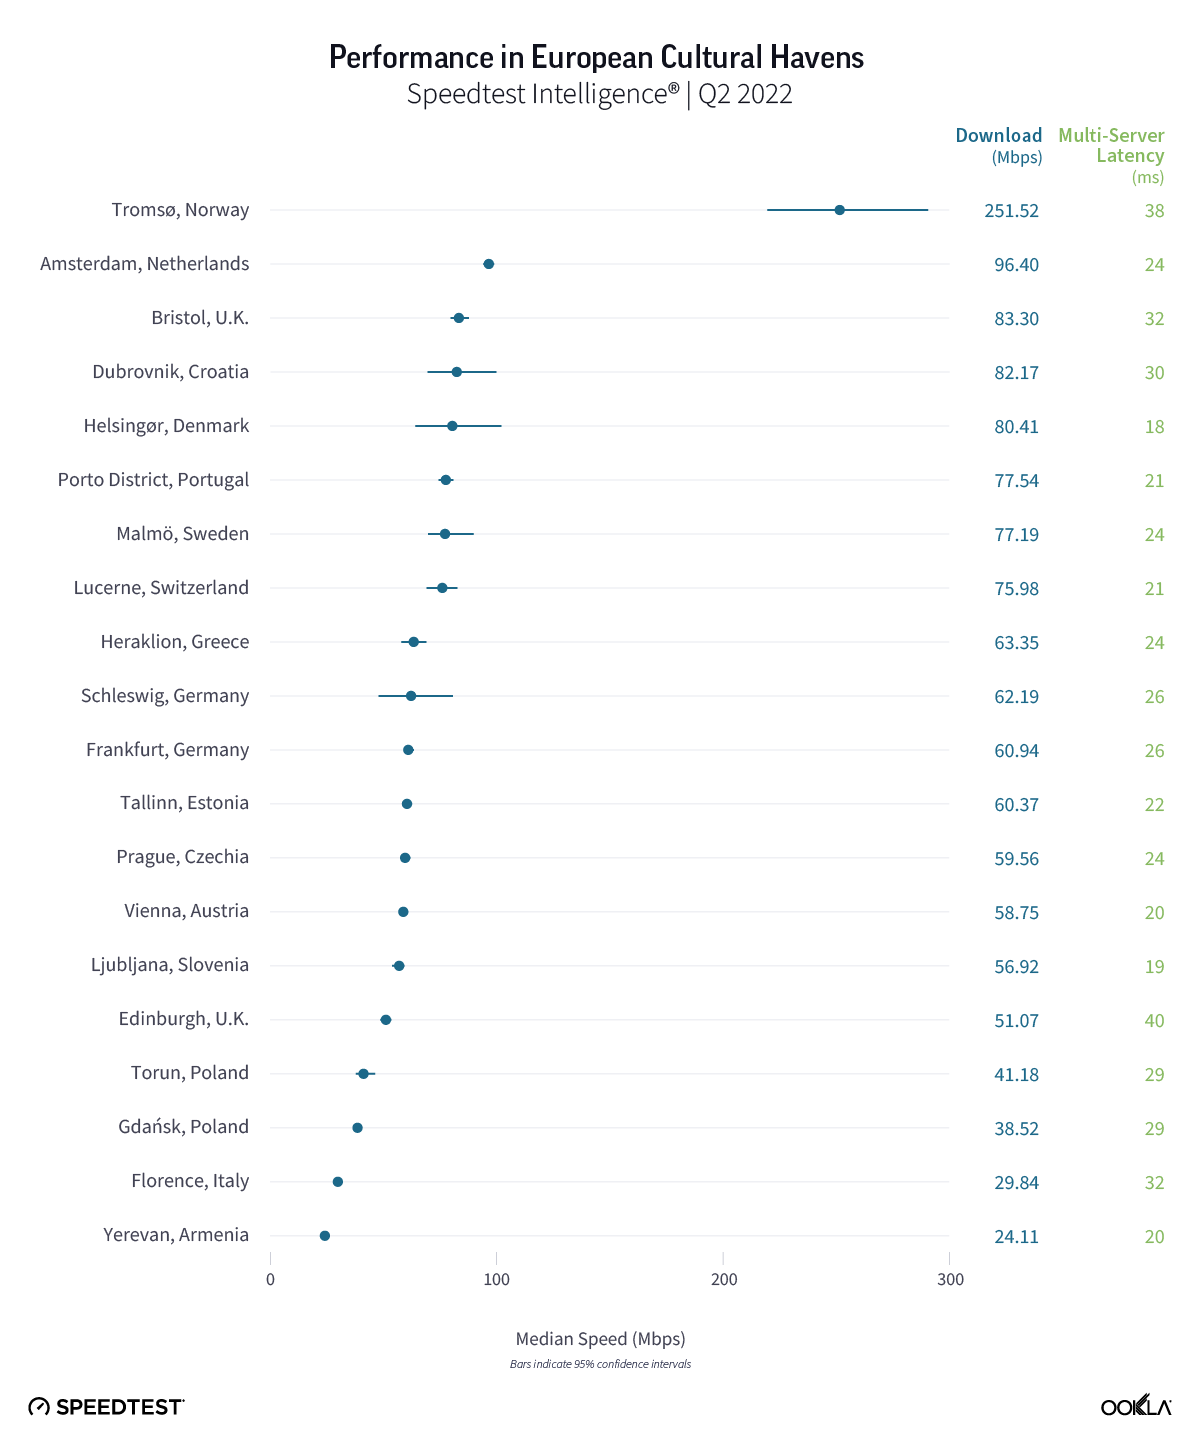
Travelers looking for maximum culture and fast internet speeds can do no better than Tromsø, Norway, which had a median download speed on mobile of 251.52 Mbps during Q2 2022, almost 2.3x faster than runner-up Amsterdam, Netherlands. Whether you’ve traveled to the northernmost bit of Norway for the wooden houses, one of the many summer festivals, or just to escape the heat, you’ll have fast enough internet to thoroughly research all the places you can go if you extend your vacation.

At the other end of the spectrum, if you’re traveling to Yerevan, Armenia or Florence, Italy to enjoy the museums and other cultural highlights of either, you might want to take pictures instead. With median download speeds of 24.11 Mbps and 29.84 Mbps, respectively, these cities were the slowest on this list. All the more reason to immerse yourself in the sights and wait to connect to Wi-Fi before uploading your photos.

Helsingør, Denmark had the lowest median multi-server latency, while Edinburgh, Scotland, United Kingdom had the highest. High latency can impede the performance of your phone even when you’re in an area with great speeds — something to keep in mind if you’re relying on your phone to locate the next Fringe venue.

Navigate internet speeds in “forest getaways”

Some people swear by the forest for the best vacations, especially in the heat of summer. The Alpine cities of Innsbruck, Austria and Digne-les-Bains, France had the fastest median download speeds over mobile on our list of forest getaways during Q2 2022 at 87.34 Mbps and 67.30 Mbps, respectively, though there was no statistical winner between the two. There was also no statistically significant difference between the median download speeds in Zakopane, Poland (43.52 Mbps); Killarney, Ireland (35.90 Mbps); and Sighișoara, Romania (30.48 Mbps). While you may prefer to be offline in the woods, having a strong and fast internet connection available can help you navigate with GPS, check out the names of all the flora you’re encountering, or reach help in case of emergency.

Sighișoara and Killarney had the lowest median multi-server latency on this list at 24 ms and 25 ms, respectively. Digne had the highest latency at 36 ms.

Regardless of where you travel, mobile internet performance will affect your trip. We hope this list prepares you for the getaway you want. If we missed your favorite European vacation destination, take a Speedtest® on Android or iOS to show off your speeds and tweet us your suggestions for next year’s list or share your ideas via this Google form.

Ookla retains ownership of this article including all of the intellectual property rights, data, content graphs and analysis. This article may not be quoted, reproduced, distributed or published for any commercial purpose without prior consent. Members of the press and others using the findings in this article for non-commercial purposes are welcome to publicly share and link to report information with attribution to Ookla.

| August 1, 2023

European Vacation: Your Guide to Roam Like at Home Performance this Summer

Summer is here and with it the August vacation season that most of Europe has been waiting for. We’re here with fresh data from Speedtest Intelligence® to help you know in advance if your phone will be a help or a hindrance on your travels. We’ve examined results from Android devices in the European Union (EU) and the United Kingdom (U.K.) during Q2 2023 and included data on 5G performance to see if “Roam Like at Home” is living up to its promise.

5G boosts European roaming speeds but latency varies 

Speed and latency are two important indicators of online performance. Speed will have a greater effect on streaming content while latency will affect gaming and video chatting. Both come into play while browsing online maps for that hot new gelato place your friends told you about. 

While the EU extended “Roam Like at Home” regulations until 2032, our previous analyses demonstrated that mobile speeds are usually slower when roaming than when exploring your home country. The actual speeds vary dramatically based on roaming agreements between mobile operators, something you can’t really control unless you’re prepared to do the research then shop for a whole new plan before your trip. What you can control is whether you spring for 5G before your big trip. The data below represents the local speeds and multi-server latency for each country as well as those experienced by residents of the named country while roaming in the EU or the U.K. during Q2 2023.

Roaming speeds can’t live up to local performance

Median Mobile Roaming Performance in Europe
Speedtest Intelligence | Q2 2023
Country Local Download (Mbps) Roaming Download (Mbps) Local 5G Download (Mbps) Roaming 5G Download (Mbps)
Austria 59.28 42.77 161.00 80.51
Belgium 48.00 59.86 157.23 124.64
Bulgaria 78.27 48.97 252.75 93.24
Croatia 73.65 47.86 184.29 124.38
Cyprus 56.93 40.83 197.22 64.24
Czechia 46.50 31.96 104.36 72.26
Denmark 118.48 51.74 206.95 115.82
Estonia 64.99 77.51 * *
Finland 78.00 53.43 217.13 106.54
France 61.64 43.46 187.42 95.56
Germany 46.30 39.54 114.07 84.27
Greece 57.41 66.17 143.26 153.28
Hungary 40.44 48.28 85.12 132.98
Ireland 34.49 36.10 98.70 85.38
Italy 36.97 37.68 130.85 99.38
Latvia 59.73 65.13 220.51 146.15
Lithuania 64.70 53.04 * *
Luxembourg 74.86 46.88 * *
Malta 44.56 48.11 109.97 110.80
Netherlands 96.77 37.61 128.04 87.84
Poland 42.14 34.23 78.82 99.51
Portugal 57.86 39.91 212.95 79.88
Romania 43.34 59.59 153.35 99.84
Slovakia 43.16 41.53 139.53 85.16
Slovenia 52.73 49.86 145.83 95.50
Spain 32.33 35.77 85.75 116.48
Sweden 84.00 51.24 160.93 129.43
United Kingdom 40.74 48.06 108.74 98.92

Although EU residents can roam call, text, and surf without additional charges, a drop in speed is an issue while roaming according to Q2 2023 data. Residents from 17 countries showed faster local download speeds than roaming speeds when considering results over all technologies during Q2 2023. The 11 exceptions were Romania (which was much faster roaming), Belgium, Hungary, Estonia, the U.K, Greece, and Spain, which all showed faster roaming speeds, and Latvia, Malta, Ireland, and Italy which showed only slightly improved speeds.  

While roaming speeds varied widely based on country of origin, every country on this list saw much higher median download speeds when roaming on 5G than roaming on all technologies. Despite this uplift, 20 countries showed faster local 5G download speeds than roaming 5G speeds during Q2 2023. The exceptions were Hungary, Spain, and Poland, which all saw faster 5G roaming than locally, while Greece had marginally better 5G roaming than at home, and people from Malta didn’t really see any major difference. Estonia, Lithuania, and Luxembourg did not have enough 5G samples to qualify for analysis.

Latency suffers awfully when roaming

Median Mobile Roaming Latency in Europe
Speedtest Intelligence | Q2 2023
Country Local Multi-server Latency (ms) Roaming Multi-server Latency (ms) Local 5G Multi-server Latency (ms) 5G Multi-server Latency (ms)
Austria 32.19 91.24 30.96 111.08
Belgium 36.51 84.96 31.89 67.61
Bulgaria 31.72 125.60 26.41 124.63
Croatia 39.03 85.25 35.96 80.37
Cyprus 27.90 200.18 23.52 184.68
Czechia 34.72 80.18 30.77 78.72
Denmark 29.47 94.77 28.08 81.85
Estonia 33.10 87.00 * *
Finland 33.67 102.84 32.16 99.14
France 46.97 92.61 44.39 87.49
Germany 41.78 87.19 39.07 77.57
Greece 38.16 137.29 34.63 132.91
Hungary 36.27 85.39 35.06 77.26
Ireland 36.21 116.62 31.70 118.47
Italy 50.87 100.20 49.96 93.87
Latvia 29.88 101.91 26.28 94.70
Lithuania 34.03 107.79 * *
Luxembourg 33.45 67.70 * *
Malta 47.44 146.57 38.69 135.43
Netherlands 33.24 83.25 31.17 79.81
Poland 42.41 108.69 40.25 100.36
Portugal 35.98 123.05 31.62 126.54
Romania 40.65 122.91 34.22 121.21
Slovakia 30.47 80.28 26.39 70.96
Slovenia 30.61 76.68 27.70 75.27
Spain 51.53 112.81 47.11 102.94
Sweden 37.52 114.69 32.97 99.48
United Kingdom 50.45 111.01 46.04 107.59

Residents of every country surveyed had a much higher multi-server latency when roaming during Q2 2023. This is because roaming signals are routed through a user’s home network, making latency a significant issue for Europeans when traveling. The difference was smallest in Italy and France where locals had about a 97% higher latency when roaming compared to at home. On the other end of the scale, residents of Cyprus saw over a 615% higher latency while roaming compared to at home. A high latency means a long response time for any request you send over the internet, perhaps adding more frustration to your vacation than you would want.

The results were similar over 5G with Italy showing the smallest difference between latency while roaming and at home (about 88% greater) and Cyprus having the largest difference (about 685%). Surprisingly, 5G did not reliably improve multi-server latency. 

What this data tells you is that it’s worth upgrading to 5G before a trip if speed is your main concern. Whether 5G will help you with your latency will depend heavily on which country you are traveling from. Regardless, you should expect a high latency while roaming. Plan ahead accordingly.

Outbound roaming speeds vary dramatically

As discussed above, roaming speeds depend heavily on where you are traveling from, where you are traveling to, and what agreements your home mobile operator has with operators in the country you’re visiting. That said, it’s fun to look at what’s possible, so we looked at the very best and very worst roaming speeds in Europe during Q2 2023.

Fastest roaming speeds in Europe

Customers from Italy roaming in Portugal saw one of the fastest median roaming download speeds over 5G in all of Europe during Q2 2023 at 317.94 Mbps. Estonians roaming in Finland saw a 278.69 Mbps median 5G download speed, and Finns in Sweden experienced a median 5G download of 252.57 Mbps. 

Looking at the highest results from all technologies combined, Latvians roaming in Finland experienced a median download speed of 137.49 Mbps, while Greeks saw median download speeds of 129.75 while roaming in Bulgaria and 125.83 Mbps while roaming in Austria.

Slowest roaming speeds in Europe

On the other end of the scale, Slovakian visitors to Poland had one of the slowest median download speeds over all technology while roaming during the same time period at 10.82 Mbps. Polish roamers saw a median download speed of 13.27 Mbps in the U.K. and 14.78 Mbps in Romania. Ten of the 20 slowest roaming speeds on our country-by-country list for all technologies were for Europeans roaming in the U.K. This means that travelers going to the U.K are not only seeing poorer performance, they could also be paying more for the privilege as they do not benefit from “Roam Like at Home” regulations.

Germans in Italy had the slowest median 5G download speed on our list during Q2 2023 at 33.64 Mbps. Austrians in the U.K. saw a median download speed over 5G of 41.57 Mbps, and Portuguese roamers in Spain experienced a median download speed over 5G of 44.18 Mbps.

Whether you choose to roam, pick up a local SIM or eSIM, or simply spend less time online, we hope this information helps you make the most of your vacation. If you have an extra minute between activities, take a Speedtest® to see how your performance compares. 

Ookla retains ownership of this article including all of the intellectual property rights, data, content graphs and analysis. This article may not be quoted, reproduced, distributed or published for any commercial purpose without prior consent. Members of the press and others using the findings in this article for non-commercial purposes are welcome to publicly share and link to report information with attribution to Ookla.

| February 15, 2023

Are 5G Networks Meeting Consumers’ Expectations?

Key messages

  • In-market 5G performance varies widely. Reviewing the top 10% and worst 10% of Ookla® Speedtest Intelligence® samples reveals significant variance in the consumer experience on today’s 5G networks, with 5G speeds peaking at over 1 Gbps for the top 10% of users in the U.A.E on average, but falling to below 20 Mbps for the lower 10% in Norway, the U.S., Japan, Germany, and Spain.
  • Median 5G performance is declining in many early launch 5G markets. While understandable as 5G adoption grows and users in more remote locations access 5G, declining median download speeds also point to investment and deployment challenges in some markets. At the same time, many of these markets are facing economic headwinds, placing more emphasis than ever on cost control. As a result, operators must carefully balance network investment priorities.
  • 5G Net Promoter Scores (NPS) significantly higher than 4G LTE in most markets, but waning. With the exception of Sweden and Qatar, all the early launch 5G markets in our analysis saw 5G NPS fall year-over-year. Operators’ 5G NPS still trade at a premium compared to 4G, and while performance is just one part of the equation, operators should take care to build on the positive sentiment that 5G has brought to date.

Despite impressive headline speeds, 5G performance varies a lot

Median 5G performance allows us to gauge the midpoint of user experience on 5G networks, however it doesn’t paint the full picture. While headline 5G speeds impress, Speedtest Intelligence data lays bare the ups and downs of 5G performance for consumers, even in early launch, advanced 5G markets. We recently looked at 5G network performance over high frequency (mmW) bands, painting a view of the true potential of 5G networks. However, if we look at performance on today’s 5G networks, looking beyond the median at the range of performance between users in the top 10% and those in the lower 10%, Speedtest Intelligence data reveals huge variance in the performance users experience.

Chart of psread of 5g performance, top 10% of samples versus median and lower 10%

The U.A.E. was the fastest 5G market in our analysis, based on median download performance of 545.53 Mbps in December 2022, followed by South Korea and Qatar. However, the top 10% of users in the U.A.E. recorded speeds of at least 1,266.49 Mbps on average, while the lowest 10% of users experienced speeds of 127.52 Mbps or slower on average. At the other end of the scale, Spain recorded a median 5G speed of 94.14 Mbps, but also demonstrated wide variance between the top 10% of samples at 537.95 Mbps or faster and the lowest 10% with 10.67 Mbps or less.

Based on many of the marketing messages around 5G, consumers are led to expect a big bang change in performance. However, with 5G operating over a greater range of spectrum bands than previous generations, including high frequency spectrum which has relatively poorer propagation, it’s understandable that 5G performance will vary more than previous generations of mobile network technology.

5G markets set to face performance challenges during 2023

While globally 5G speeds have remained stable, for many of the markets in our analysis, median 5G download speeds have fallen over the past year. The U.S. was the main outlier, recording the strongest uplift in 5G performance as T-Mobile continued to drive home its performance advantage in the market, while Verizon’s performance improved early in 2022 through its deployment of 5G in C-band spectrum. This trend is likely to continue in 2023 in the U.S., as more C-band spectrum is made available. However, the picture remains concerning for a number of other 5G markets, particularly those where median 5G speeds are at the lower end of the spectrum.

Chart of Year-over-Year change in median 5G download performance

In some markets, 5G was initially priced at a premium to 4G, with operators focused on driving incremental returns on the new network technology. However, operators have been increasingly opening up 5G access by removing incremental costs for consumers and adding prepaid plans too. As 5G adoption scales, it places more strain on the new networks. The challenge for many of these markets is that network performance is likely to degrade further unless network densification picks up. 

For network operators, this investment imperative is occuring amidst macroeconomic headwinds, which are driving up operating costs and putting pressure on consumer and enterprise spend. In addition, there remain challenges in deploying additional 5G cell sites in dense urban areas where demand is strongest, while in some markets EMF limits and other regulations can limit the deployment of high-capacity 5G sites.

Degrading 5G performance impacts consumer sentiment

Net Promoter Score (NPS) from Speedtest Intelligence paints a largely positive picture of current 5G networks. NPS is a key performance indicator of customer experience, categorizing users into Detractors (score 0-6), Passives (score 7-8), and Promoters (score 9-10), with the NPS representing the percentage of Promoters minus the percent of Detractors, displayed in the range from -100 to 100. Across the markets we analyzed, 5G users on average rated their network operator with NPS scores that were universally higher than those for 4G LTE users. However, consumer sentiment for users on 5G networks is beginning to shift, with NPS scores falling, coinciding with lower median 5G performance in many of the markets we analyzed.

Chart of 5G uplift in Net Promoter Scores vs. 4G LTE

Declining performance levels will be a factor driving NPS down for some 5G users. It’s also important to remember that as 5G scales in many of these early launch markets, the profile of 5G users is also changing from predominantly urban-based users, to more of a mix of urban, suburban, and rural users, which brings additional coverage and performance challenges for network operators. We plan to examine the relationship between 5G performance and spectrum in an up-coming content piece. Please get in touch if you’d like to learn more about Speedtest Intelligence data.

Ookla retains ownership of this article including all of the intellectual property rights, data, content graphs and analysis. This article may not be quoted, reproduced, distributed or published for any commercial purpose without prior consent. Members of the press and others using the findings in this article for non-commercial purposes are welcome to publicly share and link to report information with attribution to Ookla.
| February 16, 2023

European Commission Uses Ookla® Data to Demonstrate Territorial Disparities and the Digital Divide in the EU

The characteristics of places might not define the identity of people living there, but they affect the daily life of every citizen and can prevent them from reaching their full potential and the best life. Persisting territorial disparities, related to phenomena such as depopulation or limited access to services, can become even more visible by observing places rather than individuals. In fact, growing territorial inequality, further exacerbated by the COVID-19 pandemic, limits on people’s lifestyle and life choices, and creates a feeling of being left behind.

The Joint Research Centre of the European Commission recently published a report focused on understanding and identifying territorial disparities and challenges in the EU across a variety of sectors, including access to broadband and the performance of the digital connection, using the Speedtest® by Ookla® Global Fixed and Mobile Network Performance data for Q4 2020. A full comprehension of these challenges and their interlinkages is essential to produce evidence to improve policies, especially for the benefit of those living in vulnerable conditions, in line with the principle of leaving no place and no one behind.

Key findings

High-speed broadband increasingly represents an essential infrastructure to drive the economic and social development of territories. Therefore, the lack of broadband network or poor access to a high-speed connection might cause significant disparities among places and citizens and leave some areas behind in terms of access to services and opportunities, diminishing the quality of life of residents. The connectivity gap, often recognized as an urban-rural digital divide, represents an important challenge to face for some countries and policy makers and may require a joint effort by both public and private initiatives.

Results show that significant differences exist in network speed across the EU-27 countries. Territorial disparities are even more relevant, with most Member States in urban areas enjoying easy access to the highest fixed broadband available (> 100 Mbps), whereas in rural areas a significant percentage of residents have access to an average speed below the minimum standard of 30 Mbps. Only very few countries show access to over 100 Mbps broadband for rural populations (Denmark, Sweden, the Netherlands, Luxembourg).

Regarding mobile broadband, the average speed is generally lower than fixed broadband in all countries, with only a few areas having more than 100 Mbps average speed. Interestingly, the Alpine region across France, Italy and Austria appears to have better connectivity with mobile broadband (over 30 Mbps) than with fixed broadband (under 30 Mbps). The same pattern can be observed in Central Italy and Sardinia, Croatia, and partially in Greece.

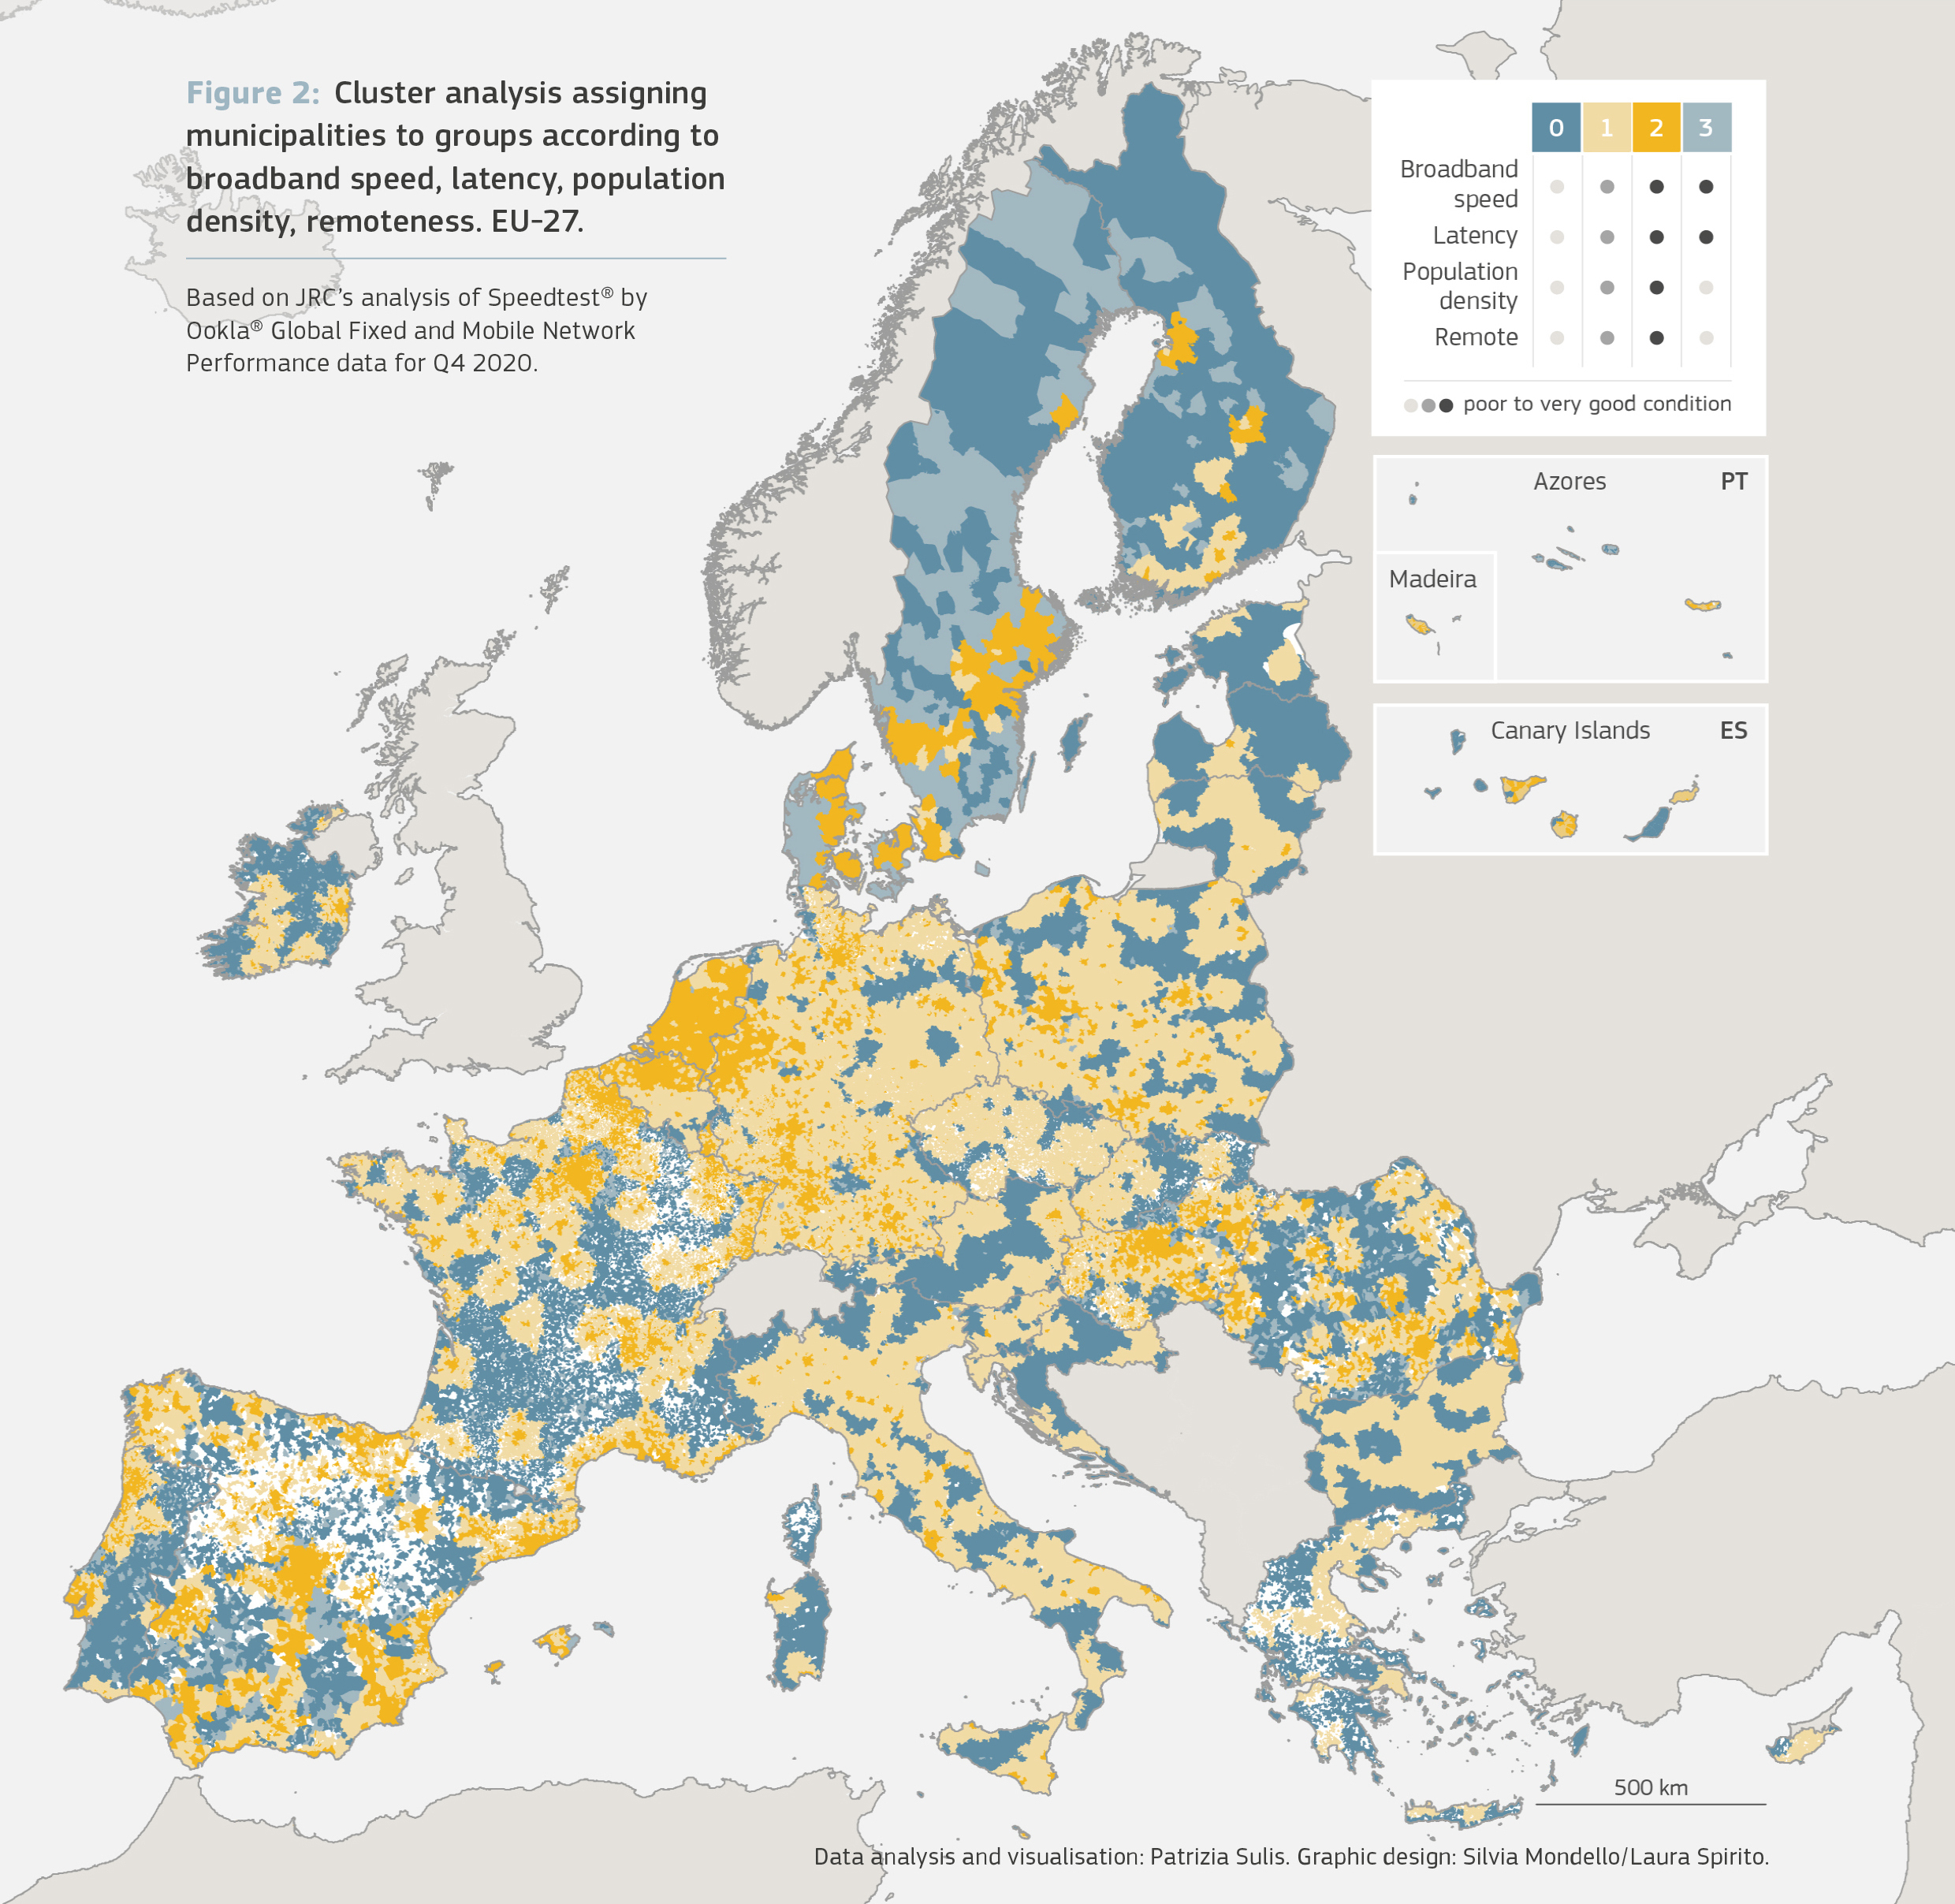
To strengthen the evidence of such urban-rural digital divide, the spatial patterns of access to broadband were combined with the population density and the classification of degree of urbanization of municipalities in cities, towns and rural areas (see Figure 01). Results confirm that urban areas present the highest speed in broadband connection, revealing how the areas already most connected in terms of physical networks (i.e., with roads and railways) are also the most connected from the digital point of view. Access to a good broadband connection is most problematic in remote municipalities (with 45 minutes or more from the nearest city by drive), where the average speed is significantly lower than the national averages, especially in countries such as Belgium, Spain, France, and Portugal.

To explore the urban-rural digital divide further, the analysis employed Machine Learning to identify patterns of similarities in terms of vulnerabilities across all areas, regardless of their degree of urbanization, considering the performance of the broadband infrastructure, the population distribution and the remoteness classification of all areas. The areas (belonging to group 0 in Figure 2) are characterized by low speed, high latency, low population density, remoteness, and are identified as the most vulnerable places. However, this analysis also showed that the bad performance of broadband networks is not limited to rural areas. This means that the digital divide is not merely a matter of urban-rural, but mostly a matter of cities versus non-cities: places that would not be considered as disconnected from the physical perspective (not remote areas, but towns close to cities) can still be disconnected from the broadband perspective.

Digitalization can be an opportunity only if its rollout is quick enough to enable rural businesses to remain competitive. However, it is useless without a parallel development of digital literacy and skills for residents in rural areas. Furthermore, digital connectivity is only one player in the game, and it cannot alone overturn the depopulation trends and the other vulnerabilities affecting rural areas.

Without policy support, a lack of or poor access to high-speed broadband might leave some areas behind. Access to broadband and data might help to foster new business and economic activities, especially in vulnerable areas such as rural regions. Exploiting the potential that connectivity and digitalization represent for education and training, cooperation and networking, access to services and markets, can make these areas more attractive to people and businesses.

Cohesion Policy will support the implementation of the EU’s digital agenda. In particular, European Regional and Development Fund investments will focus on digitalization of services for businesses and citizens and rollout of the high-speed broadband. The support will go where it is most needed, i.e. areas where there is a weak take-up of digital technologies or no, or very slow, or very expensive, broadband access or where there is not enough commercial potential to attract private investors.

To read more about this work, the full report is available here.

We are grateful to Patrizia Sulis for her work with our data within the European Commission’s report and guidance in composing this article. For more information, please contact Patrizia Sulis – Scientific Officer – Joint Research Centre, European Commission.

Ookla retains ownership of this article including all of the intellectual property rights, data, content graphs and analysis. This article may not be quoted, reproduced, distributed or published for any commercial purpose without prior consent. Members of the press and others using the findings in this article for non-commercial purposes are welcome to publicly share and link to report information with attribution to Ookla.
| December 18, 2022

Stable and Expanding: The State of Worldwide 5G in 2022


5G is no longer a new technology, however, consumers in many countries are still waiting to see the full benefits of 5G (or even to connect to 5G at all). We examined Speedtest Intelligence® data from Q3 2022 Speedtest® results to see how 5G performance has changed since last year, where download speeds are the fastest at the country level, and how satellite technologies are offering additional options to connect. We also looked at countries that don’t yet have 5G to understand where consumers are seeing improvements in 4G LTE access.

5G speeds were stable at the global level

Graphic of 5G median speed performance worldwide.

In 2021, we discussed how an expansion of 5G access led to a decline in overall speed at the global level. This year showed a stabilization in overall speed, even as 5G access broadened, with a median global 5G download speed of 168.27 Mbps in Q3 2022 as compared to 166.13 Mbps in Q3 2021. Median upload speed over 5G slowed slightly to 18.71 Mbps (from 21.08 Mbps) during the same period. According to the Ookla® 5G Map™, there were 127,509 5G deployments in 128 countries as of November 30, 2022, compared to 85,602 in 112 countries the year prior.

South Korea and the United Arab Emirates led countries for 5G speeds

Chart of fastest countries for median 5G download speed

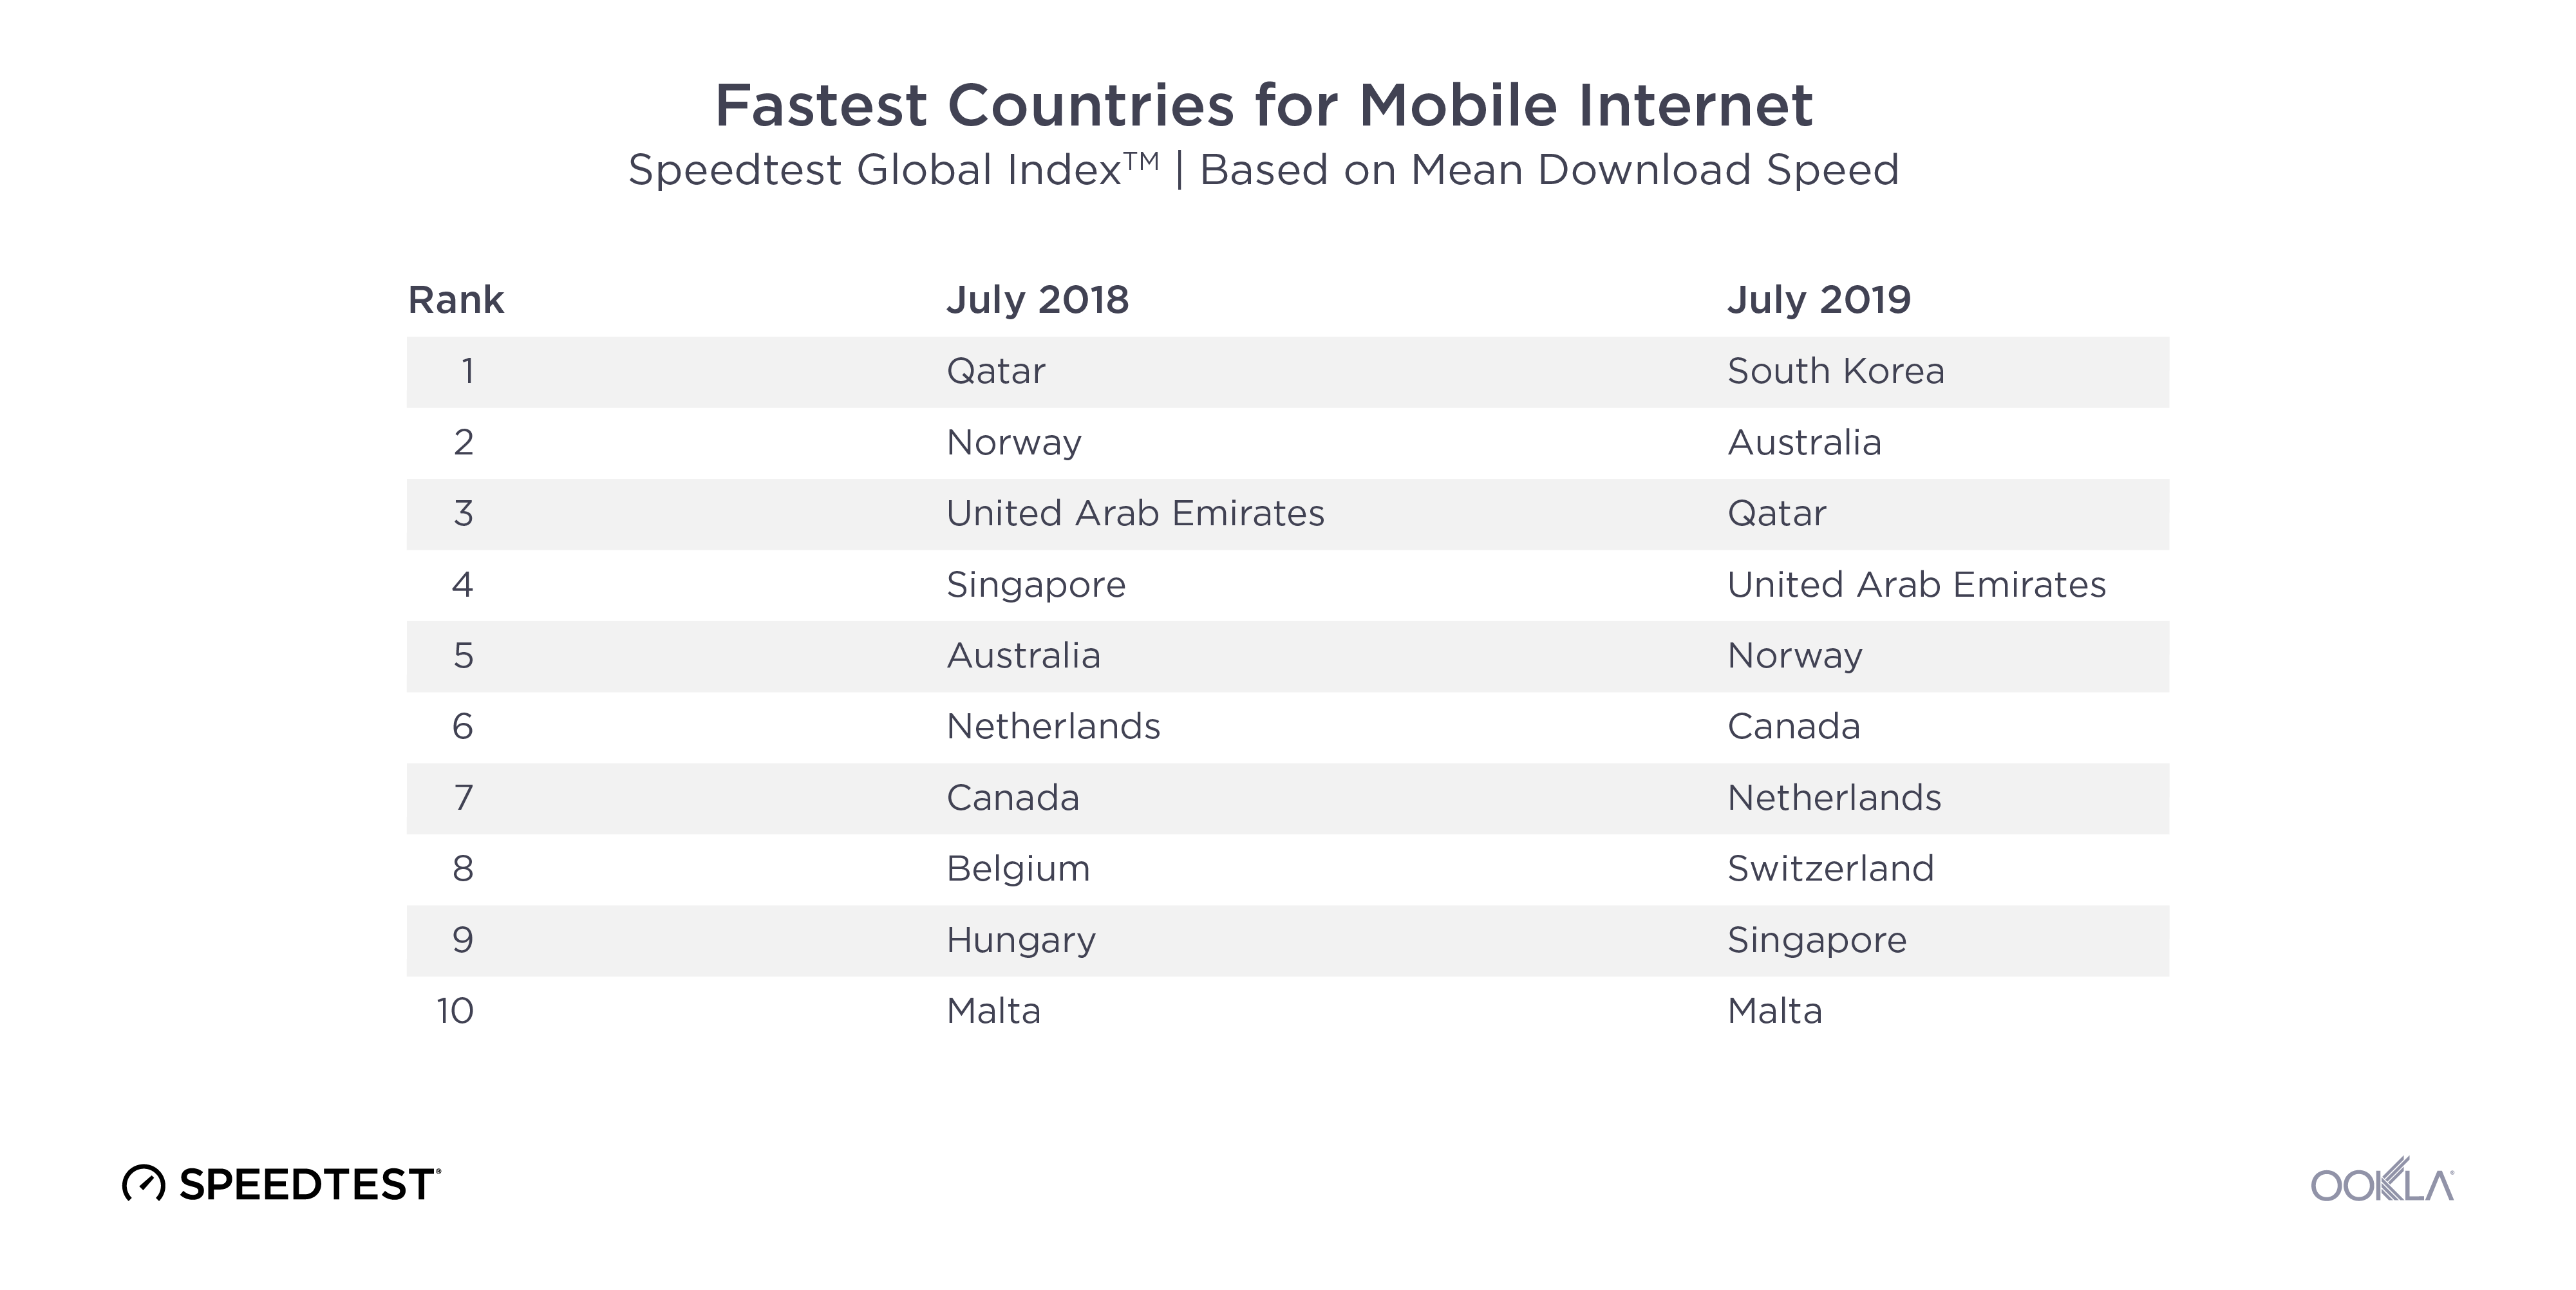
South Korea and the U.A.E. had the fastest median download speed over 5G at 516.15 Mbps and 511.70 Mbps, respectively, during Q3 2022, leading a top 10 list that included Bulgaria, Qatar, Saudi Arabia, Singapore, Kuwait, New Zealand, Bahrain, and Brazil. Bulgaria, Singapore, Bahrain, and Brazil were new to the top 10 in 2022, while Norway, Sweden, China, and Taiwan fell out of the top 10.

Satellite became more accessible but performance slowed

2022 saw a proliferation of fast, low-earth orbit (LEO) satellite internet from Starlink across the world. Q1 2022 saw Starlink speeds increase year over year in Canada and the U.S., with Starlink in Mexico having the fastest satellite internet in North America, Starlink in Lithuania the fastest in Europe, Starlink in Chile the fastest in South America, and Starlink in Australia the fastest in Oceania.

Q2 2022 saw Starlink speeds decrease in Canada, France, Germany, New Zealand, the U.K., and the U.S. from Q1 2022 as Starlink crossed the 400,000 user threshold across the world. Starlink in Puerto Rico debuted as the fastest satellite provider in North America. Starlink outperformed fixed broadband averages in 16 European countries. Starlink in Brazil had the fastest satellite speeds in South America. And Starlink in New Zealand was the fastest satellite provider in Oceania.

During Q3 2022, Starlink performance dipped once again from Q2 2022 in Canada and the U.S., while remaining about the same in Chile. Starlink in Puerto Rico and the U.S. Virgin Islands had the fastest satellite speeds in North America, while Starlink in Brazil again was the fastest satellite provider in South America.

With Viasat, HughesNet, and Project Kuiper set to launch huge LEO constellations in 2023, consumers around the world are poised to have more fast satellite internet options, particularly as the European Commission makes its own play for a constellation and Eutelsat and OneWeb potentially merging.

5G Availability points to on-going challenges

5G Availability measures the proportion of Speedtest users with 5G-capable handsets, who spend a majority of time connected to 5G networks. It’s therefore a function of 5G coverage and adoption. We see wide disparity in 5G Availability among markets worldwide, with for example the U.S. recording 54.3% in Q3 2022, well ahead of markets such as Sweden and the U.A.E., with 8.6% and 8.3% respectively.

Chart of 5G availability in select markets, based on users with 5G-capable handsets

Critical levers for mobile operators to increase 5G Availability include:

  • Increasing 5G coverage by deploying additional base stations
  • Obtaining access to, or refarming, sub-GHz spectrum, to help broaden 5G coverage, as sub-GHz spectrum has superior propagation properties than that of higher frequency spectrum bands.
  • Encouraging 5G adoption among users with 5G-capable handsets.

Speedtest Intelligence points to 5G adoption challenges in some markets, with 5G Availability dropping in Bulgaria, South Korea, the Netherlands, and the U.A.E. As more users acquire 5G-capable devices, operators need to balance their pricing models to ensure users have sufficient incentives to purchase a 5G tariff.

Chart of percentage change in 5G availability in select markets, based on users with 5G-capable handsets

Where 5G continues to fail to reach

Speedtest Intelligence showed 29 countries in the world where more than 20% of samples were from 2G and 3G connections (combined) during Q3 2022 and met our statistical threshold to be included (down from 70 in Q3 2021). These are mostly countries where 5G is still aspirational for a majority of the population, which is being left behind technologically, having to rely on decades-old technologies that are only sufficient for basic voice and texting, social media, and navigation apps. We’re glad to see so many countries fall off this list, but having so many consumers on 2G and 3G also prevents mobile operators from making 4G and 5G networks more efficient. If operators and regulators are able to work to upgrade their users to 4G and higher, everyone will benefit.

Countries That Still Rely Heavily on 2G and 3G Connections
Speedtest IntelligenceⓇ | Q3 2021
Country 2G & 3G Samples
Central African Republic 76.2%
Turkmenistan 58.5%
Kiribati 51.6%
Micronesia 47.4%
Rwanda 41.1%
Belarus 39.7%
Equatorial Guinea 37.7%
Afghanistan 36.7%
Palestine 33.5%
Madagascar 27.5%
Sudan 27.4%
Lesotho 26.5%
South Sudan 26.3%
Benin 26.0%
Guinea 25.5%
Cape Verde 24.3%
Tonga 24.3%
Syria 23.4%
The Gambia 23.4%
Ghana 23.3%
Palau 22.9%
Niger 22.8%
Tajikistan 22.7%
Mozambique 22.4%
Guyana 21.8%
Togo 21.8%
Congo 21.1%
Moldova 20.8%
Saint Kitts and Nevis 20.0%

We were pleased to see the following countries come off the list from last year, having dropped below the 20% threshold: Algeria, Angola, Anguilla, Antigua and Barbuda, Armenia, Barbados, Bosnia and Herzegovina, Botswana, Burundi, Caribbean Netherlands, Cook Islands, Dominica, Ecuador, El Salvador, Ethiopia, Gabon, Grenada, Haiti, Honduras, Jamaica, Liberia, Mauritania, Namibia, Nigeria, Papua New Guinea, Saint Lucia, Saint Vincent and the Grenadines, Sierra Leone, Solomon Islands, Somalia, Suriname, Swaziland, Tanzania, Trinidad and Tobago, Uganda, Ukraine, Uzbekistan, Vanuatu, Venezuela, Yemen, Zambia, and Zimbabwe. While countries like Belarus, Cape Verde, Central African Republic, Guinea, Guyana, Madagascar, Palestine, Rwanda, South Sudan, Tajikistan, Togo, and Turkmenistan are still on this list, they have improved the percentage of their samples on these outmoded technologies when compared to last year by at least 10 points. Palestine improved by more than 50 points. 2G and 3G samples in Kiribati increased 3.2 points when comparing Q3 2022 to Q3 2021.

We’re glad to see performance levels normalize as 5G expands to more and more countries and access improves and we are optimistic that 2023 will bring further improvements. Keep track of how well your country is performing on Ookla’s Speedtest Global Index™ or track performance in thousands of cities worldwide with the Speedtest Performance Directory™.

Ookla retains ownership of this article including all of the intellectual property rights, data, content graphs and analysis. This article may not be quoted, reproduced, distributed or published for any commercial purpose without prior consent. Members of the press and others using the findings in this article for non-commercial purposes are welcome to publicly share and link to report information with attribution to Ookla.
| December 18, 2019

A Global Look at Mobile Modem Market Share and Device Performance

Analysts discuss the latest devices all the time, but rarely is enough attention paid to the phone’s real powerhouse — the modem. We were interested to see how market share for modem manufacturers divides up on a global level, so we investigated device data from Speedtest IntelligenceTM during Q3 2019. We also looked at how popular phones performed in different markets, including a look at 5G phones in 5G countries.

Global modem market share

Ookla_Global-Modem-Market-Share_1219-2

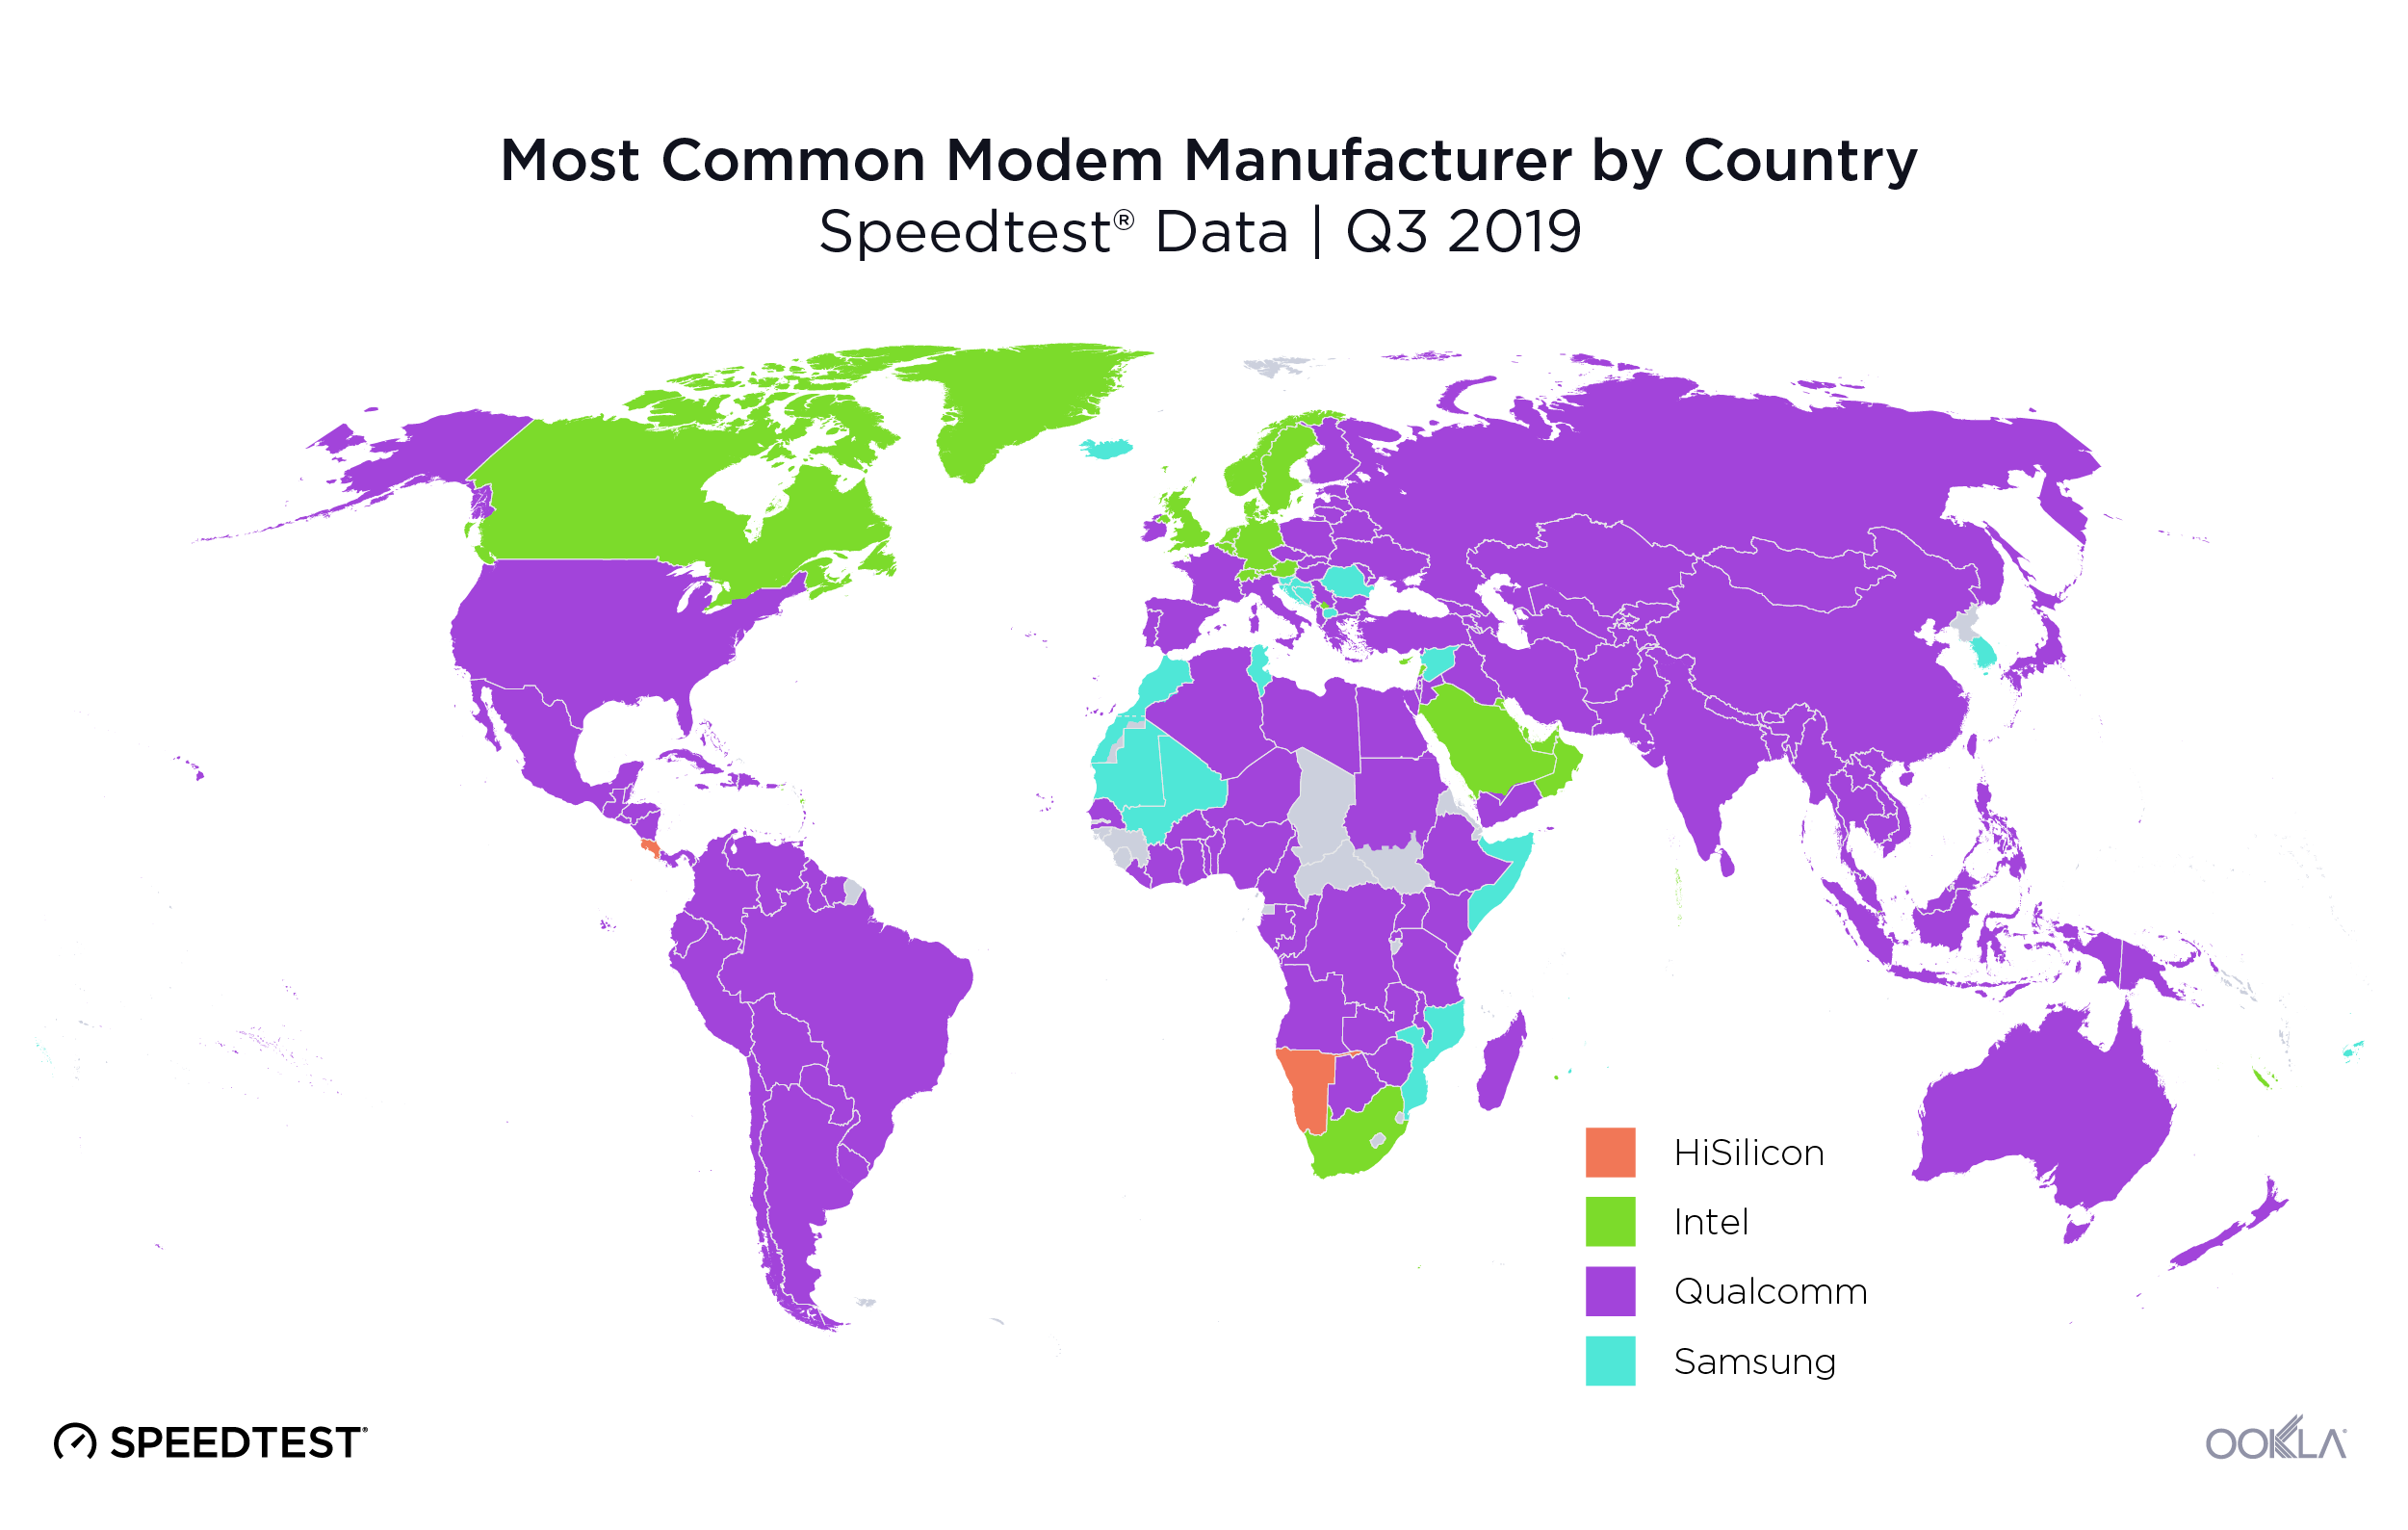
Speedtest data showed Qualcomm was the most common modem manufacturer in 133 countries during Q3 2019 — the highest market share was in Hong Kong with 73.6% of the devices analyzed showing Qualcomm modems. Qualcomm’s slimmest majority was in Botswana with 25.6% of devices analyzed showing Qualcomm modems.

This is not surprising as Qualcomm chipsets power many flagship devices sold around the world. In the U.S., virtually all Android OEMs use Qualcomm-powered chipsets. The latest Qualcomm Snapdragon 855+ mobile platform with Snapdragon X24 integrated LTE modem (up to 2Gbps) powers popular devices from Samsung, LG and OnePlus. It’s worth noting that Qualcomm has multi-year licensing deals with multiple OEMs based in China, namely Vivo, OPPO, Lenovo, Xiaomi and OnePlus, providing their complete modem-to-antenna solutions for optimal RF performance. This includes valuable RF Front End (RFFE) components such as power amplifiers, envelope trackers, RF switches, filters and antenna tuners.

These OEMs also have access to Qualcomm’s first and second generation 5G modems. As of right now, Qualcomm is also the only chipset manufacturer providing modem-to-antenna solutions for 5G millimeter wave (mmWave) deployments, providing all-in-one mmWave antenna modules that contain radio transceiver, RFFE and phased array antenna.

Intel was the most common modem manufacturer in 32 counties during Q3 2019. The highest percentage of devices with Intel modems was seen in Greenland at 55.6%. Intel’s slimmest majority was in South Africa with 28.6% of devices analyzed showing Intel modems. Intel’s main customer in the smartphone space is Apple. Starting in 2016, Apple began powering some iPhone devices with Intel’s flagship LTE chipsets, and since 2018, all iPhones have Intel’s cellular chipsets.

Samsung was the most common modem manufacturer in 16 countries during Q3 2019. South Korea had the highest percentage of devices with Samsung modems at 53.8%. Samsung’s slimmest majority was in Mozambique with 29.1% of devices analyzed powered by Samsung modems. Samsung’s Exynos LTE modem is seen in variants of Samsung’s Galaxy S and Note devices. Except in the Americas and China, most of Samsung’s flagship S10 and Note 10 devices around the world are powered by Samsung’s own Exynos 982x SoC (system on a chip), with an integrated LTE Category 20 modem capable of download speeds of up to 2 Gbps.

Speedtest data showed HiSilicon as the most common modem manufacturer in two countries during Q3 2019. In Costa Rica, 32.4% of devices analyzed showed HiSilicon modems, and in Namibia that number was 27.6%. HiSilicon is a semiconductor company based in Shenzhen and fully owned by Huawei. Huawei integrates its own flagship modem into its flagship P and Mate series devices. These devices have a large user base in Europe, the Middle East and Asia.

Device performance is affected by market factors

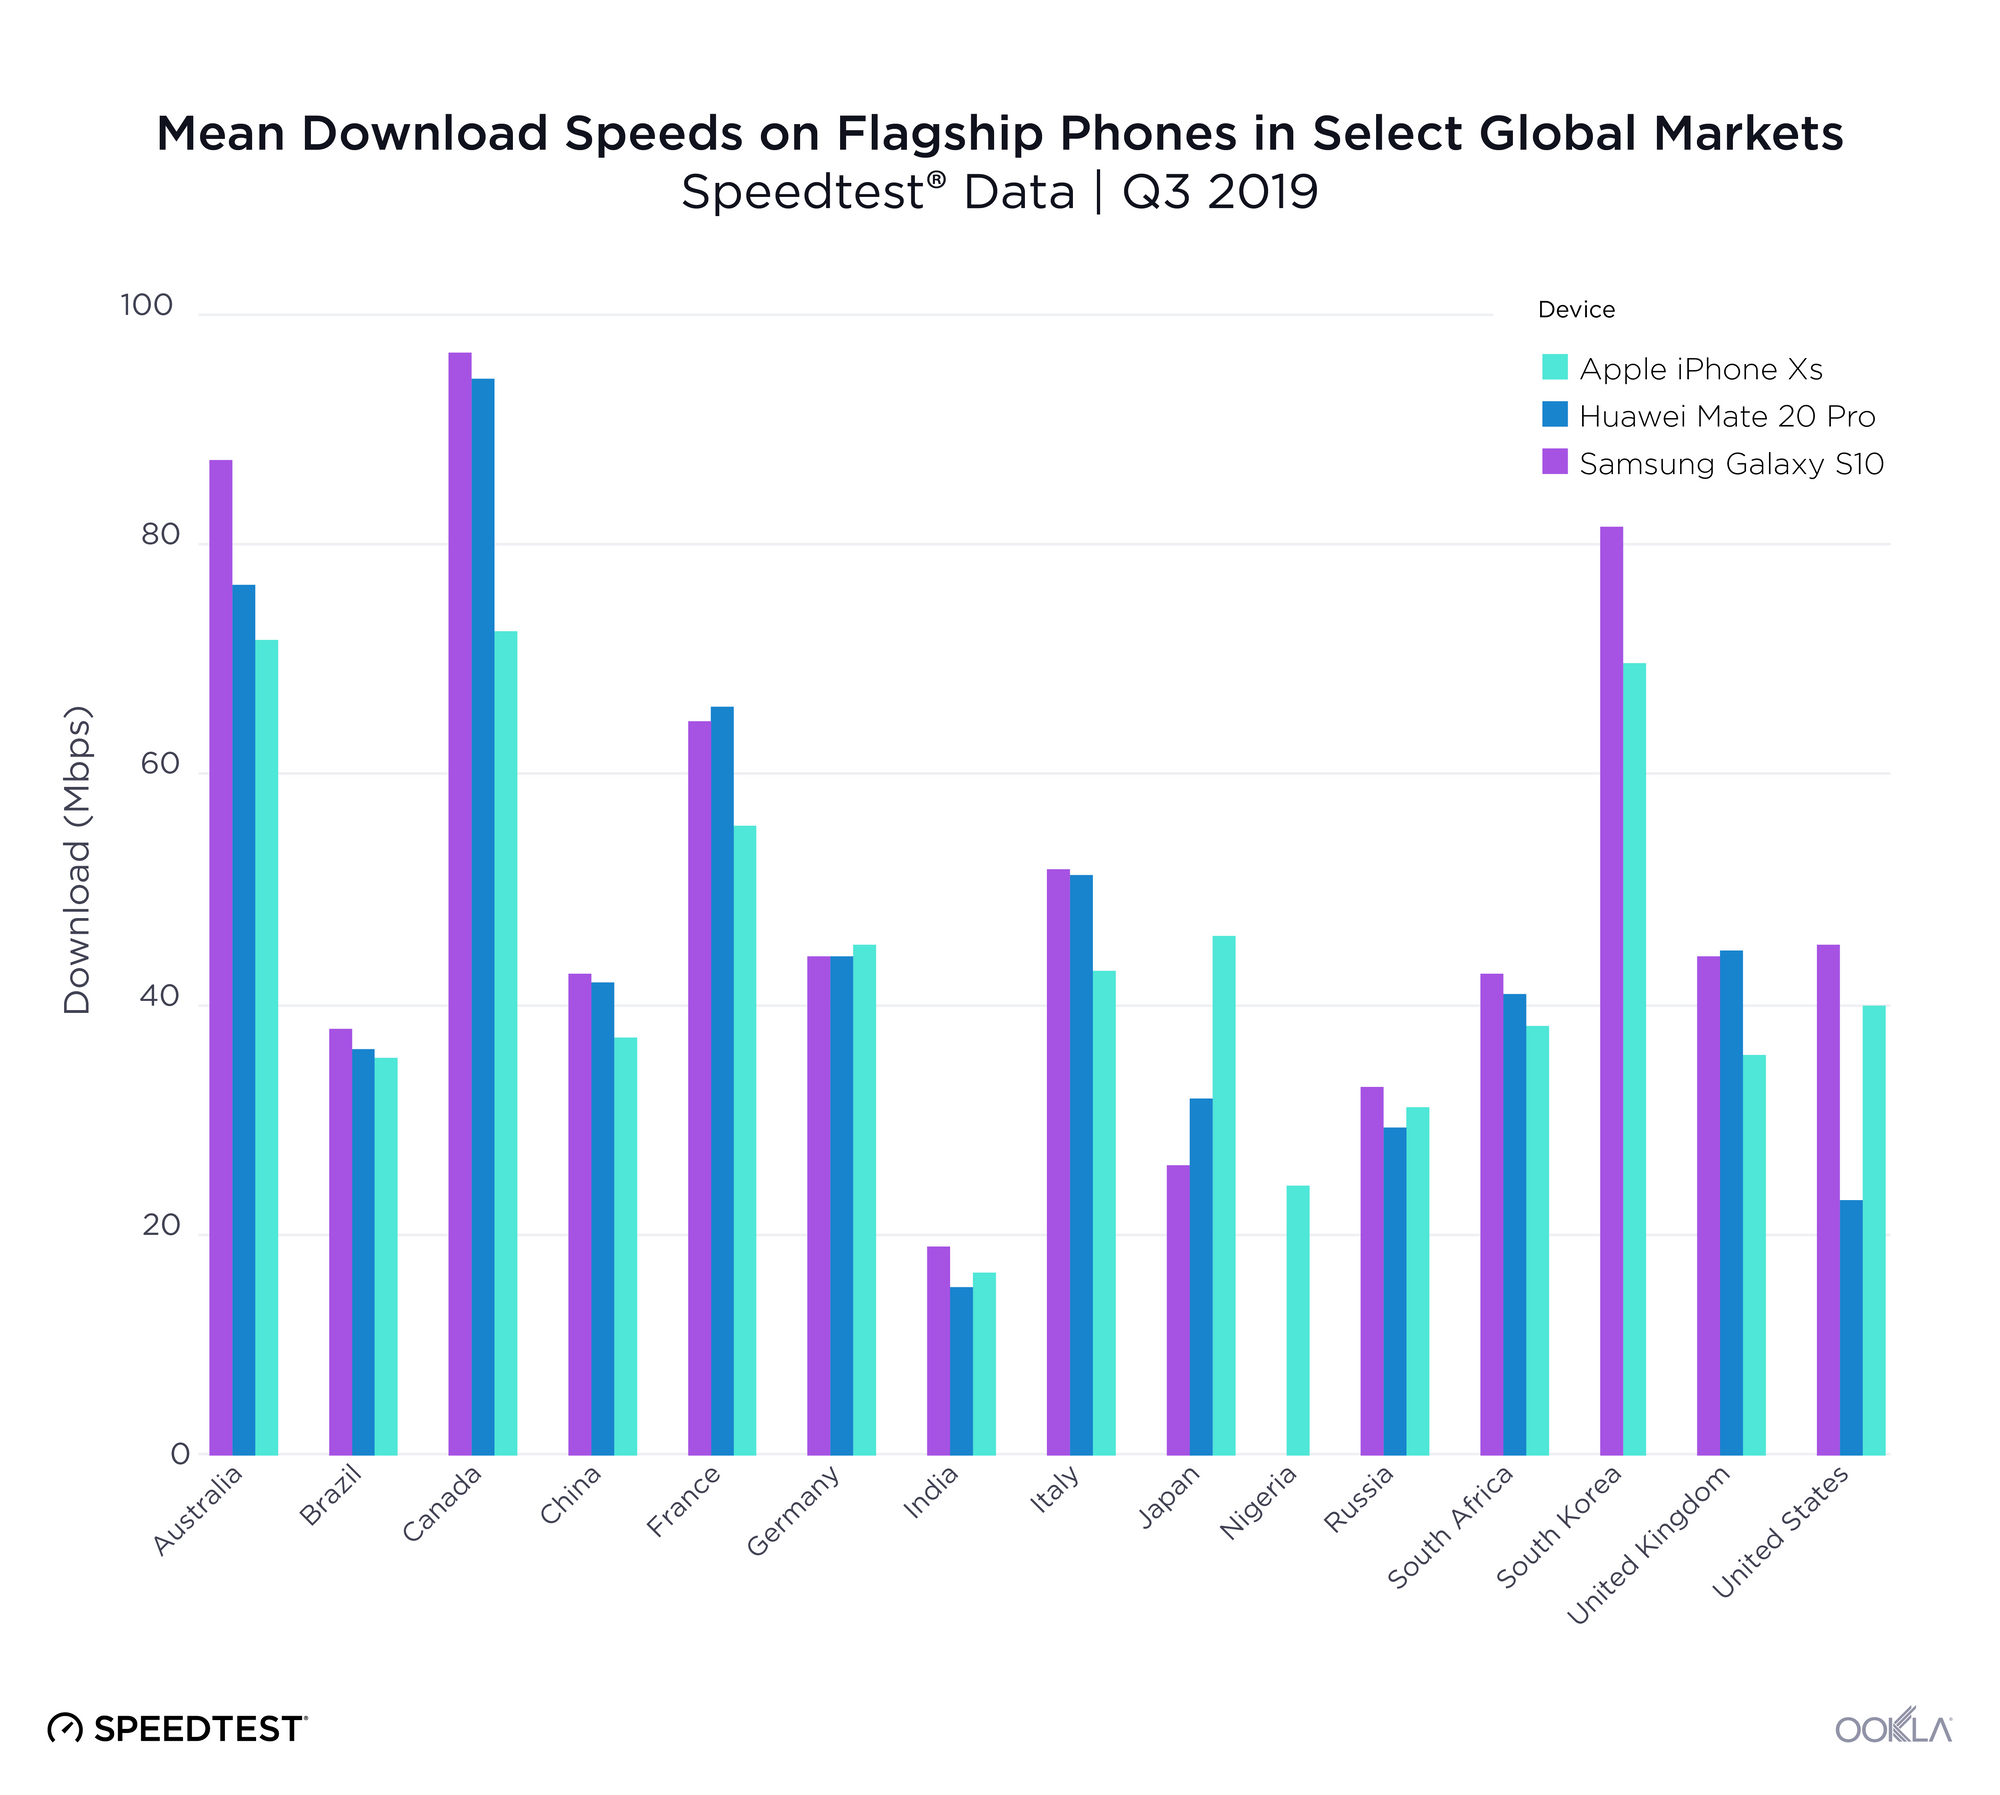
A phone’s performance is always going to depend on the conditions within its specific market. Factors affecting network performance can include: geography, cell site and population density, the amount of wireless spectrum deployed and the overall capabilities of user equipment seeded to market. Multiple factors can impact the performance of a device, including: varying degrees of RF transparency in the materials used for device chassis, variations in RF front-end and antenna design complexity and whether the baseband processor is more or less capable of handling network tasks. We used Speedtest data to analyze how three popular phones — the Apple iPhone Xs, the Huawei Mate 20 Pro and the Samsung Galaxy S10 — performed in specific markets around the world during Q3 2019. We excluded data from devices with fewer than 100 samples in a market during the period.

Mean-DL-Speeds-on-Flagship-Phones

The Samsung Galaxy S10 was the fastest of these three devices in all but five markets during Q3 2019. However, the mean download speed on the Galaxy S10 varied between 18.06 Mbps in India and 95.91 Mbps in Canada. The Huawei Mate 20 Pro showed the fastest mean download speed of these three devices in France and the U.K. during Q3 2019 and often placed second in the remaining markets on the list. Mean download speed on the Mate 20 Pro during Q3 2019 ranged from 14.57 Mbps in India to 93.66 Mbps in Canada.

Apple’s iPhone Xs was at a slight disadvantage in this comparison, as it came out in 2018 where the other devices debuted in 2019. Because the iPhone 11 was not fully seeded to markets in Q3 2019, we considered its predecessor, the iPhone Xs, in this analysis. The iPhone Xs showed the fastest mean download speed in Germany, Japan and Nigeria during Q3 2019. Mean download speeds on the iPhone Xs varied from 15.92 Mbps in India to 71.72 Mbps in Canada.

Device performance in 5G markets

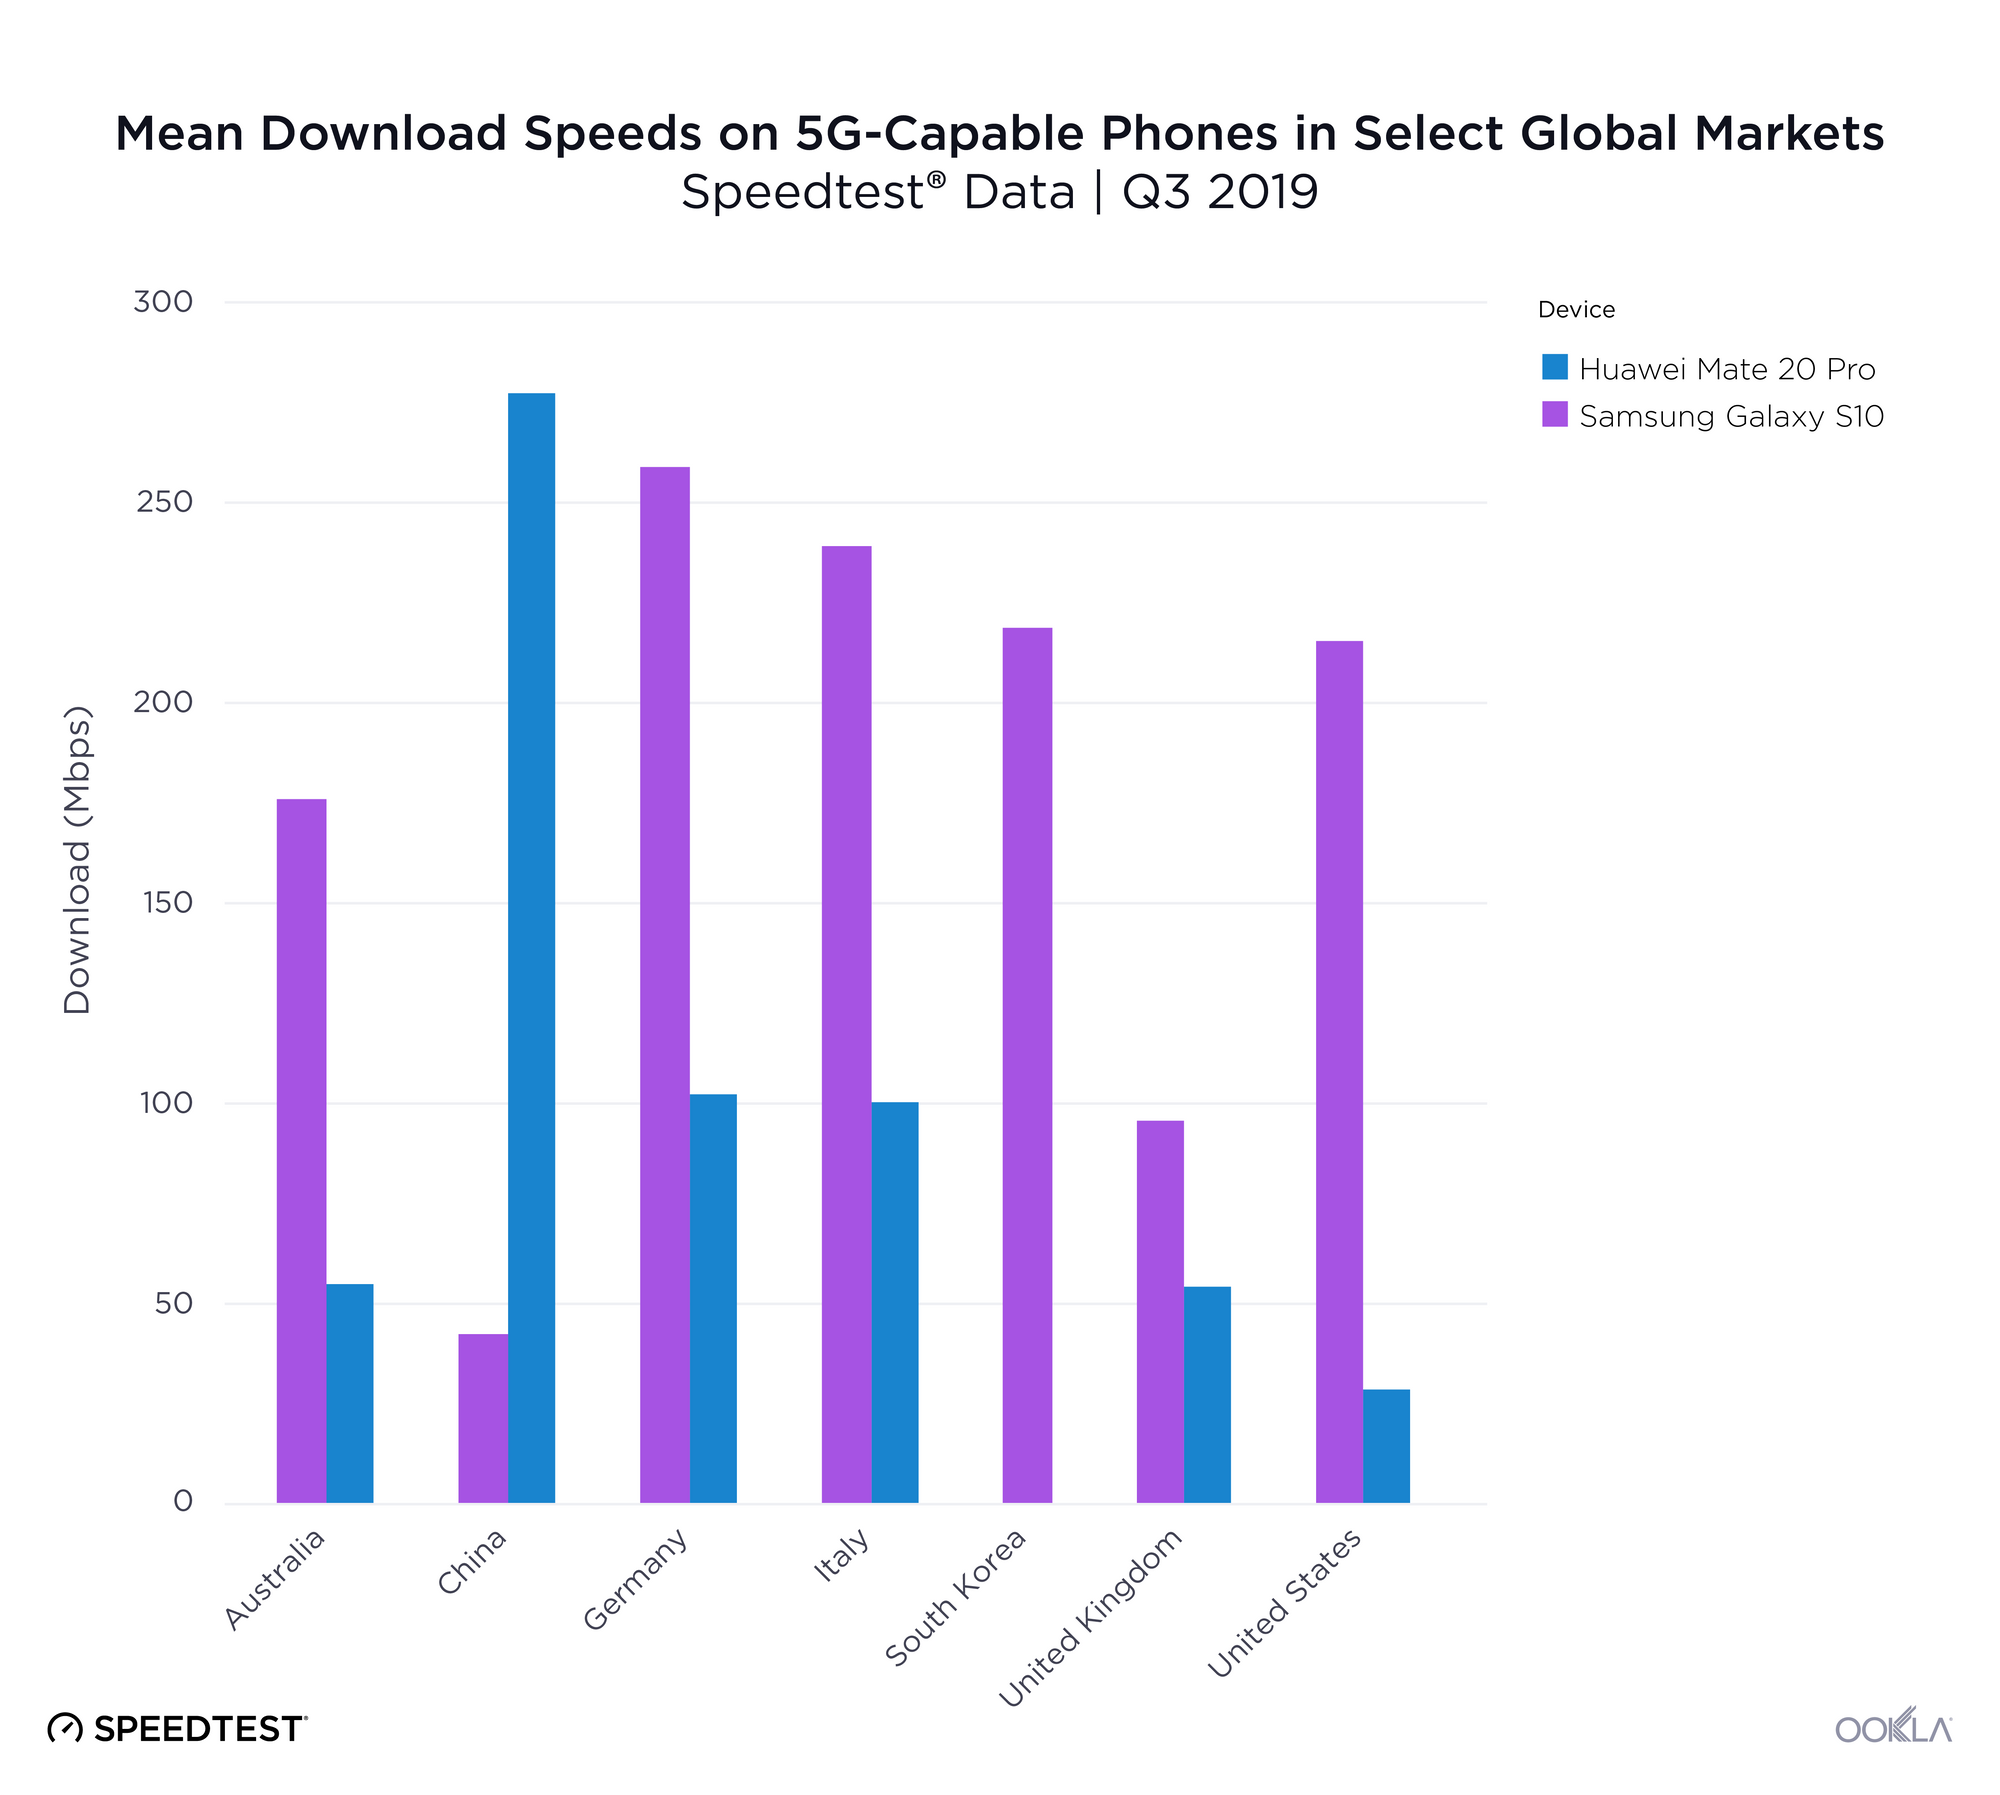
5G currently offers the pinnacle of mobile performance. We looked at 5G-capable devices in markets where 5G exists to see how download speeds compare. These results include Speedtest results on all technologies, not just 5G, which means averages also reflect consumers using 5G phones with a 4G connection.

Mean-DL-Speeds-on-5G-Phones

Both the Samsung Galaxy S10 5G and the Huawei Mate 20 X 5G showed mean download speeds in excess of 200 Mbps in some markets during Q3 2019. However, there’s clearly some difference in which devices are supported by which operators, as not all operators in 5G markets are offering 5G equally (if at all). Related, the Samsung Galaxy S10 5G models sold in the U.S. and China are powered by Qualcomm’s first-generation Snapdragon X50 5G modem, while other 5G markets receive the variant powered by Samsung’s in-house Exynos 5100 5G modem.

Mobile operators continue to incentivize consumers to upgrade to newer and more capable devices to ensure a more efficient use of spectrum assets for network operators. This leads to an improved utilization of shared resources, faster overall speeds and better quality of experience.

We’re looking forward to updating these analyses as more markets adopt 5G and as newer and even faster phones are released. For more information about how our device data can help you, contact us.

Ookla retains ownership of this article including all of the intellectual property rights, data, content graphs and analysis. This article may not be quoted, reproduced, distributed or published for any commercial purpose without prior consent. Members of the press and others using the findings in this article for non-commercial purposes are welcome to publicly share and link to report information with attribution to Ookla.
| January 14, 2021

Apple has 5G! But How Fast is the iPhone 12?


Apple’s 5G-capable iPhone 12 is the latest step in the continuous cycle of new technical specifications, new network components, new (or refarmed) radio spectrums and compatible user equipment that aim to deliver enhanced 5G user experience. At Ookla®, we are fortunate to have a front-row seat to observe these advances and we were thrilled when Apple announced its first 5G devices on October 13, 2020. Given the popularity of Apple’s devices, this release marks a major milestone on the way to 5G becoming mainstream.

iPhone 12 launch drives spikes in 5G testing

The daily count of unique devices worldwide that are capable of connecting to 5G jumped dramatically when each new iPhone 12 variant launched. We saw a 138.3% increase when comparing the day the iPhone 12 5G and iPhone 12 Pro 5G were released to the mean of the previous week. On the day the iPhone 12 Mini 5G and iPhone 12 Pro Max 5G launched, there was a further 44.3% increase over that one-day spike.

Daily-Trend_5G-Capable-Devices_Year_0121-1

Pro 5G and Pro Max 5G are the most popular iPhone 12 models

We examined Speedtest® results from the launch date of each model through the end of the year to see which iPhone 12 models are the most popular in 15 major cities across the globe. We found that most Speedtest users have opted for the “Pro” models. The iPhone 12 Pro Max 5G showed the highest number of samples among iPhone models in Singapore, Dubai, Hong Kong, New York, Riyadh and Sydney. The iPhone 12 Pro 5G showed the most samples in London, Madrid, Rome, Helsinki, Zürich, Berlin, Amsterdam, Seoul and Tokyo. While the more affordable models were less popular than the Pro models across all the cities on our list, the iPhone 12 Mini saw the most adoption in Tokyo and the iPhone 12 5G saw the most adoption in Rome.

iPhone-12-Model-Popularity_0121

Seoul tops list of iPhone 12 5G speeds

We analyzed Speedtest Intelligence® data for iPhone 12 devices in the same 15 cities and found that Seoul had the fastest median speed over 5G, followed by Dubai and Riyadh. Seoul also had the fastest upload speed by a considerable margin. This is not a surprise given reports that there are more than 100K 5G base stations in South Korea. It is interesting to note that European cities are relatively close to each other in terms of median download and upload speeds. That is good news for the 5G action plan of the European Commission and their target of having uninterrupted 5G coverage on major terrestrial transport paths by 2025.
iPhone-12-5G-Median-Speeds_0121

Each of these markets utilizes its own unique approach to 5G. Today, the United States is the only market where iPhone 12 models support 5G high-bands, namely n260 and n261. This is to support existing commercial 5G deployments in the mmWave spectrum across all three Tier 1 operators.

Elsewhere on the globe mid-band (specifically the 3300-3800 MHz range in most countries) is the most common frequency range for initial 5G roll-outs. There are several reasons for this, ranging from principles of electromagnetic wave propagation to marketing strategies. High-band frequency ranges (above 24 GHz with 400-800 MHz contiguous bandwidth) can do wonders in terms of download speeds, but due to limited propagation characteristics, it can be challenging to provide a mmWave coverage layer across entire markets. In order to mitigate this well-known challenge, operators tend to rely on the lower frequency bands for coverage and selectively deploy mmWave applications in targeted areas (such as high-traffic locations).

Depending on market dynamics and spectrum availability, most providers choose non-standalone (NSA) 5G configuration with an LTE anchor. Operators with limited amounts of FR1 spectrum tend to use dynamic spectrum sharing (DSS), a feature which allows both LTE and New Radio (NR) operation on the same slice of spectrum at the same time. This feature enables a relatively easy deployment of 5G coverage layers, and is a stepping stone to standalone 5G (5G SA). In addition to these commonly observed strategies, a few operators are considering pushing the limits of digital convergence with open radio access networks (RAN).

No matter which strategy an operator chooses, one important fact about 5G does not change: access to a trio of low, mid and high bands and a strategy for rolling out 5G SA is critical. Deployment of the 5G SA core unlocks the potential of enhanced mobile broadband (eMBB), ultra-reliable low latency communication (uRLLC) and massive machine type communications (mMTC).

Operator breakdown: iPhone 12 performance in select cities

5G deployments vary greatly from country to country, depending on spectrum allocated and the particular channel bandwidths each operator has deployed. This makes comparisons between countries difficult, as these factors directly impact the peak 5G speeds achievable in that market. However, looking at four major cities, we can see that performance by operator also varies.

iPhone-12-5G-Median-Speeds_Seoul_0121

In Seoul, the fastest city for 5G on the list above, the 3.5 GHz (Band n78) is used with 80 to 100 MHz channels per operator, and B2C mmWave (which would add a whopping 800 MHz channels per operator) is on the horizon. Here, LG U+ showed the fastest median download speed over 5G on the iPhone 12 in Seoul at 625.03 Mbps. SK Telecom was second and KT third.

iPhone-12-5G-Median-Speeds_Hong-Kong_0121

The three Hong Kong mobile operators that launched commercial 5G networks on April 1, 2020 ranked fastest for iPhone 12 5G median download speed rankings in Hong Kong. China Mobile HK, the only 5G network provider in Hong Kong that has acquired 3.3 GHz (3380-3400 MHz) and 3.5 GHz (3400-3460 MHz) continuous bandwidth spectrum was the fastest of these three at 212.77 Mbps. CSL and 3 Hong Kong were a close second and third, respectively. SmarTone, which launched its 5G network a month later, was fourth.

iPhone-12-5G-Median-Speeds_Amsterdam0121

The 3.5 GHz band is not yet available in the Netherlands, but this did not slow down Dutch operators in launching their commercial 5G networks in 2020. According to Speedtest Intelligence data, KPN Mobile was comfortably at the top, with a median download speed of 211.80 Mbps over 5G using the iPhone 12 in Amsterdam during Q4 2020. T-Mobile was second and Vodafone third.

iPhone-12-5G-Median-Speeds_Madrid_0121

While Spanish operators currently benefit from the n78 band, the next step is expected to be the delayed addition of low bands (700 MHz). In Madrid, Vodafone showed the fastest median download speed over 5G using the iPhone 12 during Q4 2020 at 232.51. Orange was second fastest, Yoigo third and Movistar at fourth.

We will continue to monitor how Apple’s 5G-capable devices impact the global market. Contact us to learn more about how Speedtest Intelligence can help you understand the latest developments in your market.

Ookla retains ownership of this article including all of the intellectual property rights, data, content graphs and analysis. This article may not be quoted, reproduced, distributed or published for any commercial purpose without prior consent. Members of the press and others using the findings in this article for non-commercial purposes are welcome to publicly share and link to report information with attribution to Ookla.