| December 10, 2018

The World’s Internet in 2018: Faster, Modernizing and Always On

When it comes to the internet, the news is mostly good for 2018. Download and upload speeds are increasing across the globe on both mobile and fixed broadband. 5G is on the horizon and gigabit service is expanding.

We looked at data from Speedtest IntelligenceTM, Ookla’s flagship data platform, from December 2017 through November 2018, to analyze everything from global internet speeds to the world’s fastest countries to when people are online. We also investigated which parts of the world are seeing the most benefit from high speed LTE on mobile and gigabit speeds on fixed broadband.

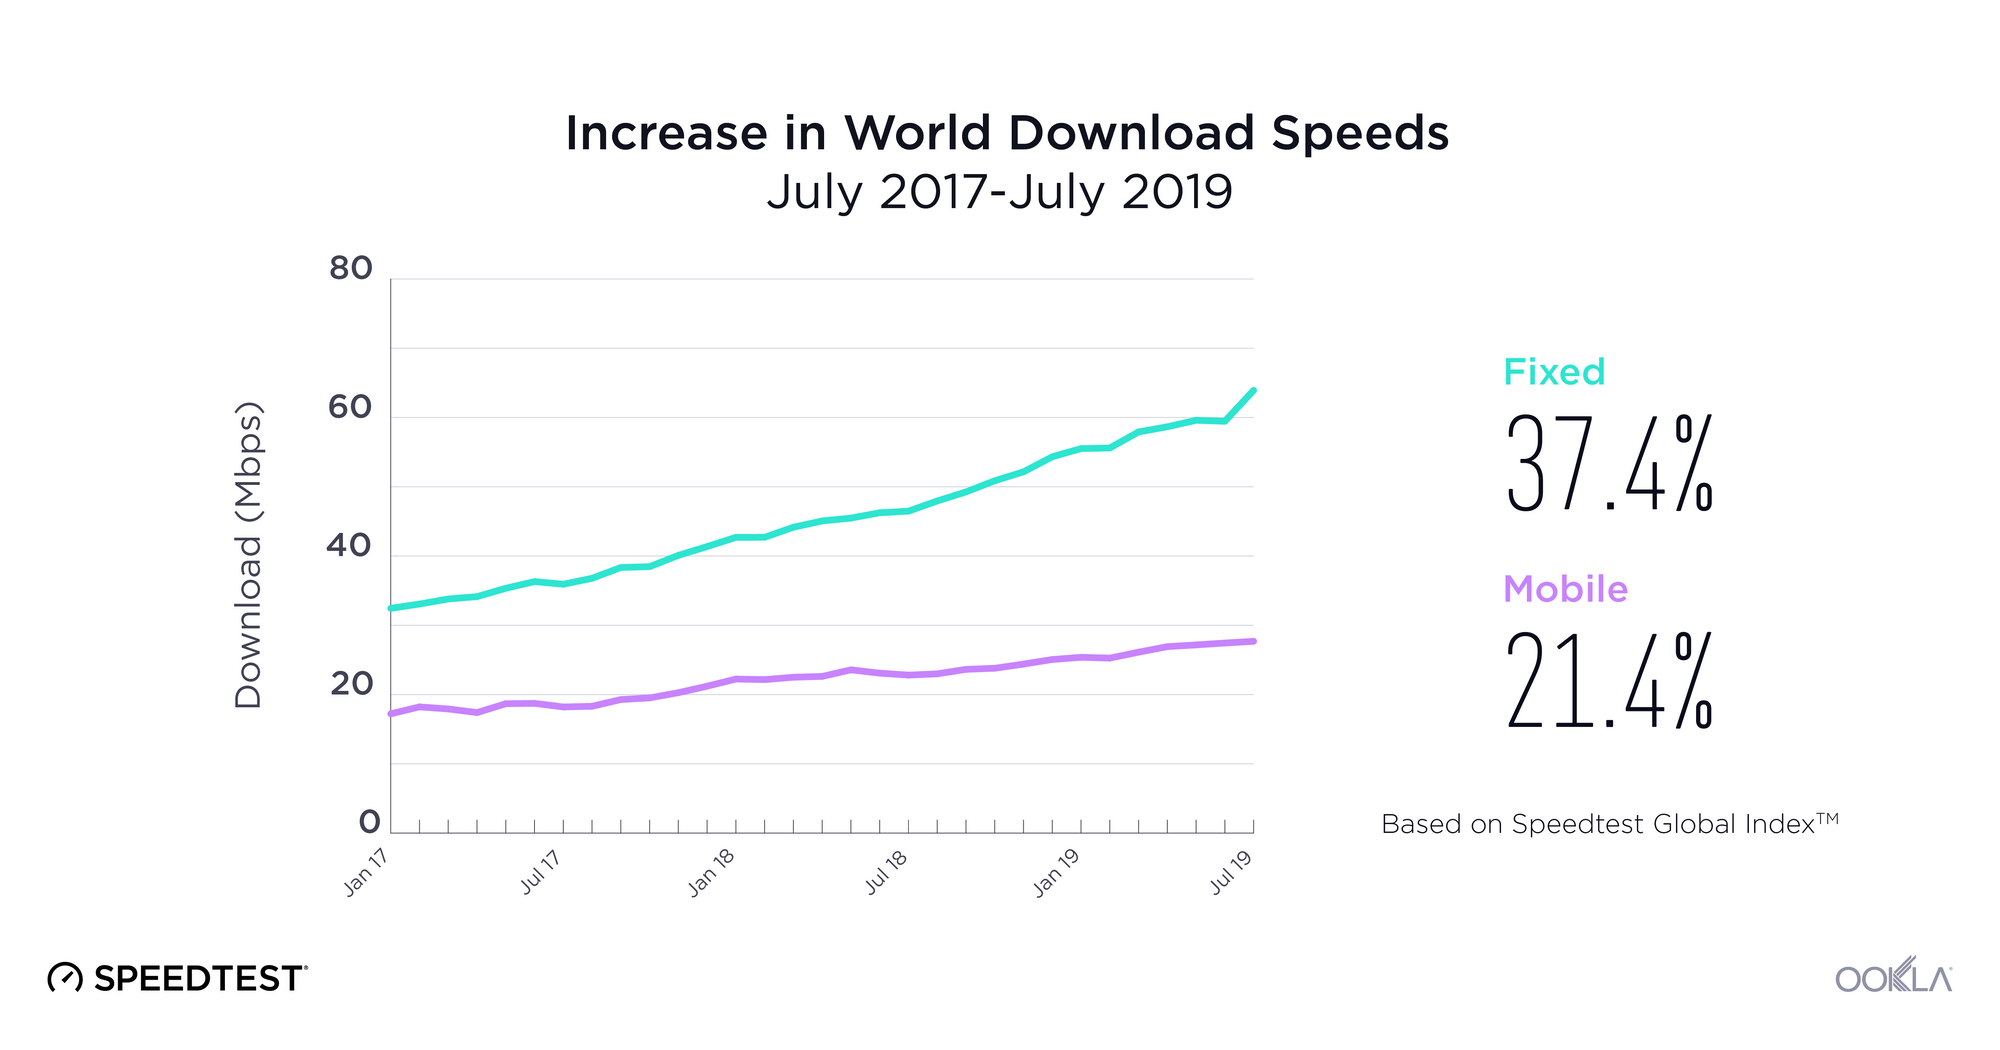
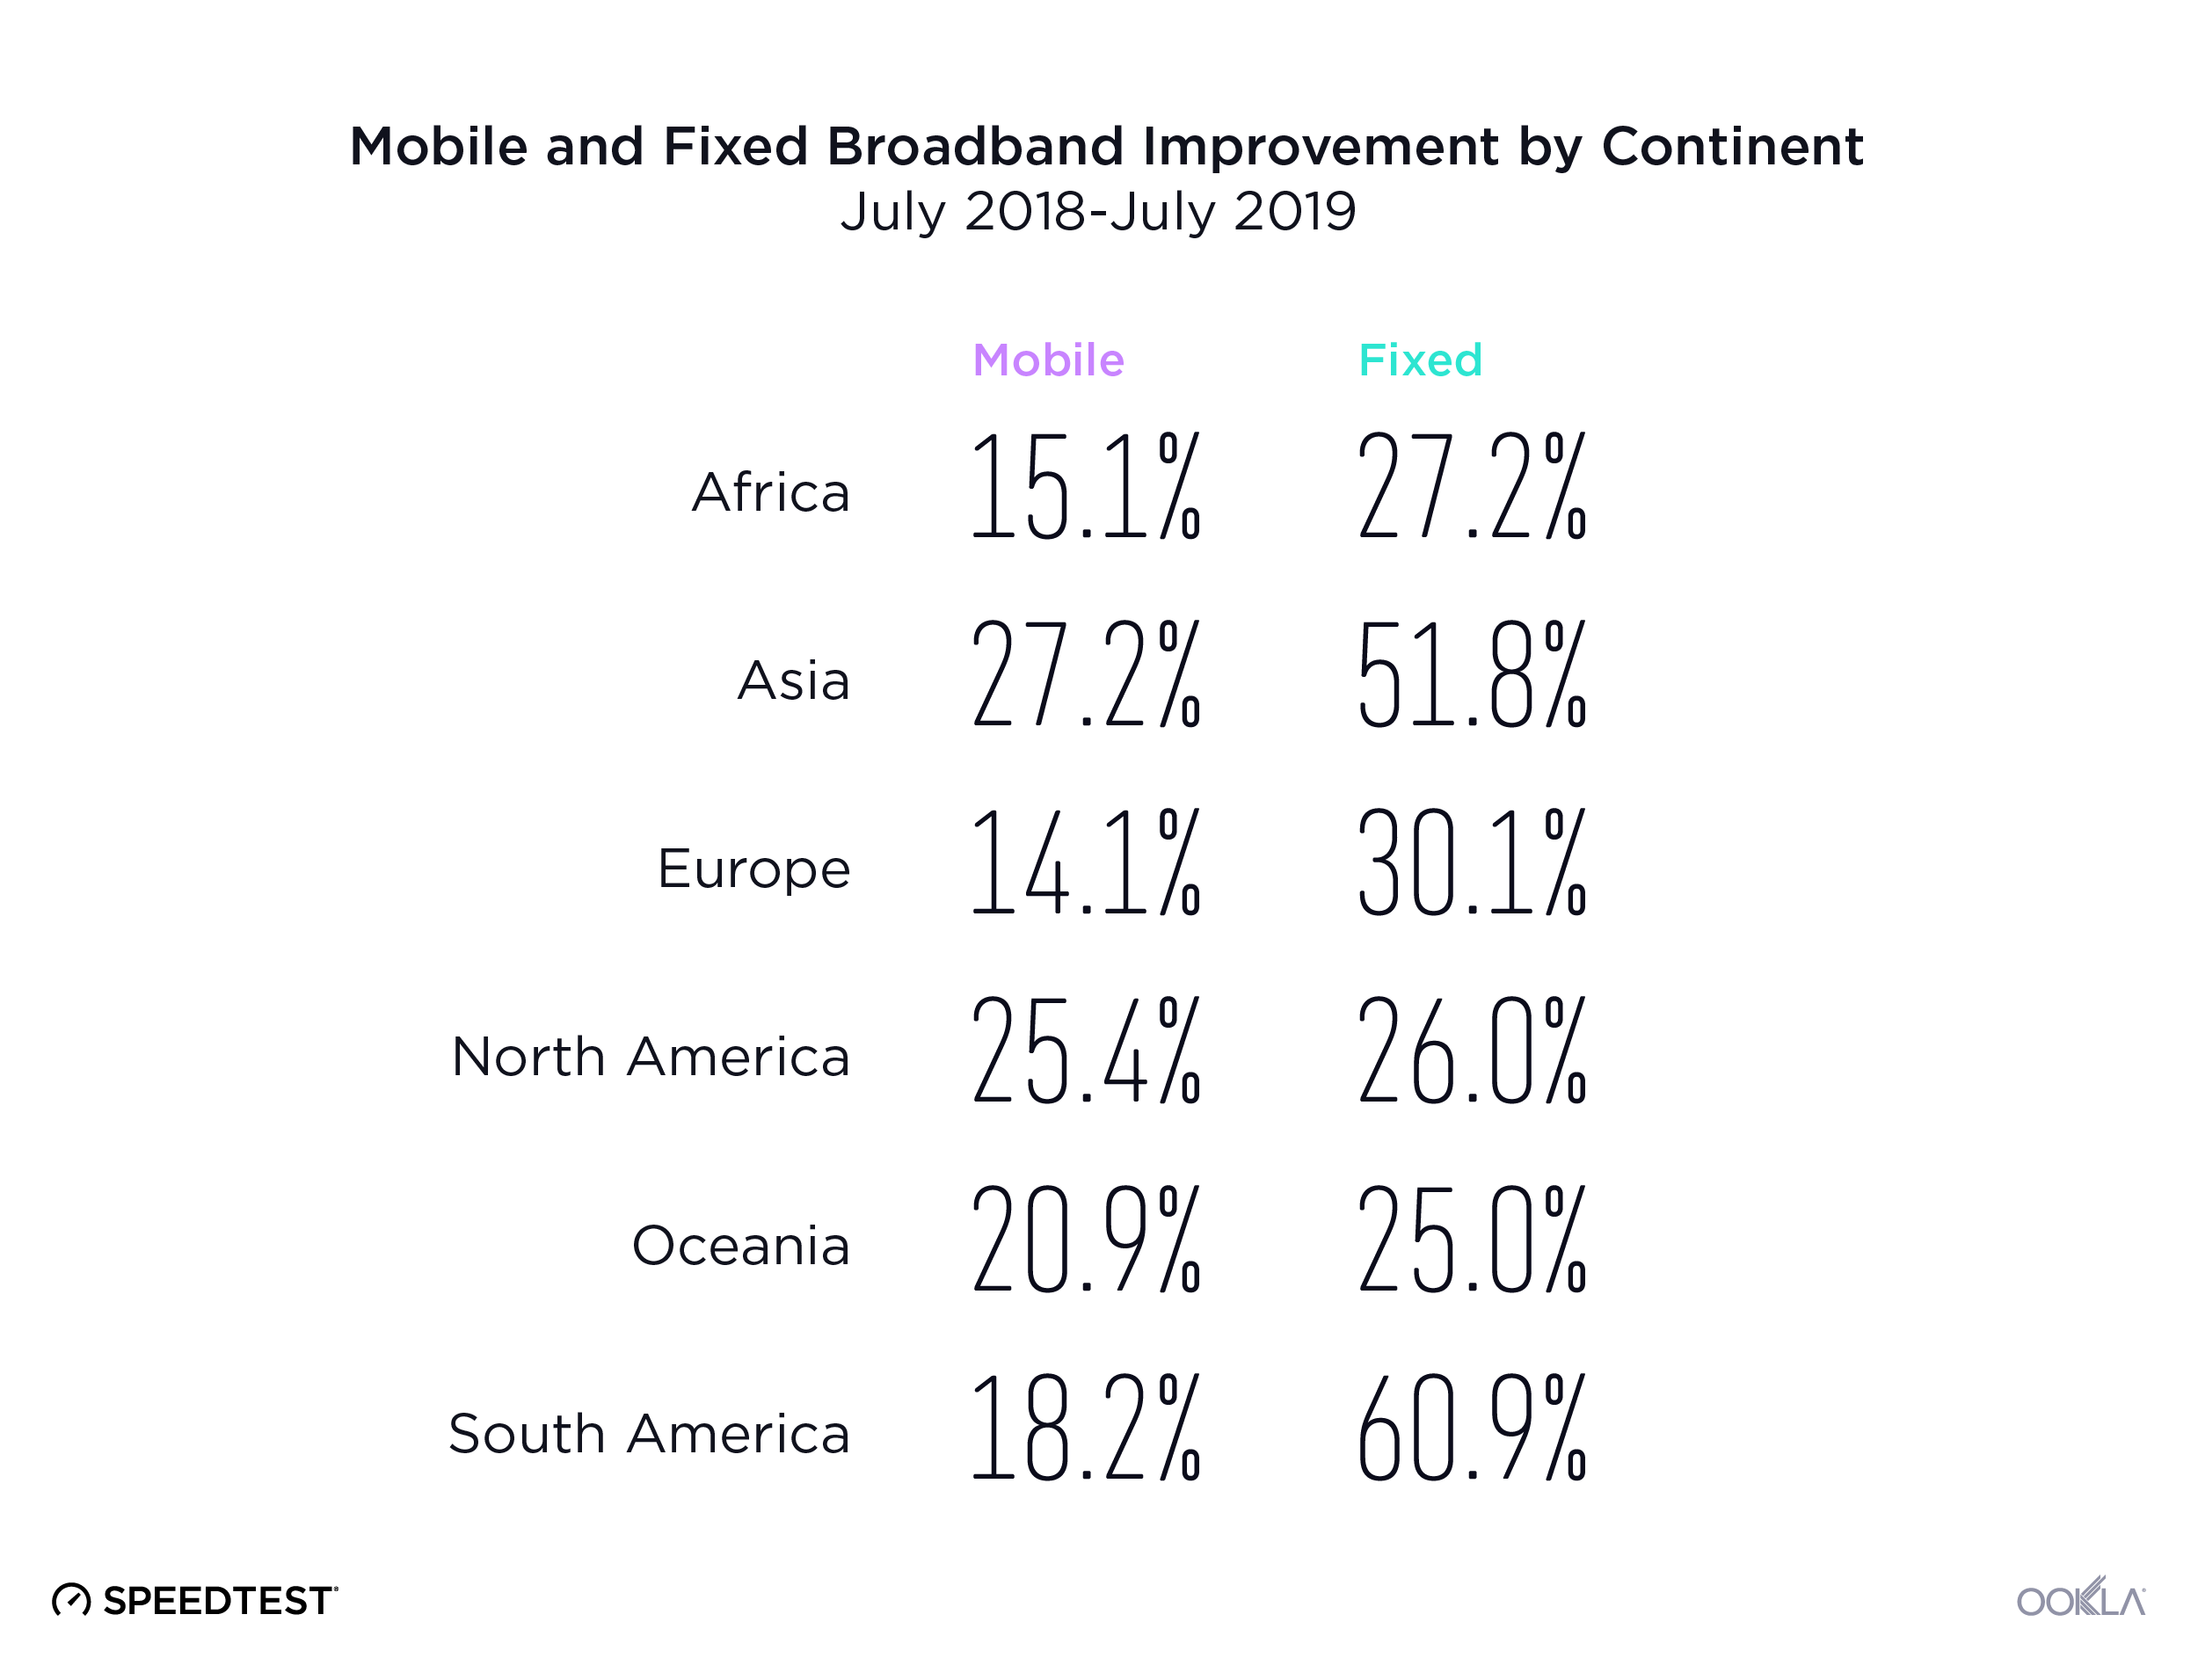
Mobile speeds increased more than 15% in 2018

Graphic-Tables-Final-v2_mobile-average-speed-3

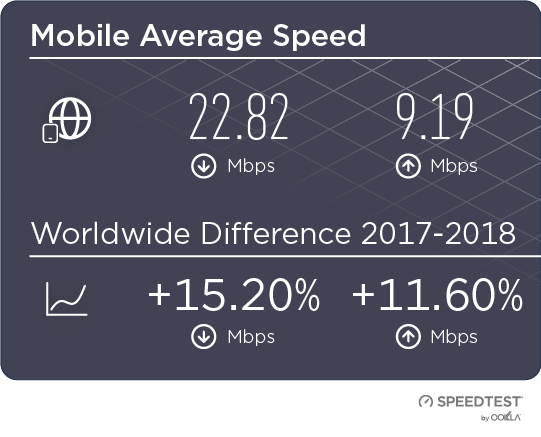
The world’s average mobile download speed of 22.82 Mbps increased 15.2% over the past year, while mobile upload speed increased 11.6% to reach 9.19 Mbps.

Graphic-Tables-Final-v2_android-vs-ios-1

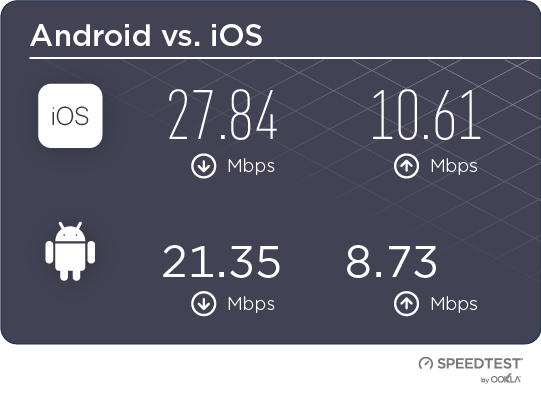
With a mean download speed of 27.84 Mbps and a mean upload of 10.61 Mbps, worldwide speeds on iOS devices were faster than those on Android (21.35 Mbps download, 8.73 Mbps upload) in 2018. This is likely due to market factors as Android devices are more popular in emerging markets where internet speeds tend to be slower.

However, download speed on Android devices increased 19.0% and upload speed increased 15.1%, more than those on iOS (18.0% increase for download and 11.1% increase for upload), which is good news for those emerging markets.

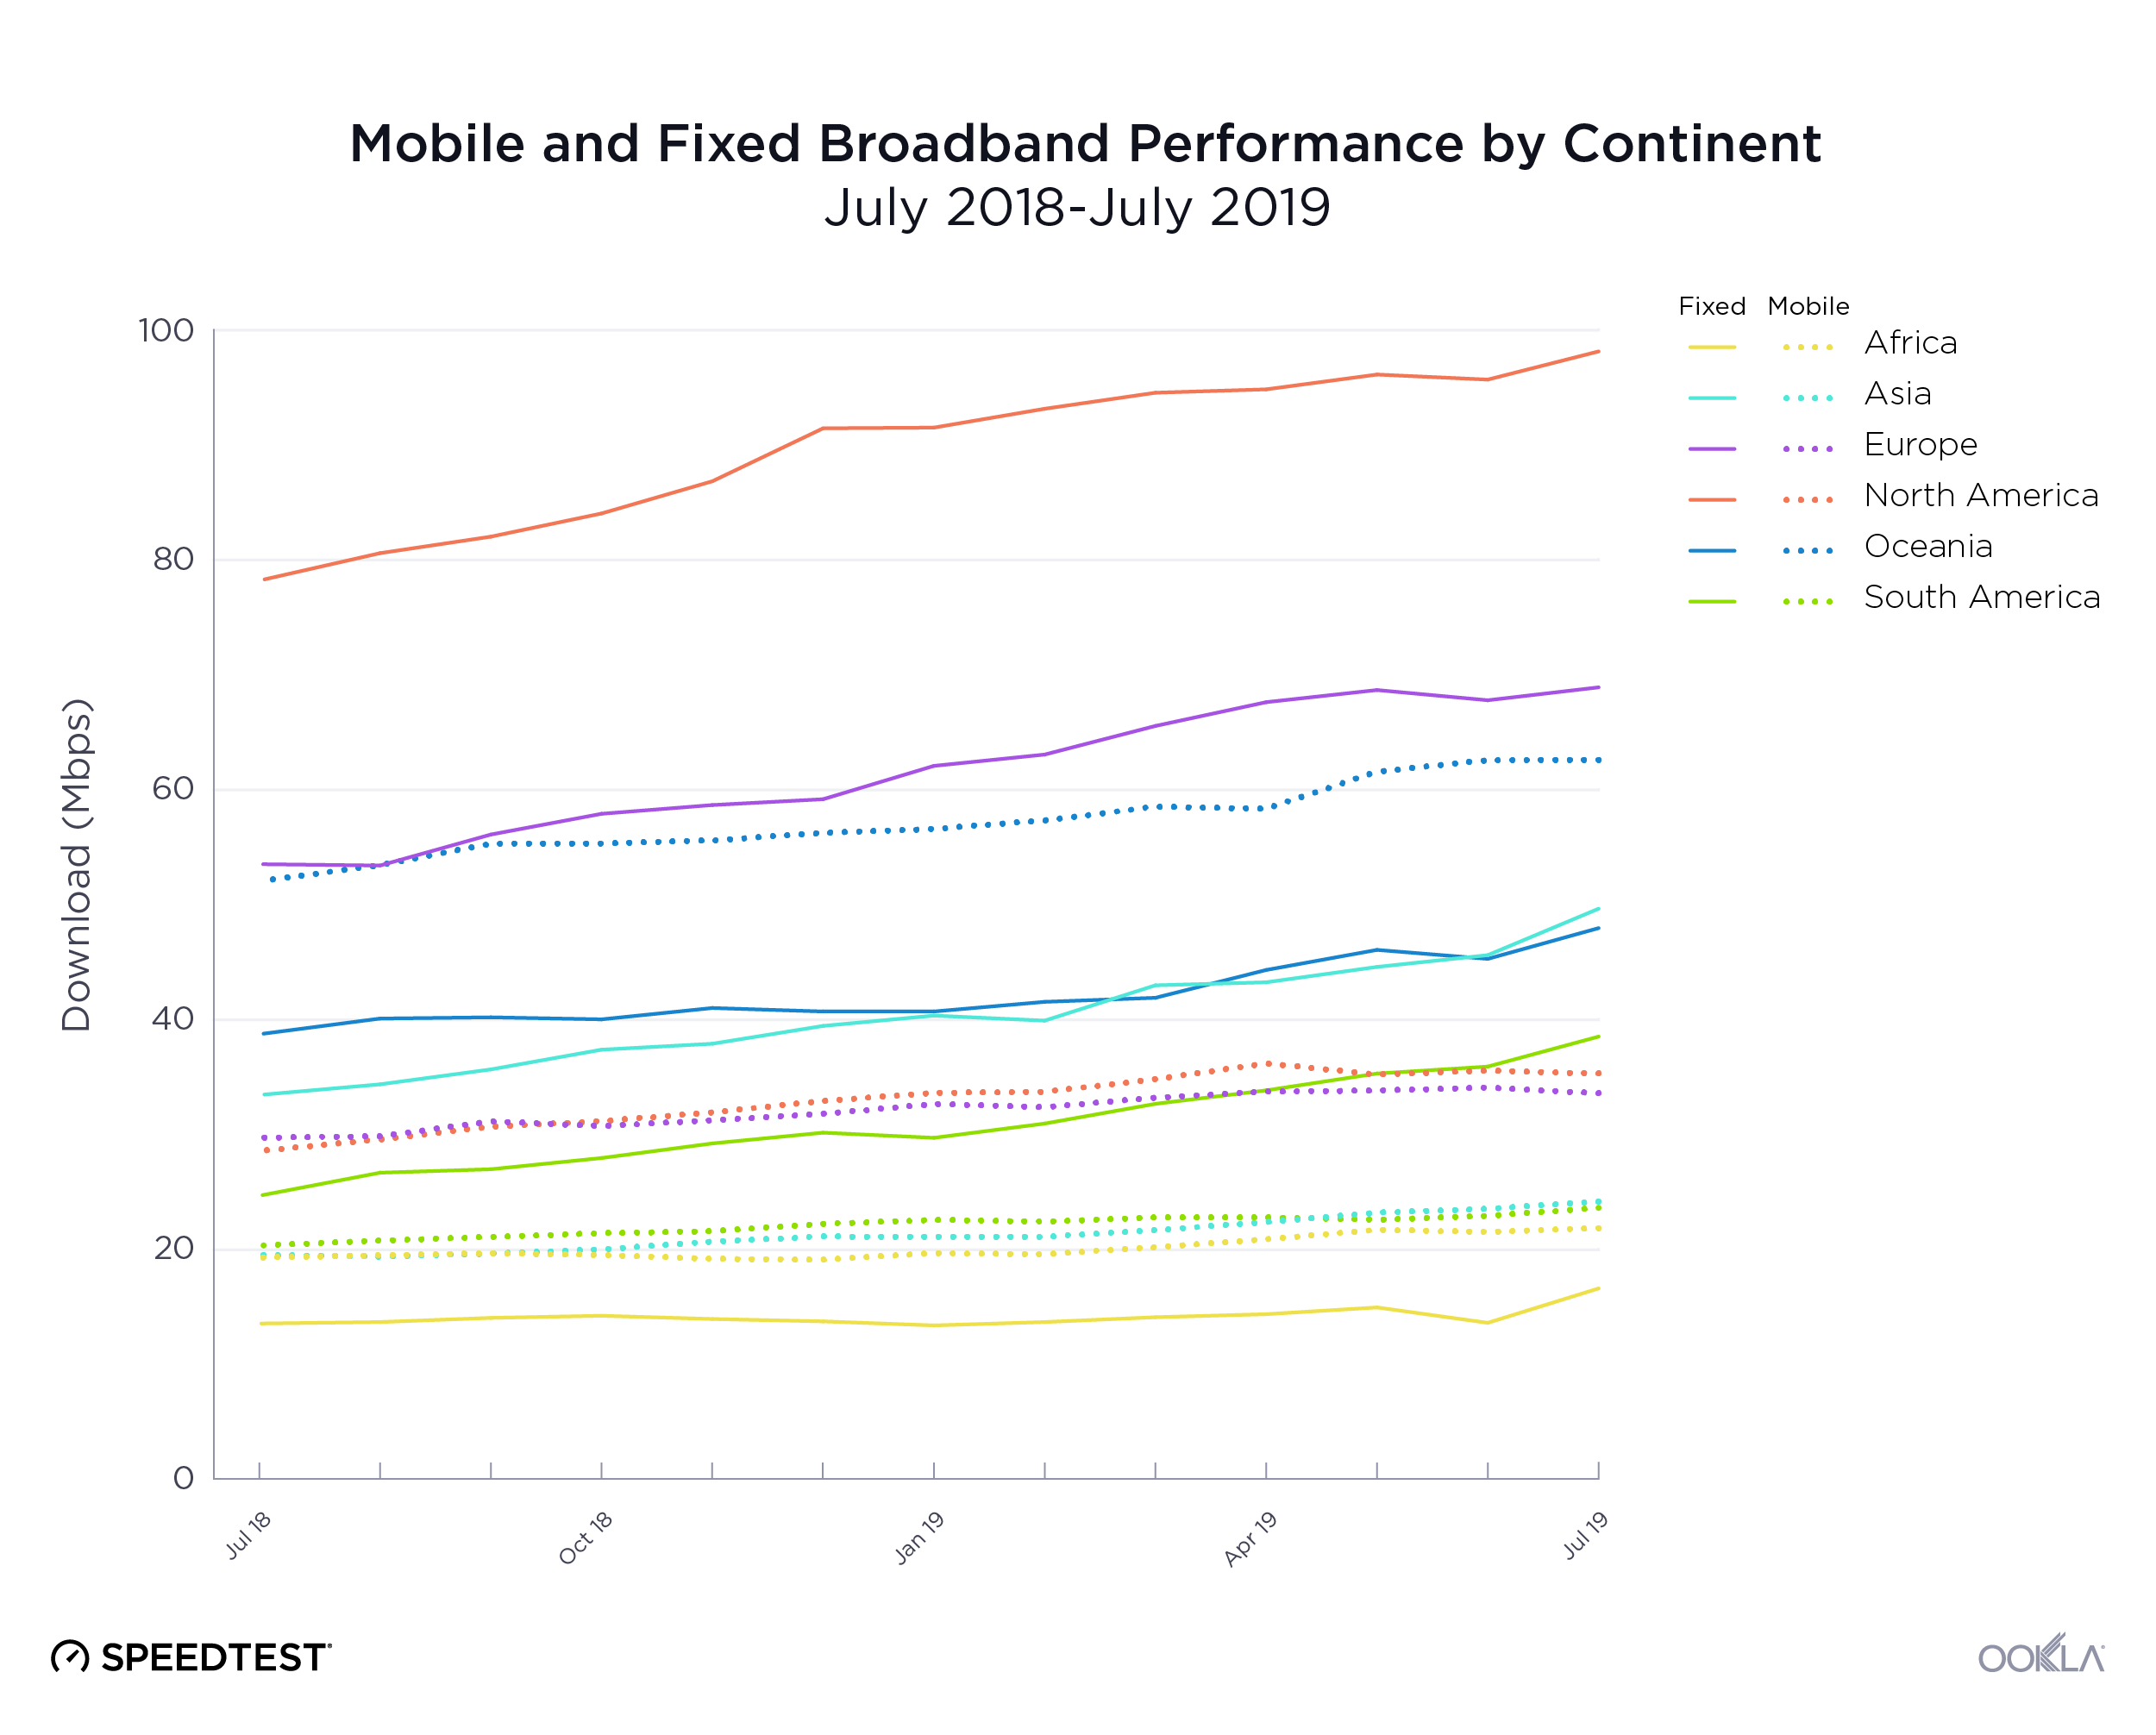
Fixed broadband speeds increased more than 26% in 2018

Graphic-Tables-Final-v2_fixed-average

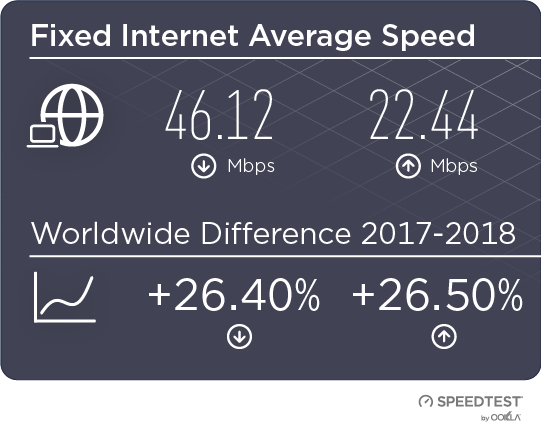
On a global level, fixed broadband speeds were nearly twice as fast as those on mobile in 2018. The world’s average download speed on fixed broadband was 46.12 Mbps, 26.4% faster than last year. Upload speed increased 26.5% to 22.44 Mbps.

All said, though, both mobile and fixed broadband speeds increased at a slower rate in 2018 than they did in 2017.

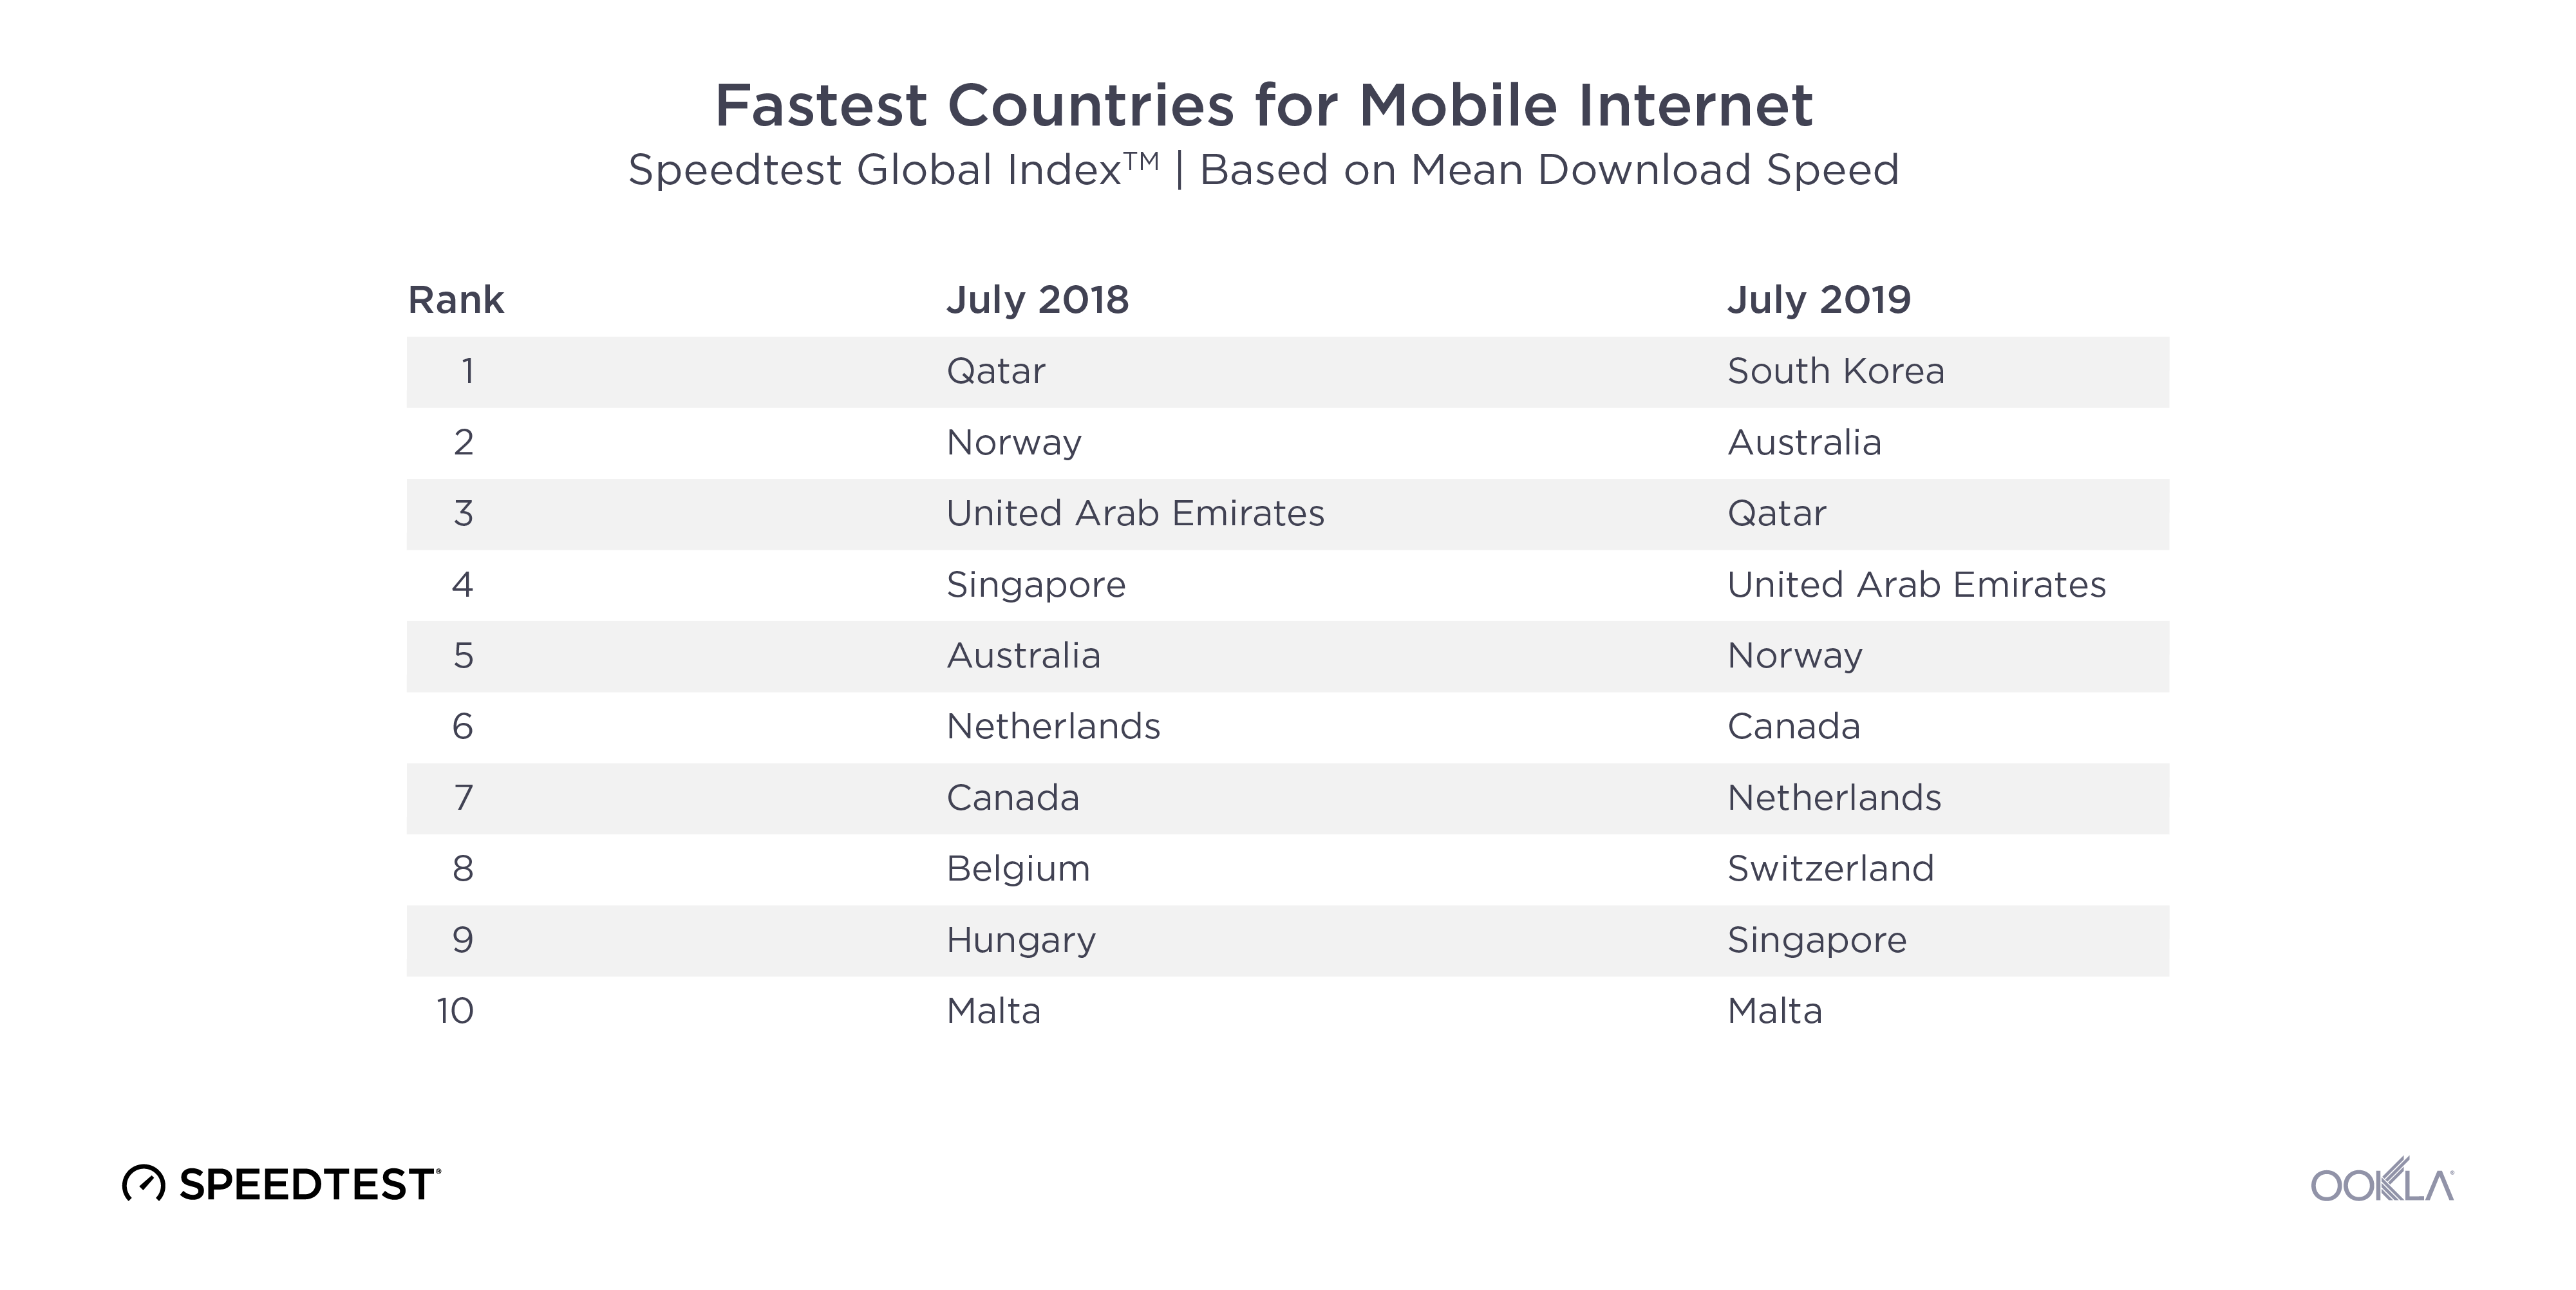
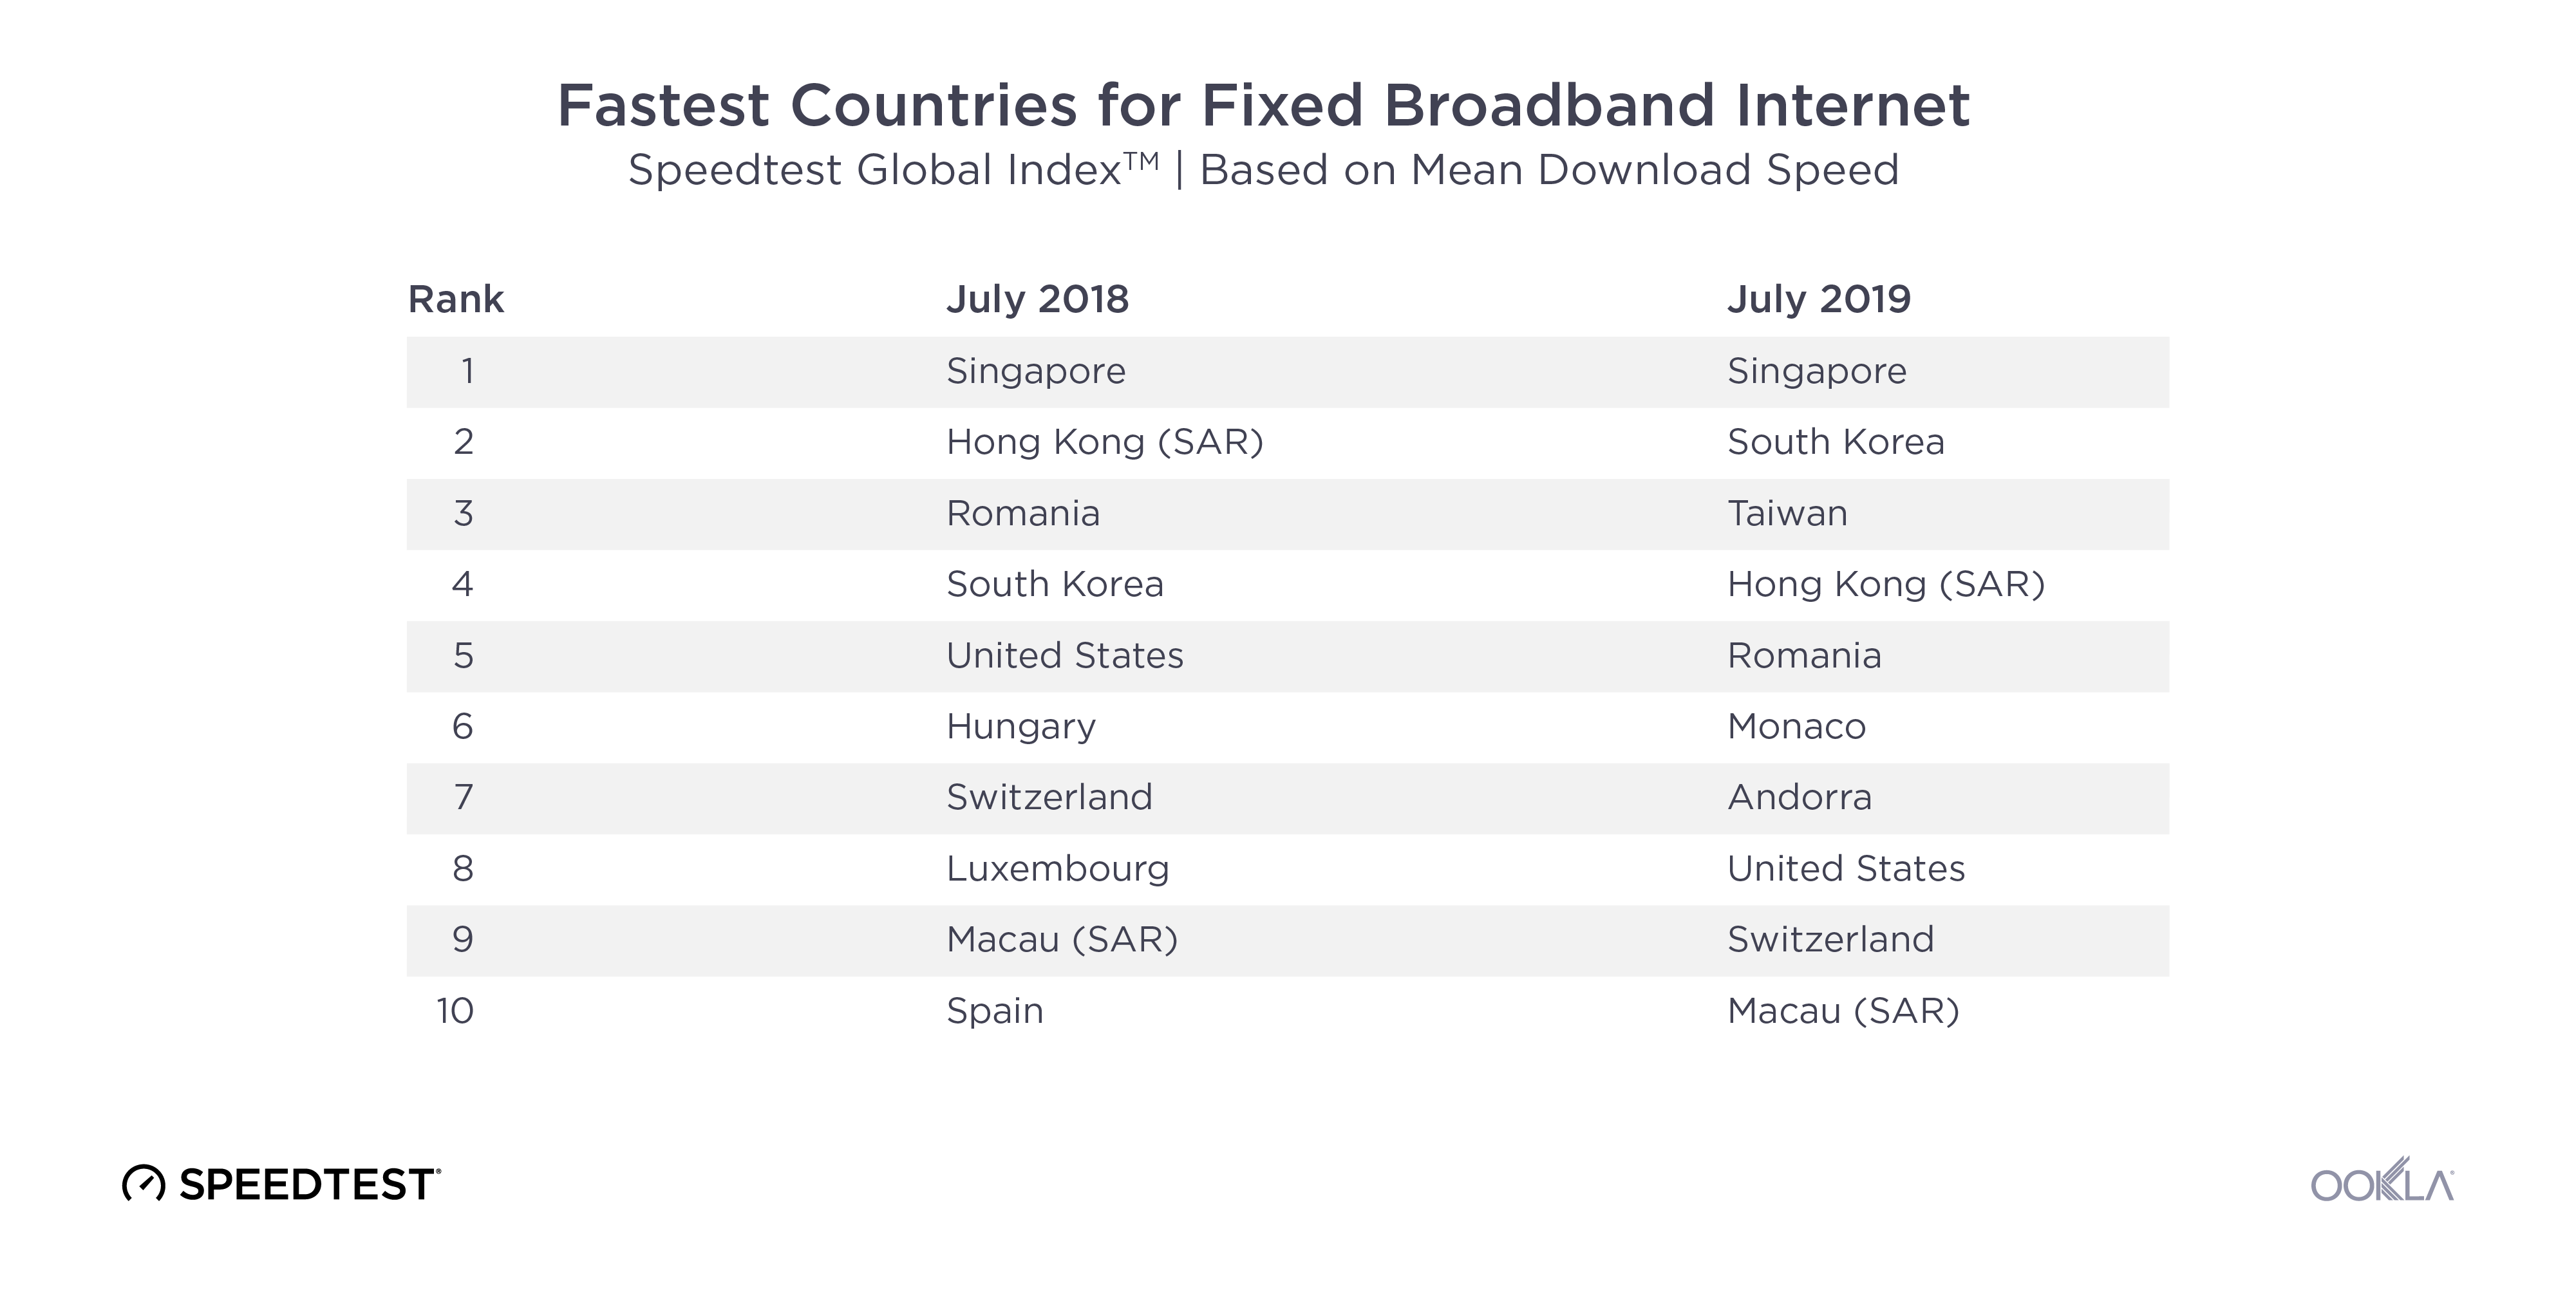
Countries with the fastest internet in 2018

Graphic-Tables-Final-v2_top-5-mobile

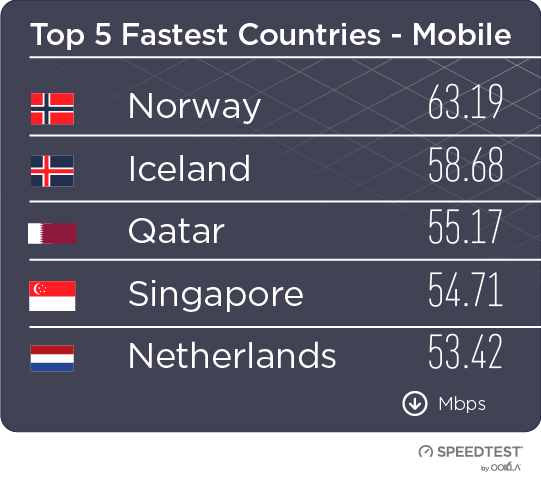
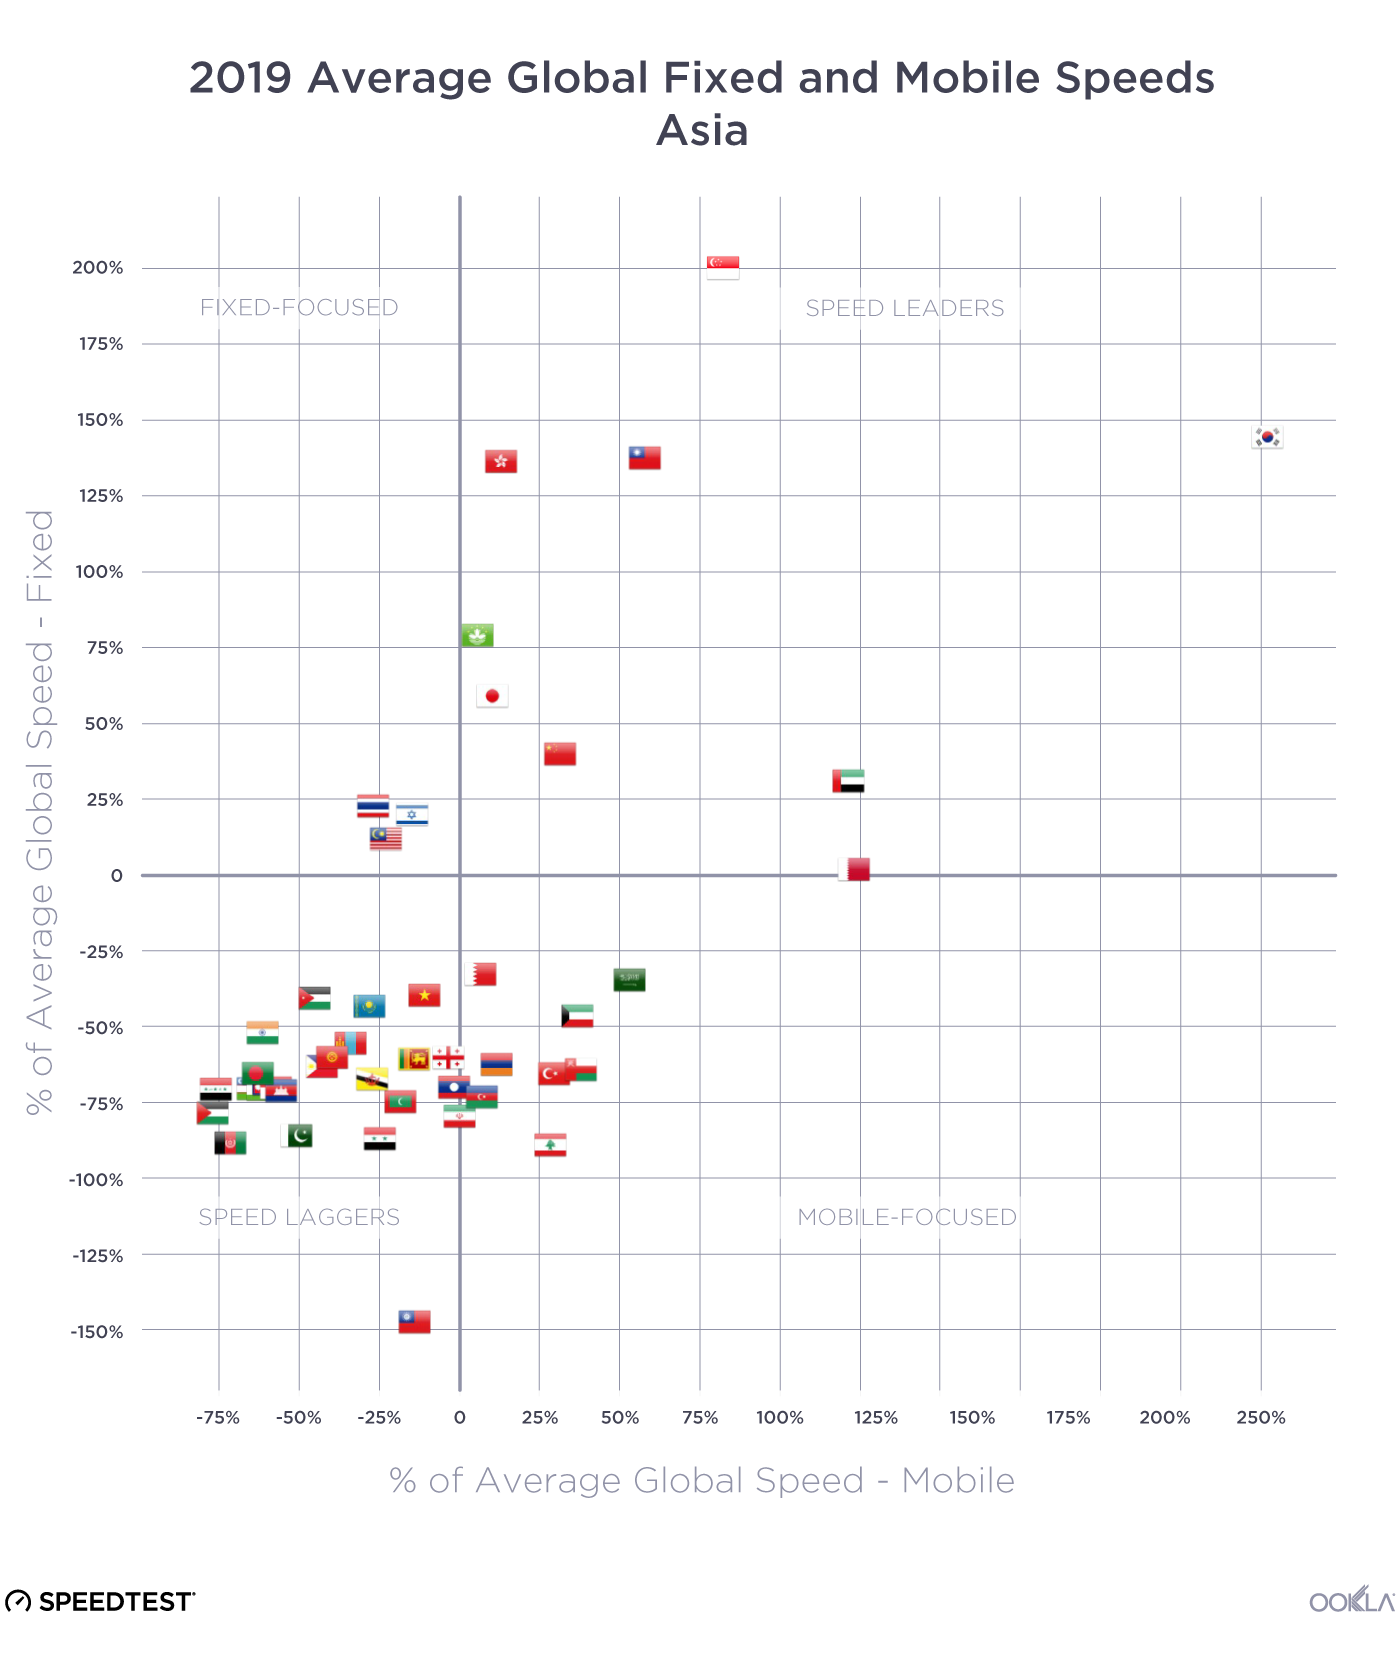
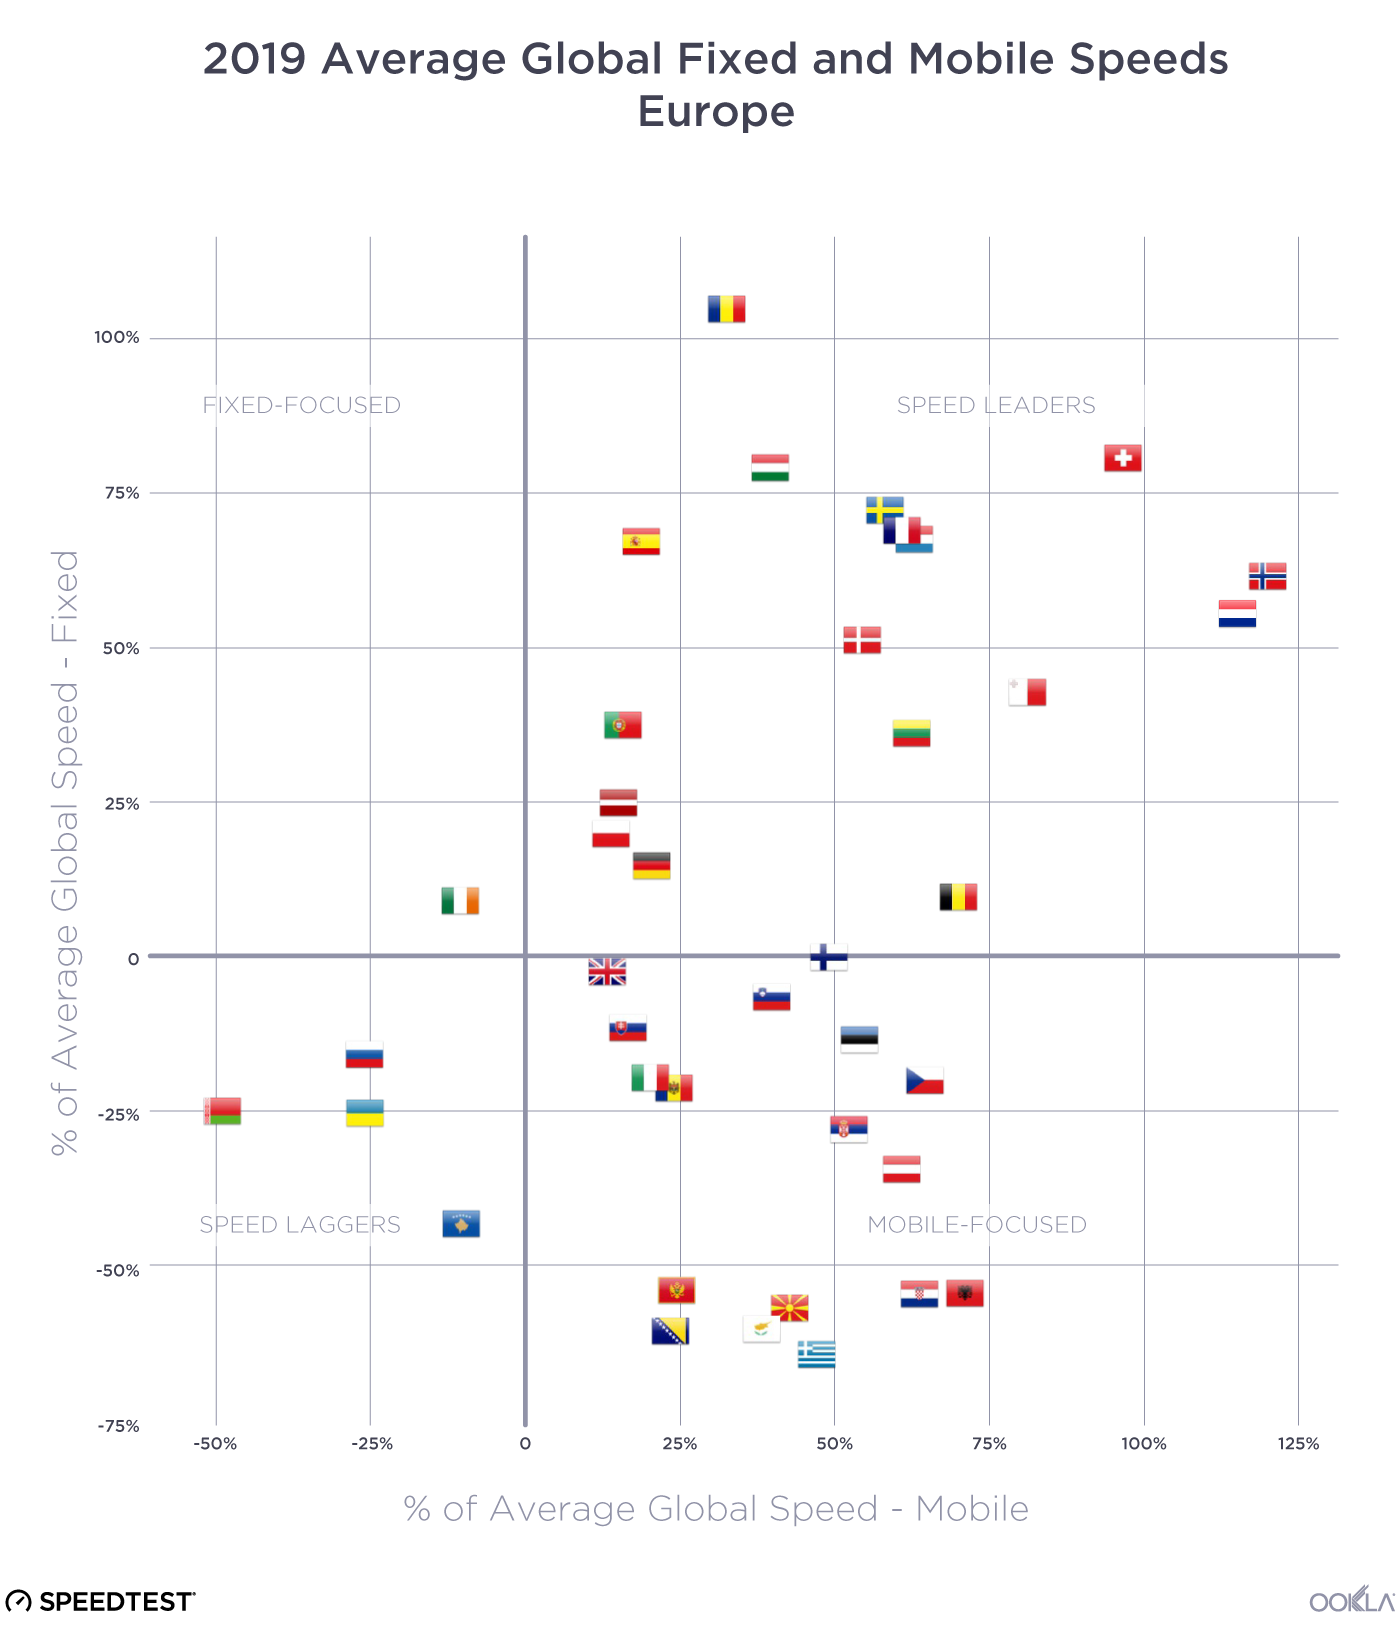
The countries with the fastest mean download speeds over mobile in the past 12 months were: Norway (63.19 Mbps), Iceland (58.68 Mbps), Qatar (55.17 Mbps), Singapore (54.71 Mbps) and the Netherlands (53.42 Mbps).

Graphic-Tables-Final-v2_top-5-fixed

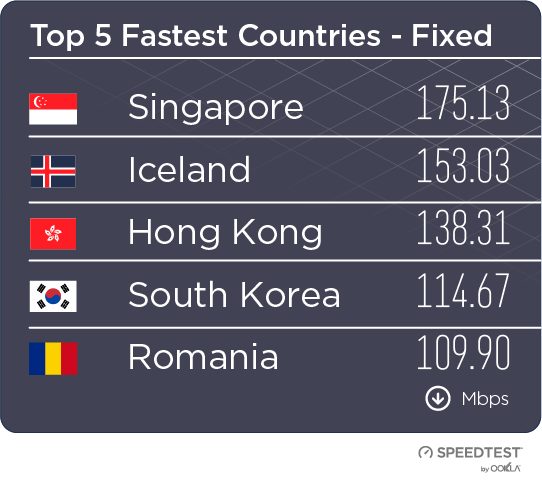
Singapore showed the world’s fastest mean download speeds over fixed broadband during the past twelve months at 175.13 Mbps. Next fastest were Iceland (153.03 Mbps), Hong Kong (138.31 Mbps), South Korea (114.67 Mbps) and Romania (109.90 Mbps).

To keep up with month-to-month internet speeds at a global level, visit the Speedtest Global Index.

Most improved countries for 2018 internet speeds

Graphic-Tables-Final-v2_most-improved-mobile

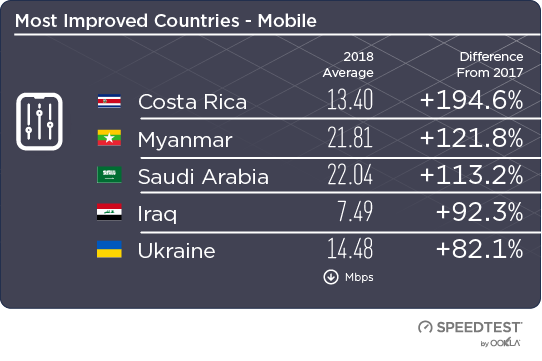
Costa Rica saw the largest increase in mobile download speed over the past year at 194.6%. Myanmar was second with 121.8%, Saudi Arabia third (113.2%), Iraq fourth (92.3%) and the Ukraine fifth (82.1%).

The countries with the largest improvements in upload speeds were Bangladesh (179.2%), the Ukraine (172.5%), Costa Rica (163.4%), Myanmar (146.9%) and Iraq (126.7%).

Graphic-Tables-Final-v2_most-improved-fixed

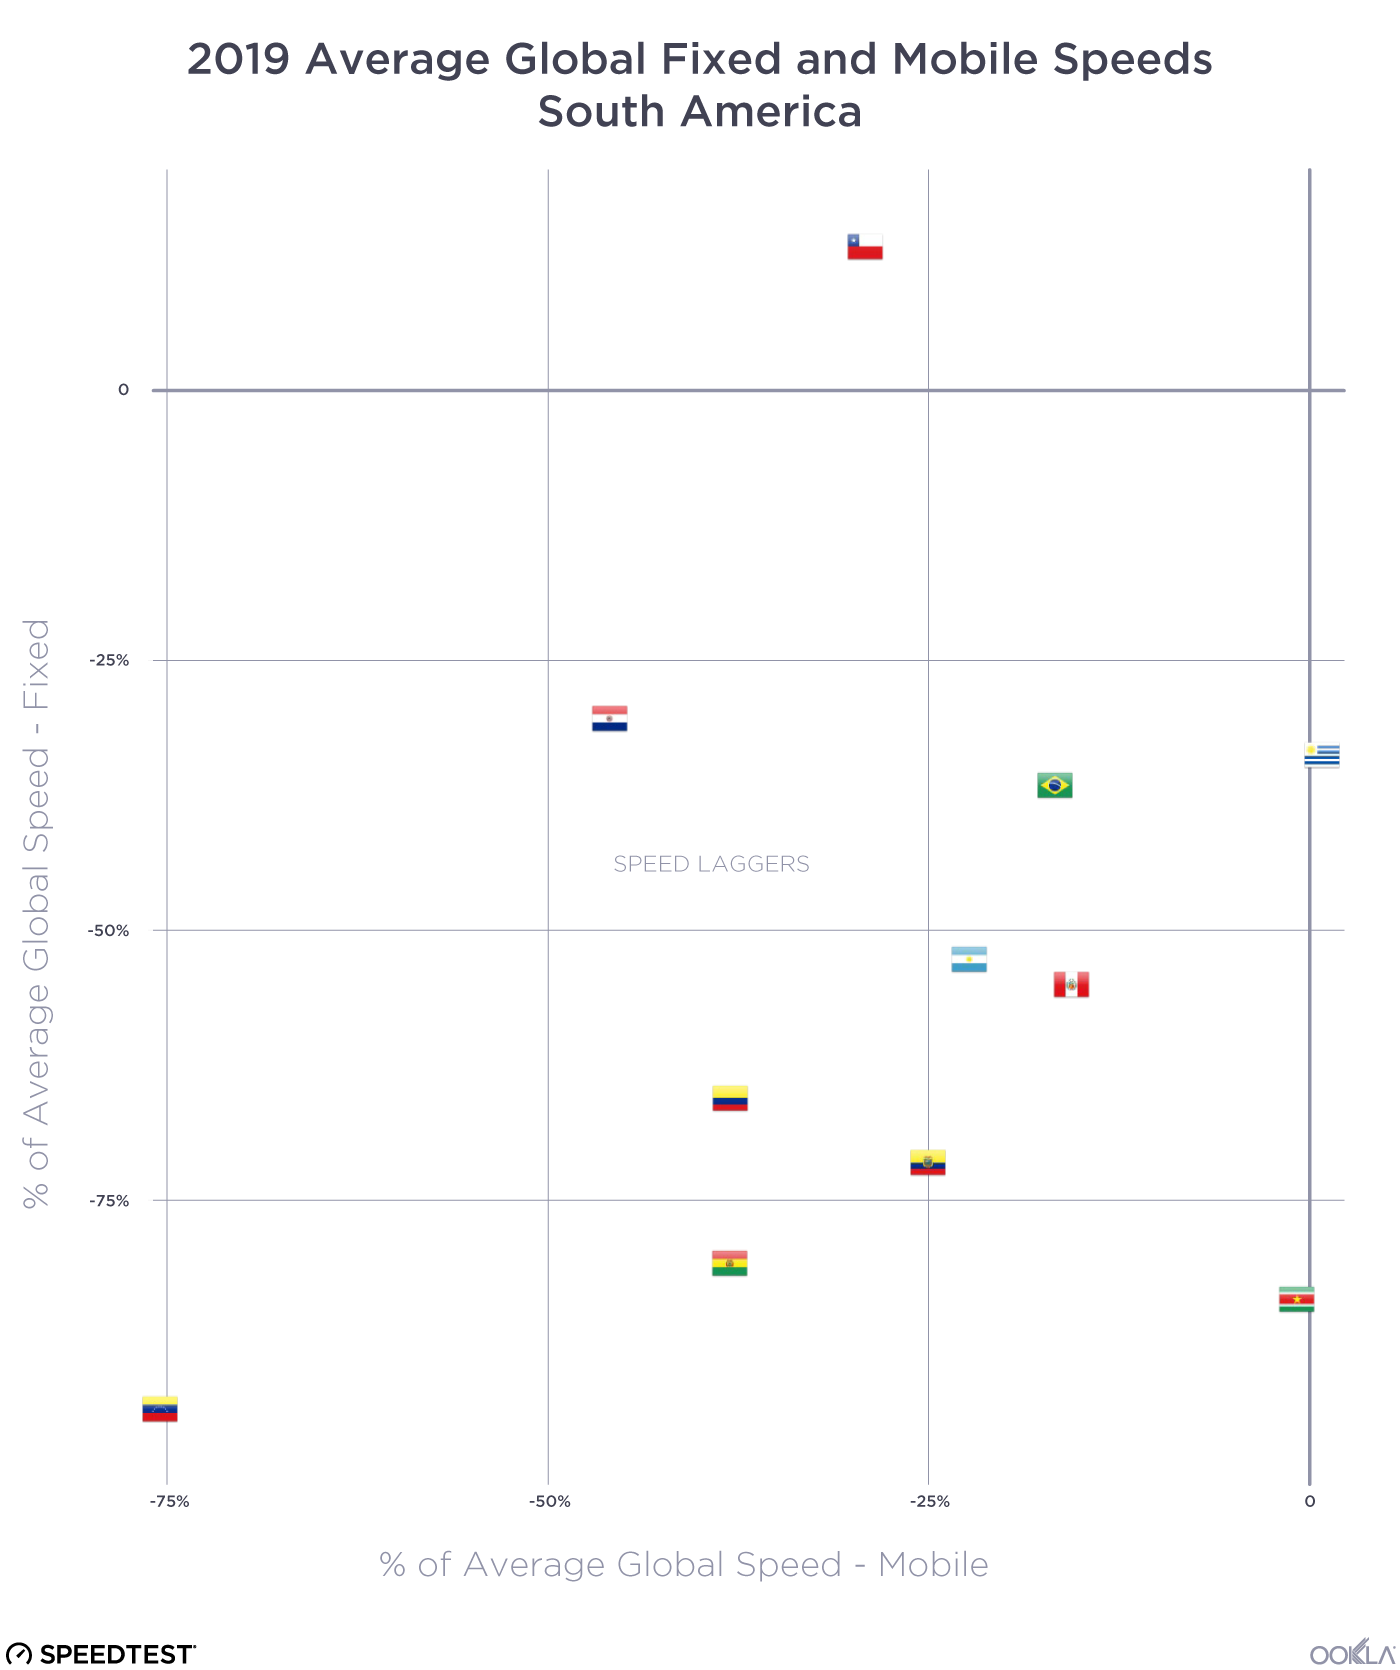
Paraguay saw the biggest increase in mean download speed over fixed broadband in the world over the past year at 268.6%. Guyana was second with 113.5%, Libya third (108.0%), Malaysia fourth (89.5%) and Laos fifth (76.2%).

Libya showed the most improvement in mean upload speed over fixed broadband during the past twelve months at 176.4%. Guyana was second with 116.1%, Malaysia third (95.2%), Belize fourth (88.9%) and Iraq fifth (76.8%).

4G is increasing mobile speeds

2017-2018-LTE-growth

When we looked specifically at Speedtest results on 4G, we saw that mean download speeds increased in most countries. Costa Rica was most improved for 4G download speed as was the case with overall download speed on mobile increasing 184.3% year over year. Saudi Arabia was second at 110.2% and Myanmar third at 78.0%.

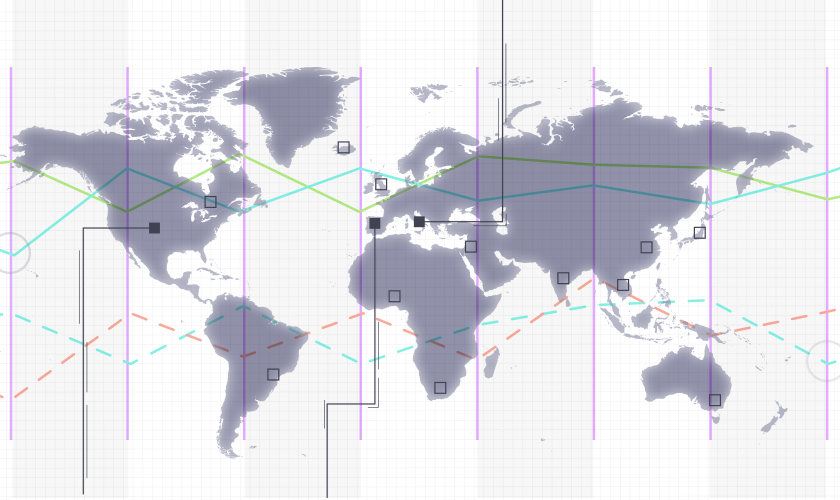
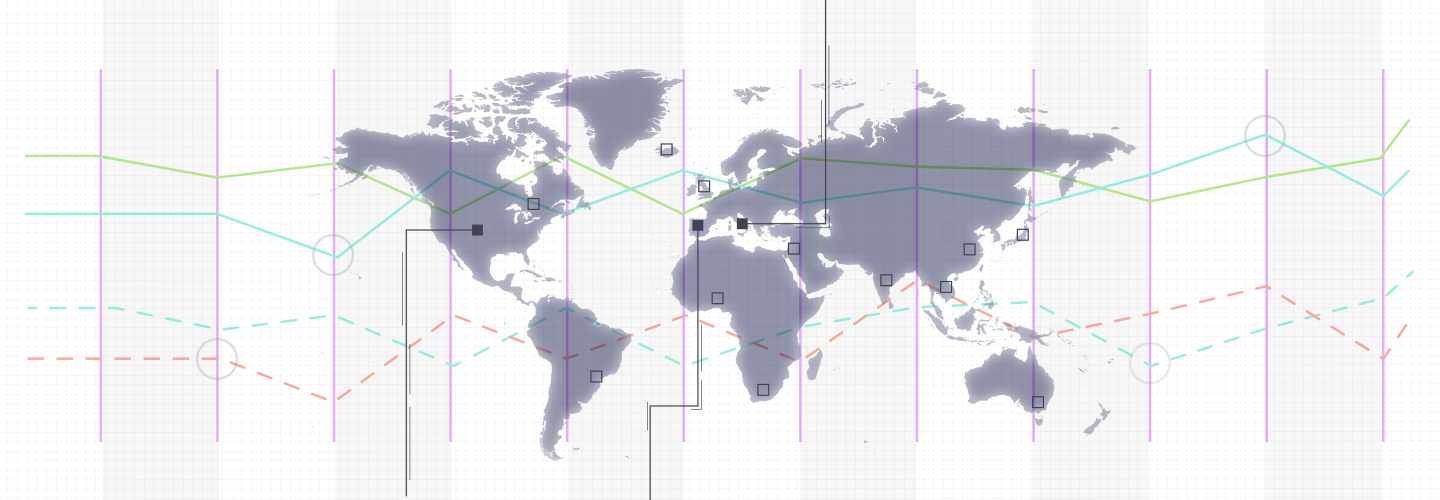
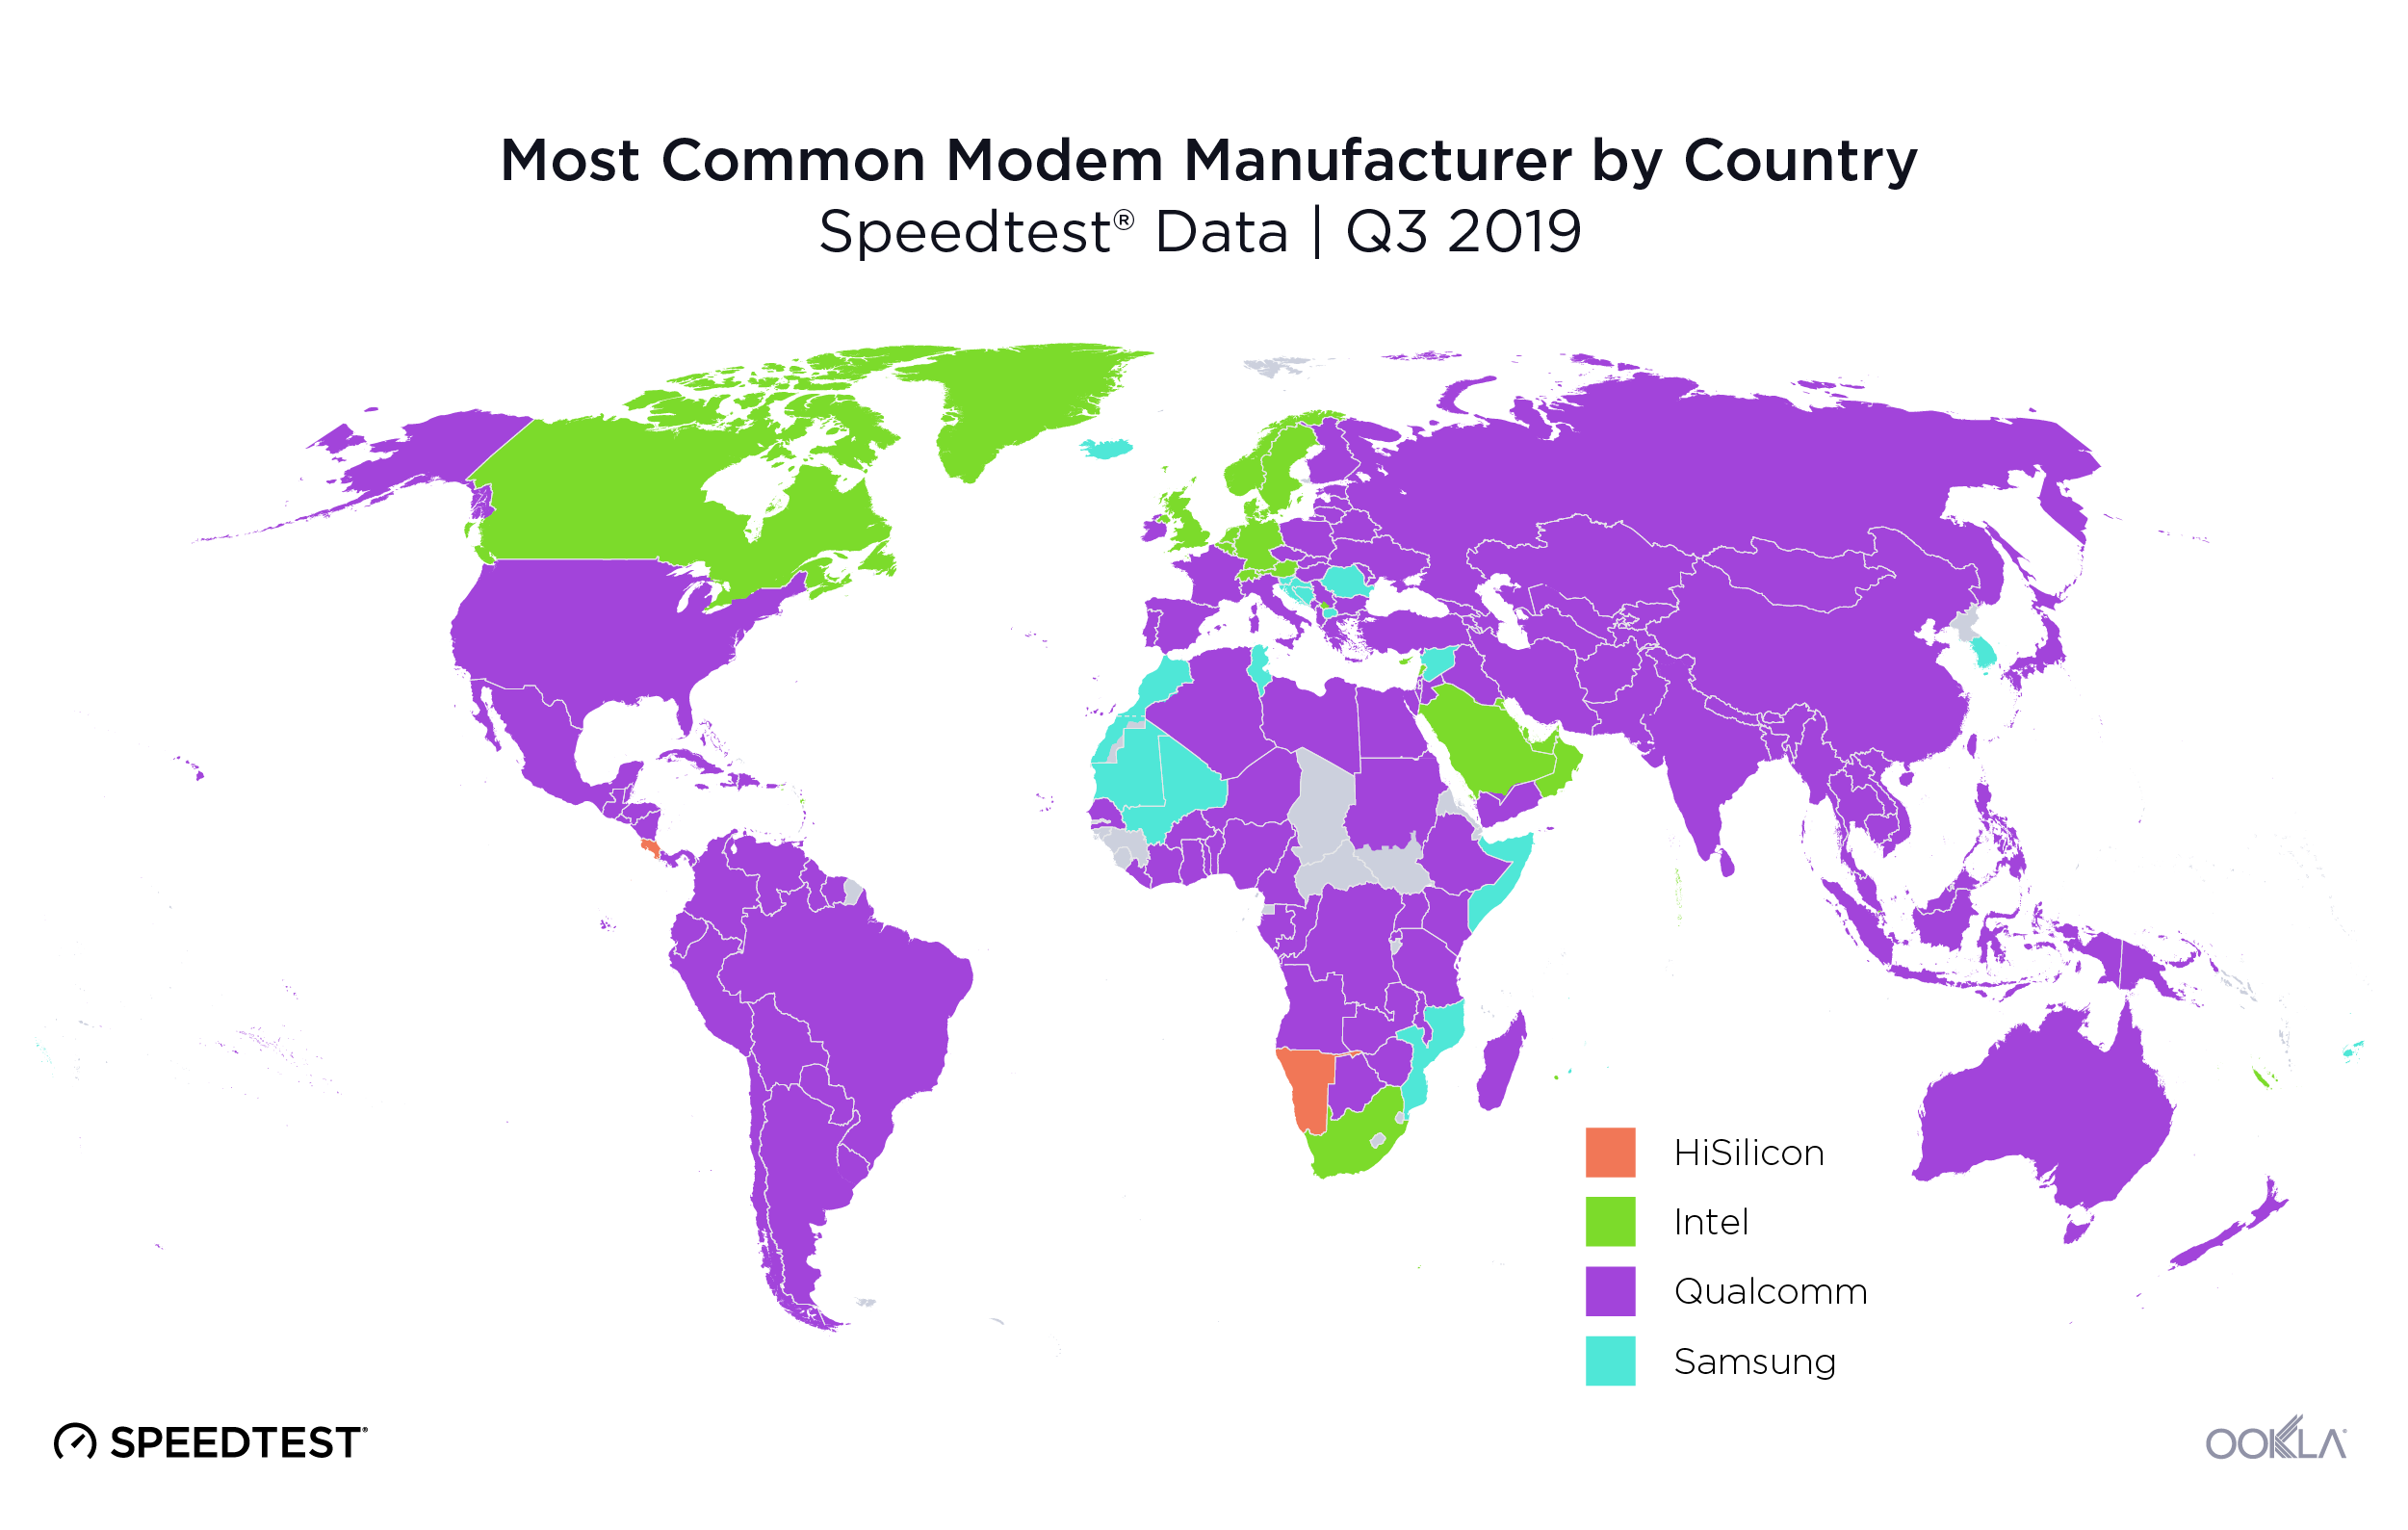
Most encouragingly, we saw the number of Speedtest results over 4G increase in all but 15 countries. This could indicate that 4G availability is expanding. Tanzania saw the greatest increase with 355.0% more tests over 4G in 2018 than in 2017. Malta was second at 267.2% and Algeria third at 143.7%. We can see this expansion on the map above as 4G results fill in areas of the globe that were previously blank.

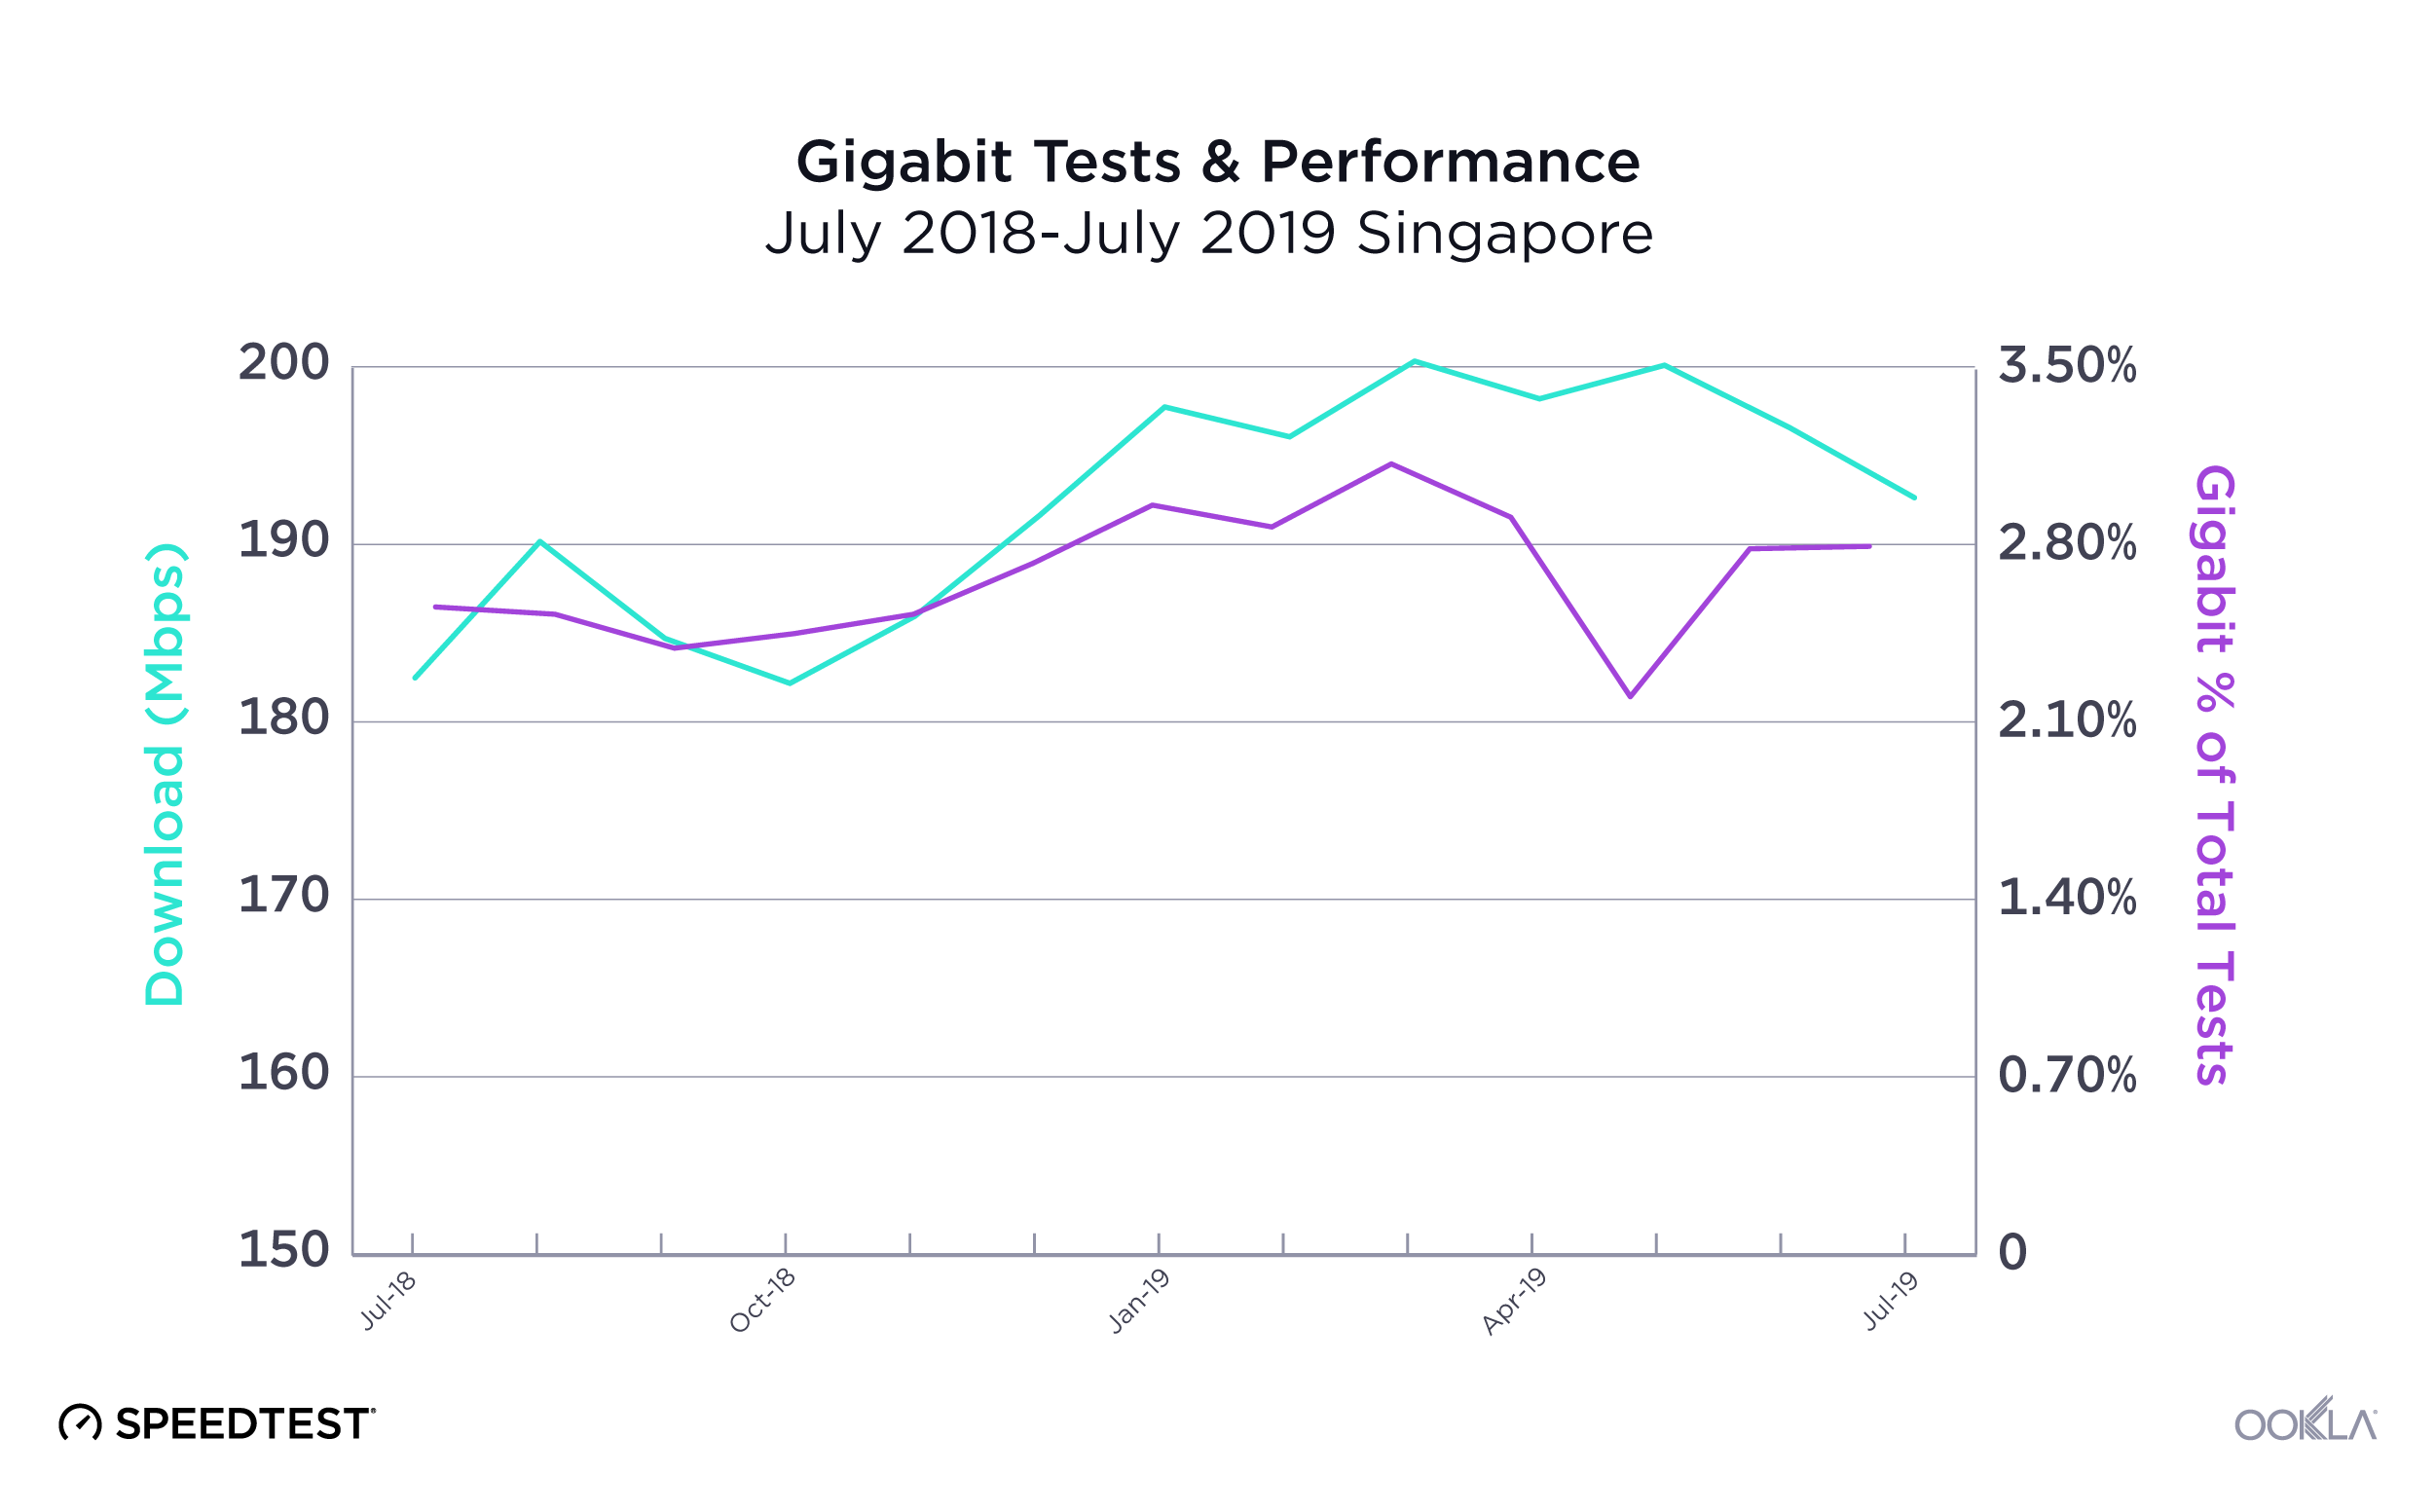
Gigabit coverage is expanding globally

gigabit-fade-1

Gigabit is in the news as ISPs across the globe expand their high-speed networks. We looked at Speedtest results on fixed broadband in excess of 750 Mbps to see which cities are benefitting most. Comparing locations with 100 or more gigabit-speed results in 2017 with those in 2018, that expansion becomes obvious. In 2017, 60 countries met our gigabit test threshold. In 2018, 16 additional countries joined our gigabit list. We’re also seeing that more cities around the world now have access to gigabit speeds.

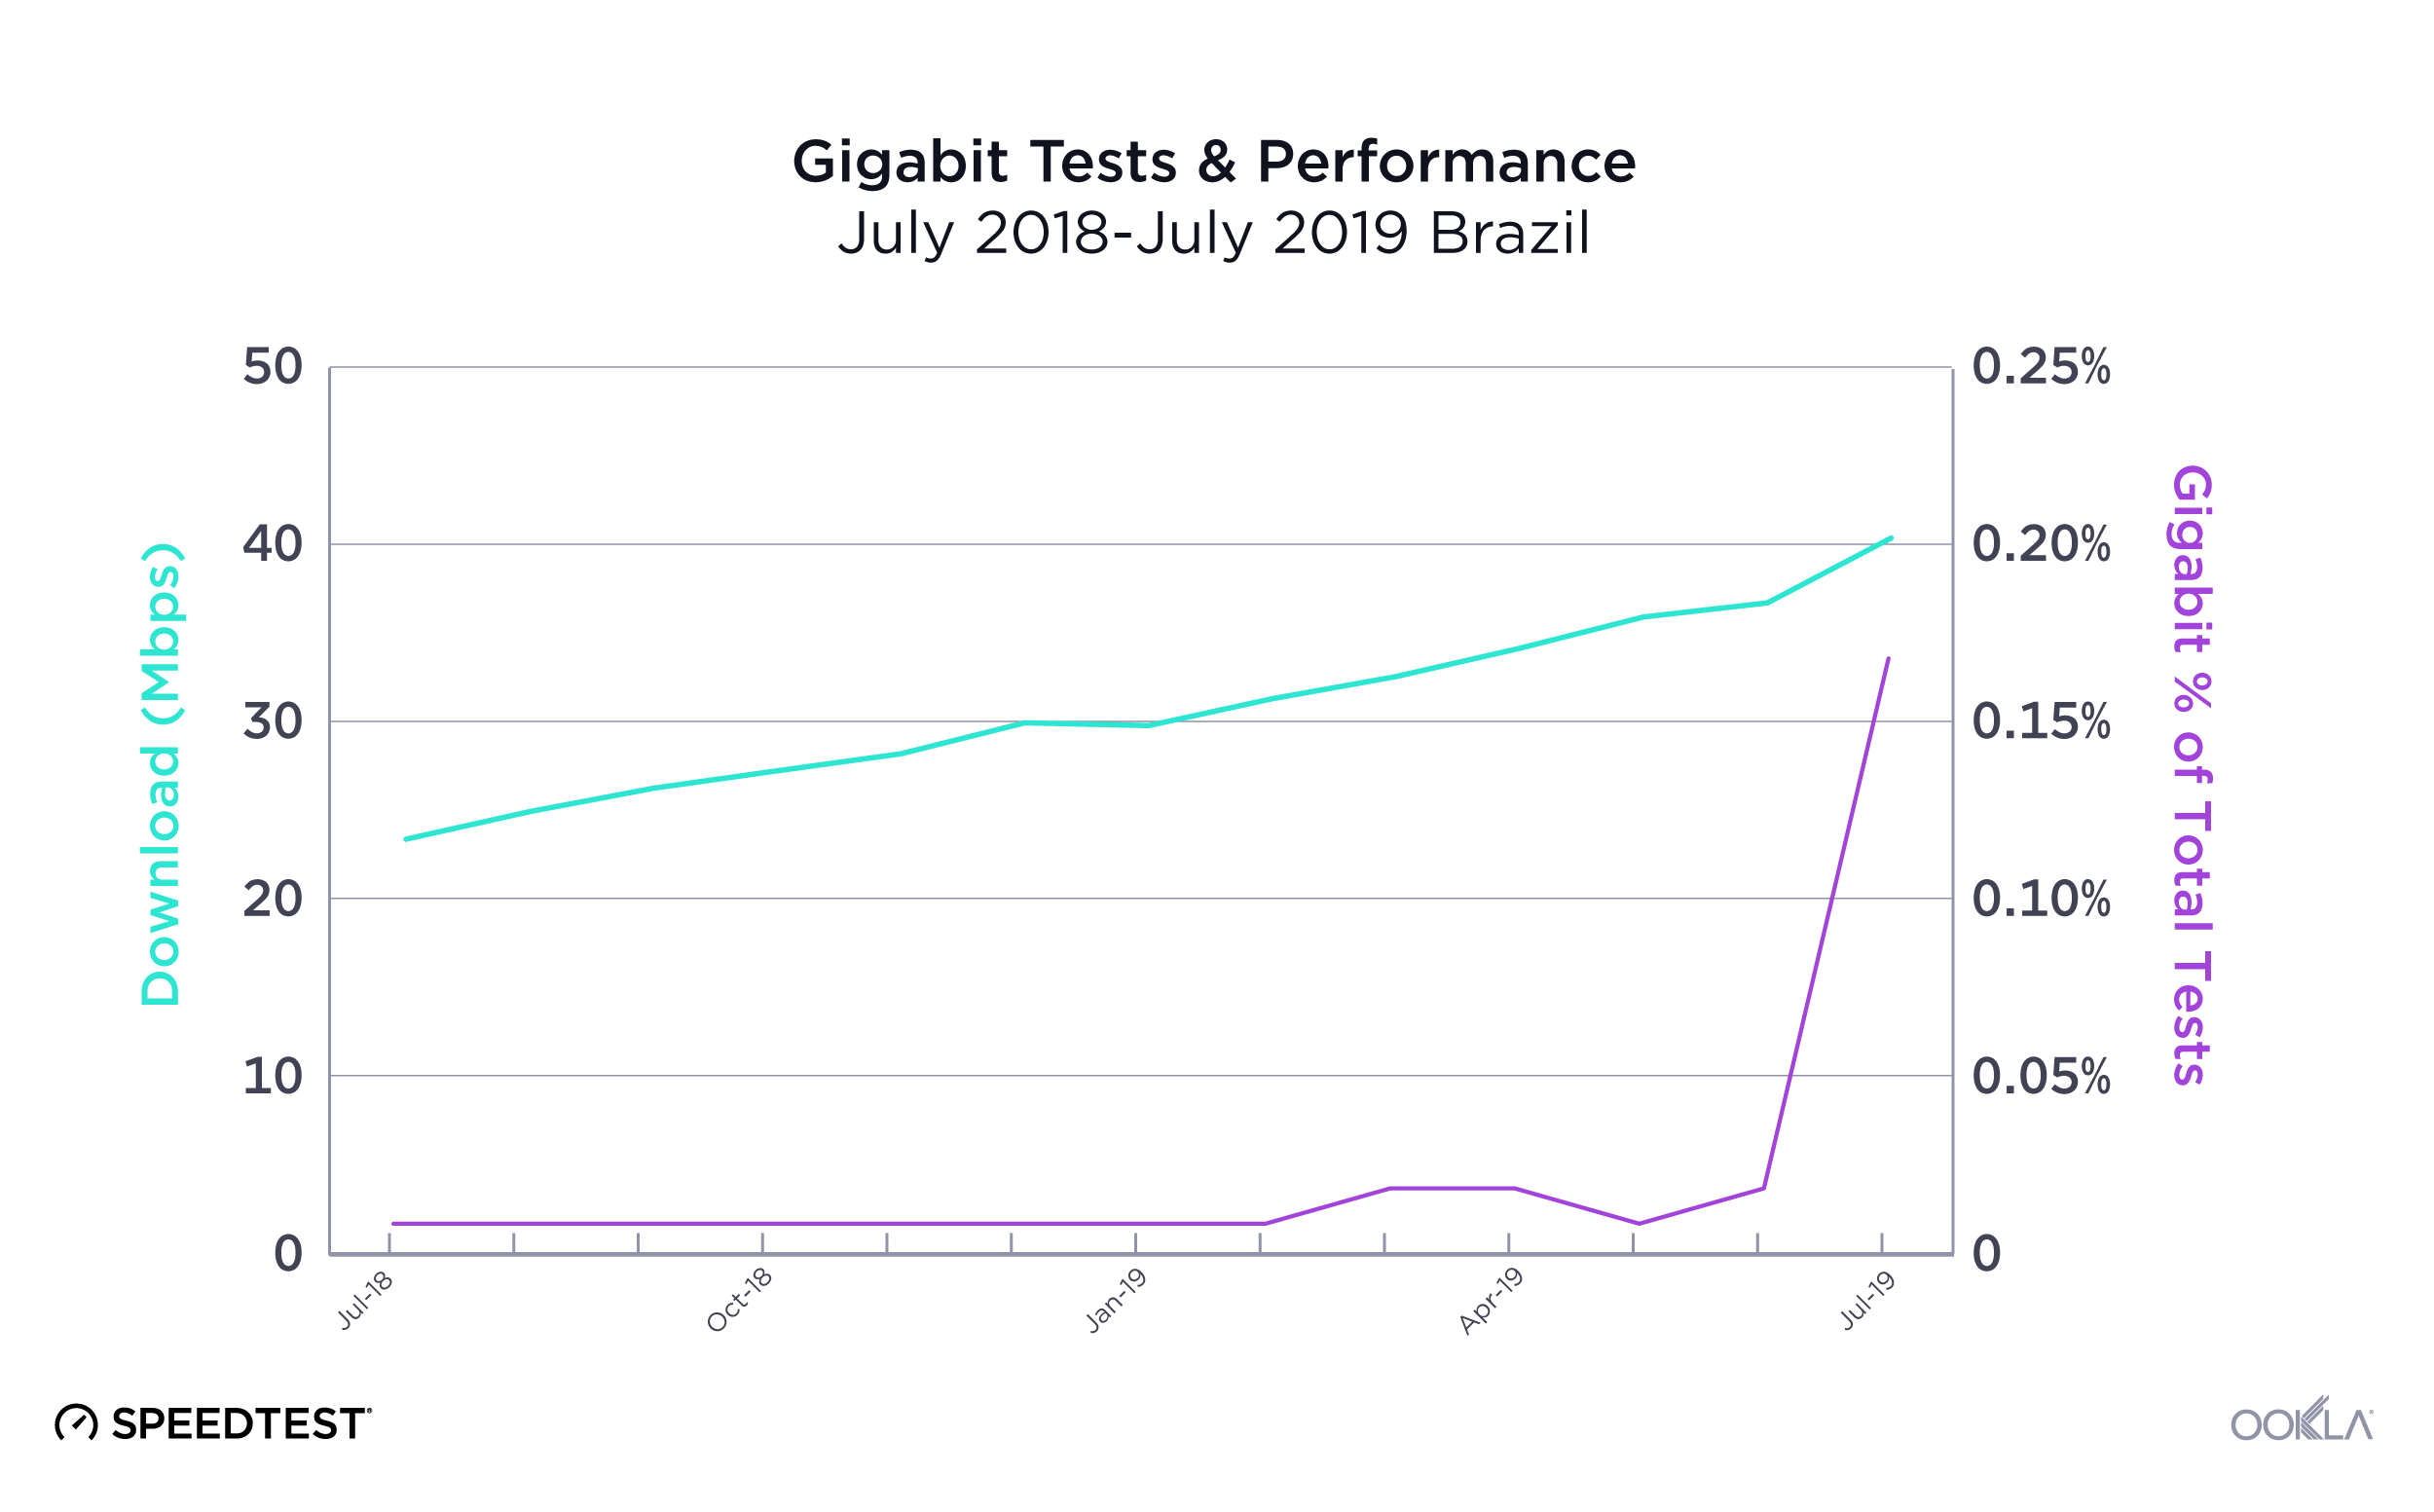
Also exciting is that cities which already had gigabit in 2017 saw increases in the number of gigabit-speed results in 2018 as ISPs continue to build out infrastructure across cities. Many cities saw their first real gigabit expansion in 2018. For example, we saw the number of gigabit tests in New Delhi increase from 119 gigabit speed results in 2017 to 20,239 in 2018, that’s a mind-boggling 16,908% increase. Chennai, India saw a 7,481% increase (from 763 to 57,840) and Cormeilles-en-Parisis, France jumped 6,480%. Huge leaps in the number of gigabit-speed results were also seen in Gdańsk, Poland (6,338%); Rome, Italy (4,909%); Lancashire, United Kingdom (3,962%); Ota, Japan (3,240%); São Paulo, Brazil (2,947%); Hangzhou, China (2,669%) and Turda, Romania (2,636%).

When people are online

point-3-sec-final-1

The internet is always on, but we were surprised to see how consistently and steeply usage fell off on both mobile and fixed broadband after 9 pm local time. Normalizing the time of day for Speedtest results from around the globe, we found that usage bottoms out at 4 am and then climbs steeply again until 10 am. From there, the internet gets gradually busier until that night time drop off.

Internet in the world’s largest countries

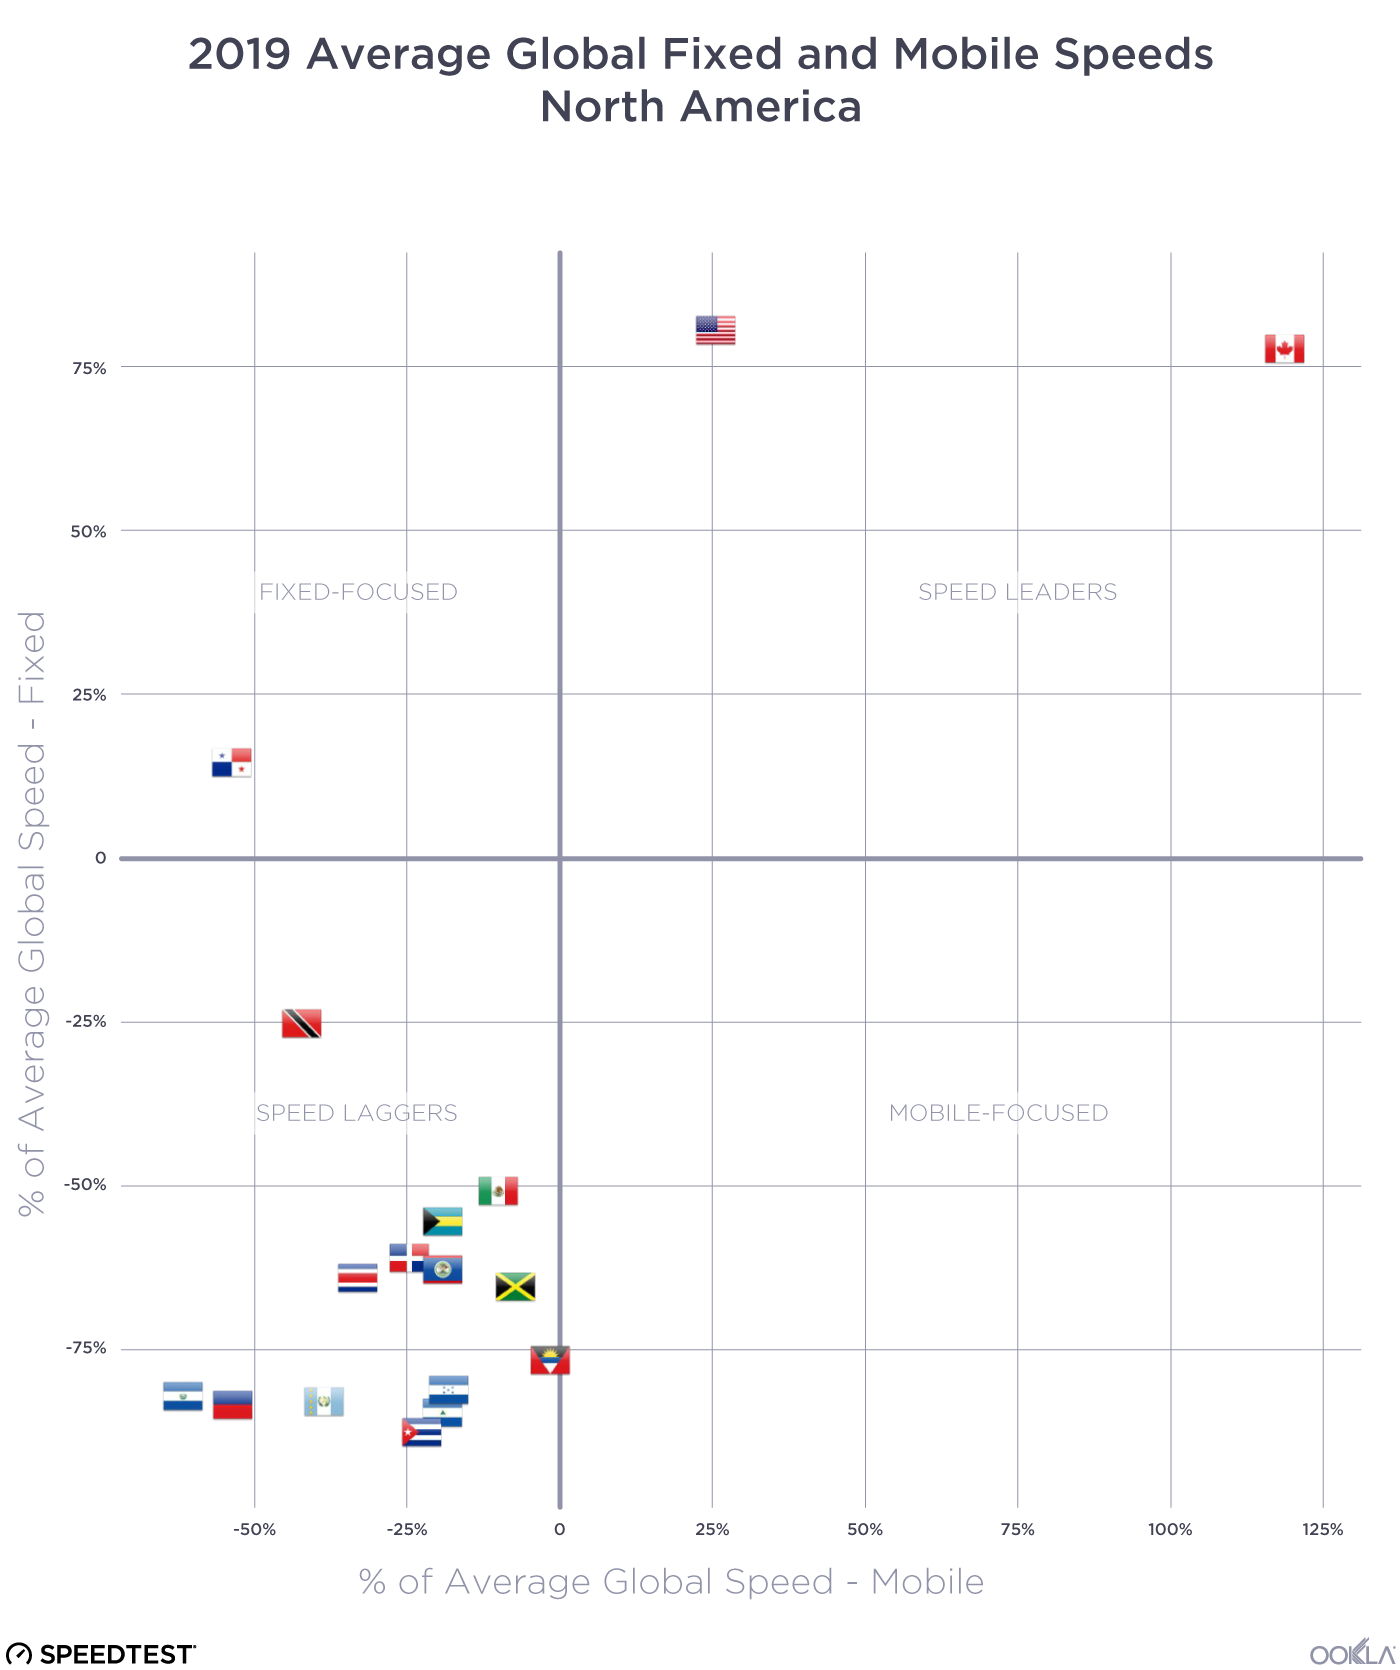
The world’s five most populous countries are notably absent from the lists of fastest and most improved countries on mobile and fixed broadband. China, India, the U.S., Indonesia and Brazil represent about 46% of the world’s population, which makes their internet speeds worth noting nonetheless.

Internet Speeds in the World’s Largest Countries
Speedtest Data | December 2017-November 2018
Country Mean Mobile Download Speed (Mbps) % Improvement in Mobile Speed Mean Fixed Download Speed (Mbps) % Improvement in Fixed Speed
China 30.96 -5.8% 76.03 42.5%
India 9.11 15.2% 23.00 50.4%
United States 28.50 22.3% 92.77 37.3%
Indonesia 10.39 5.3% 14.89 18.3%
Brazil 18.65 29.3% 22.95 39.4%

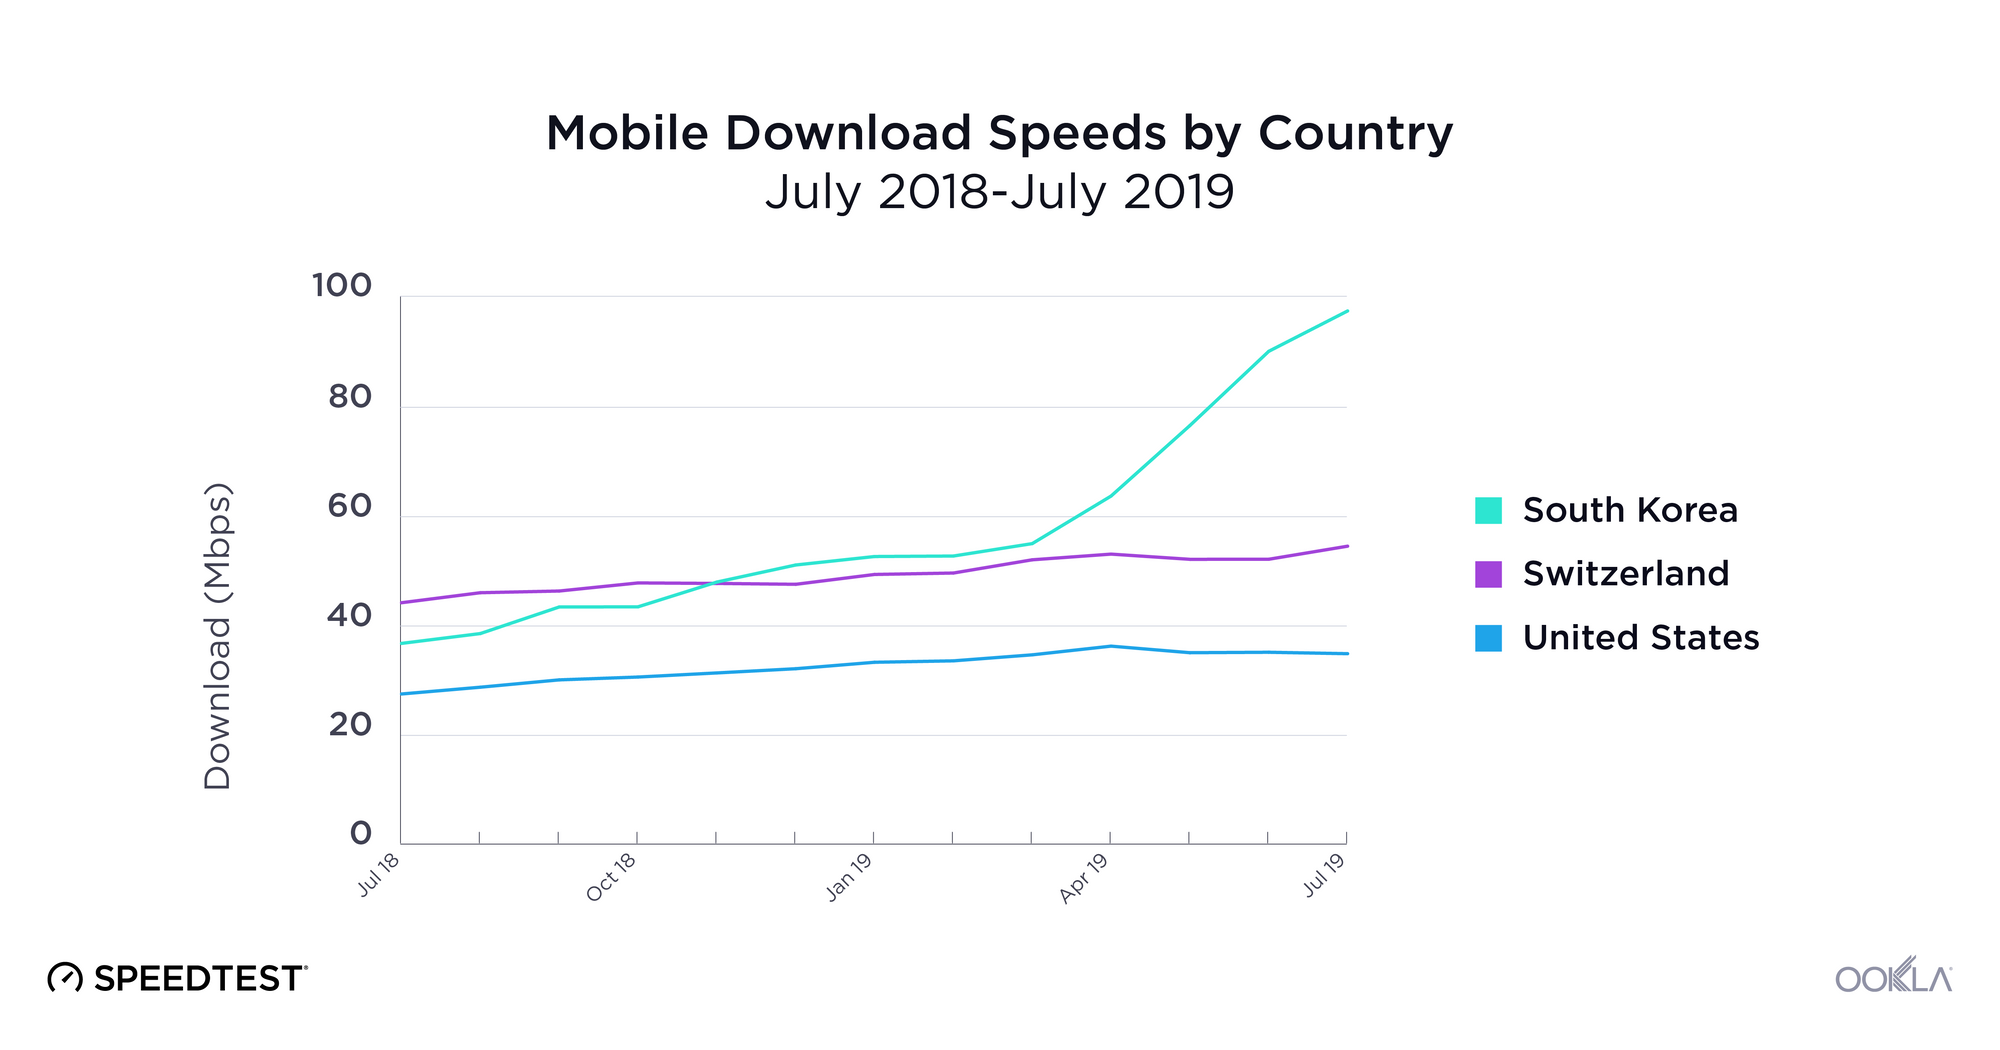
Mobile internet speeds in the world’s largest countries

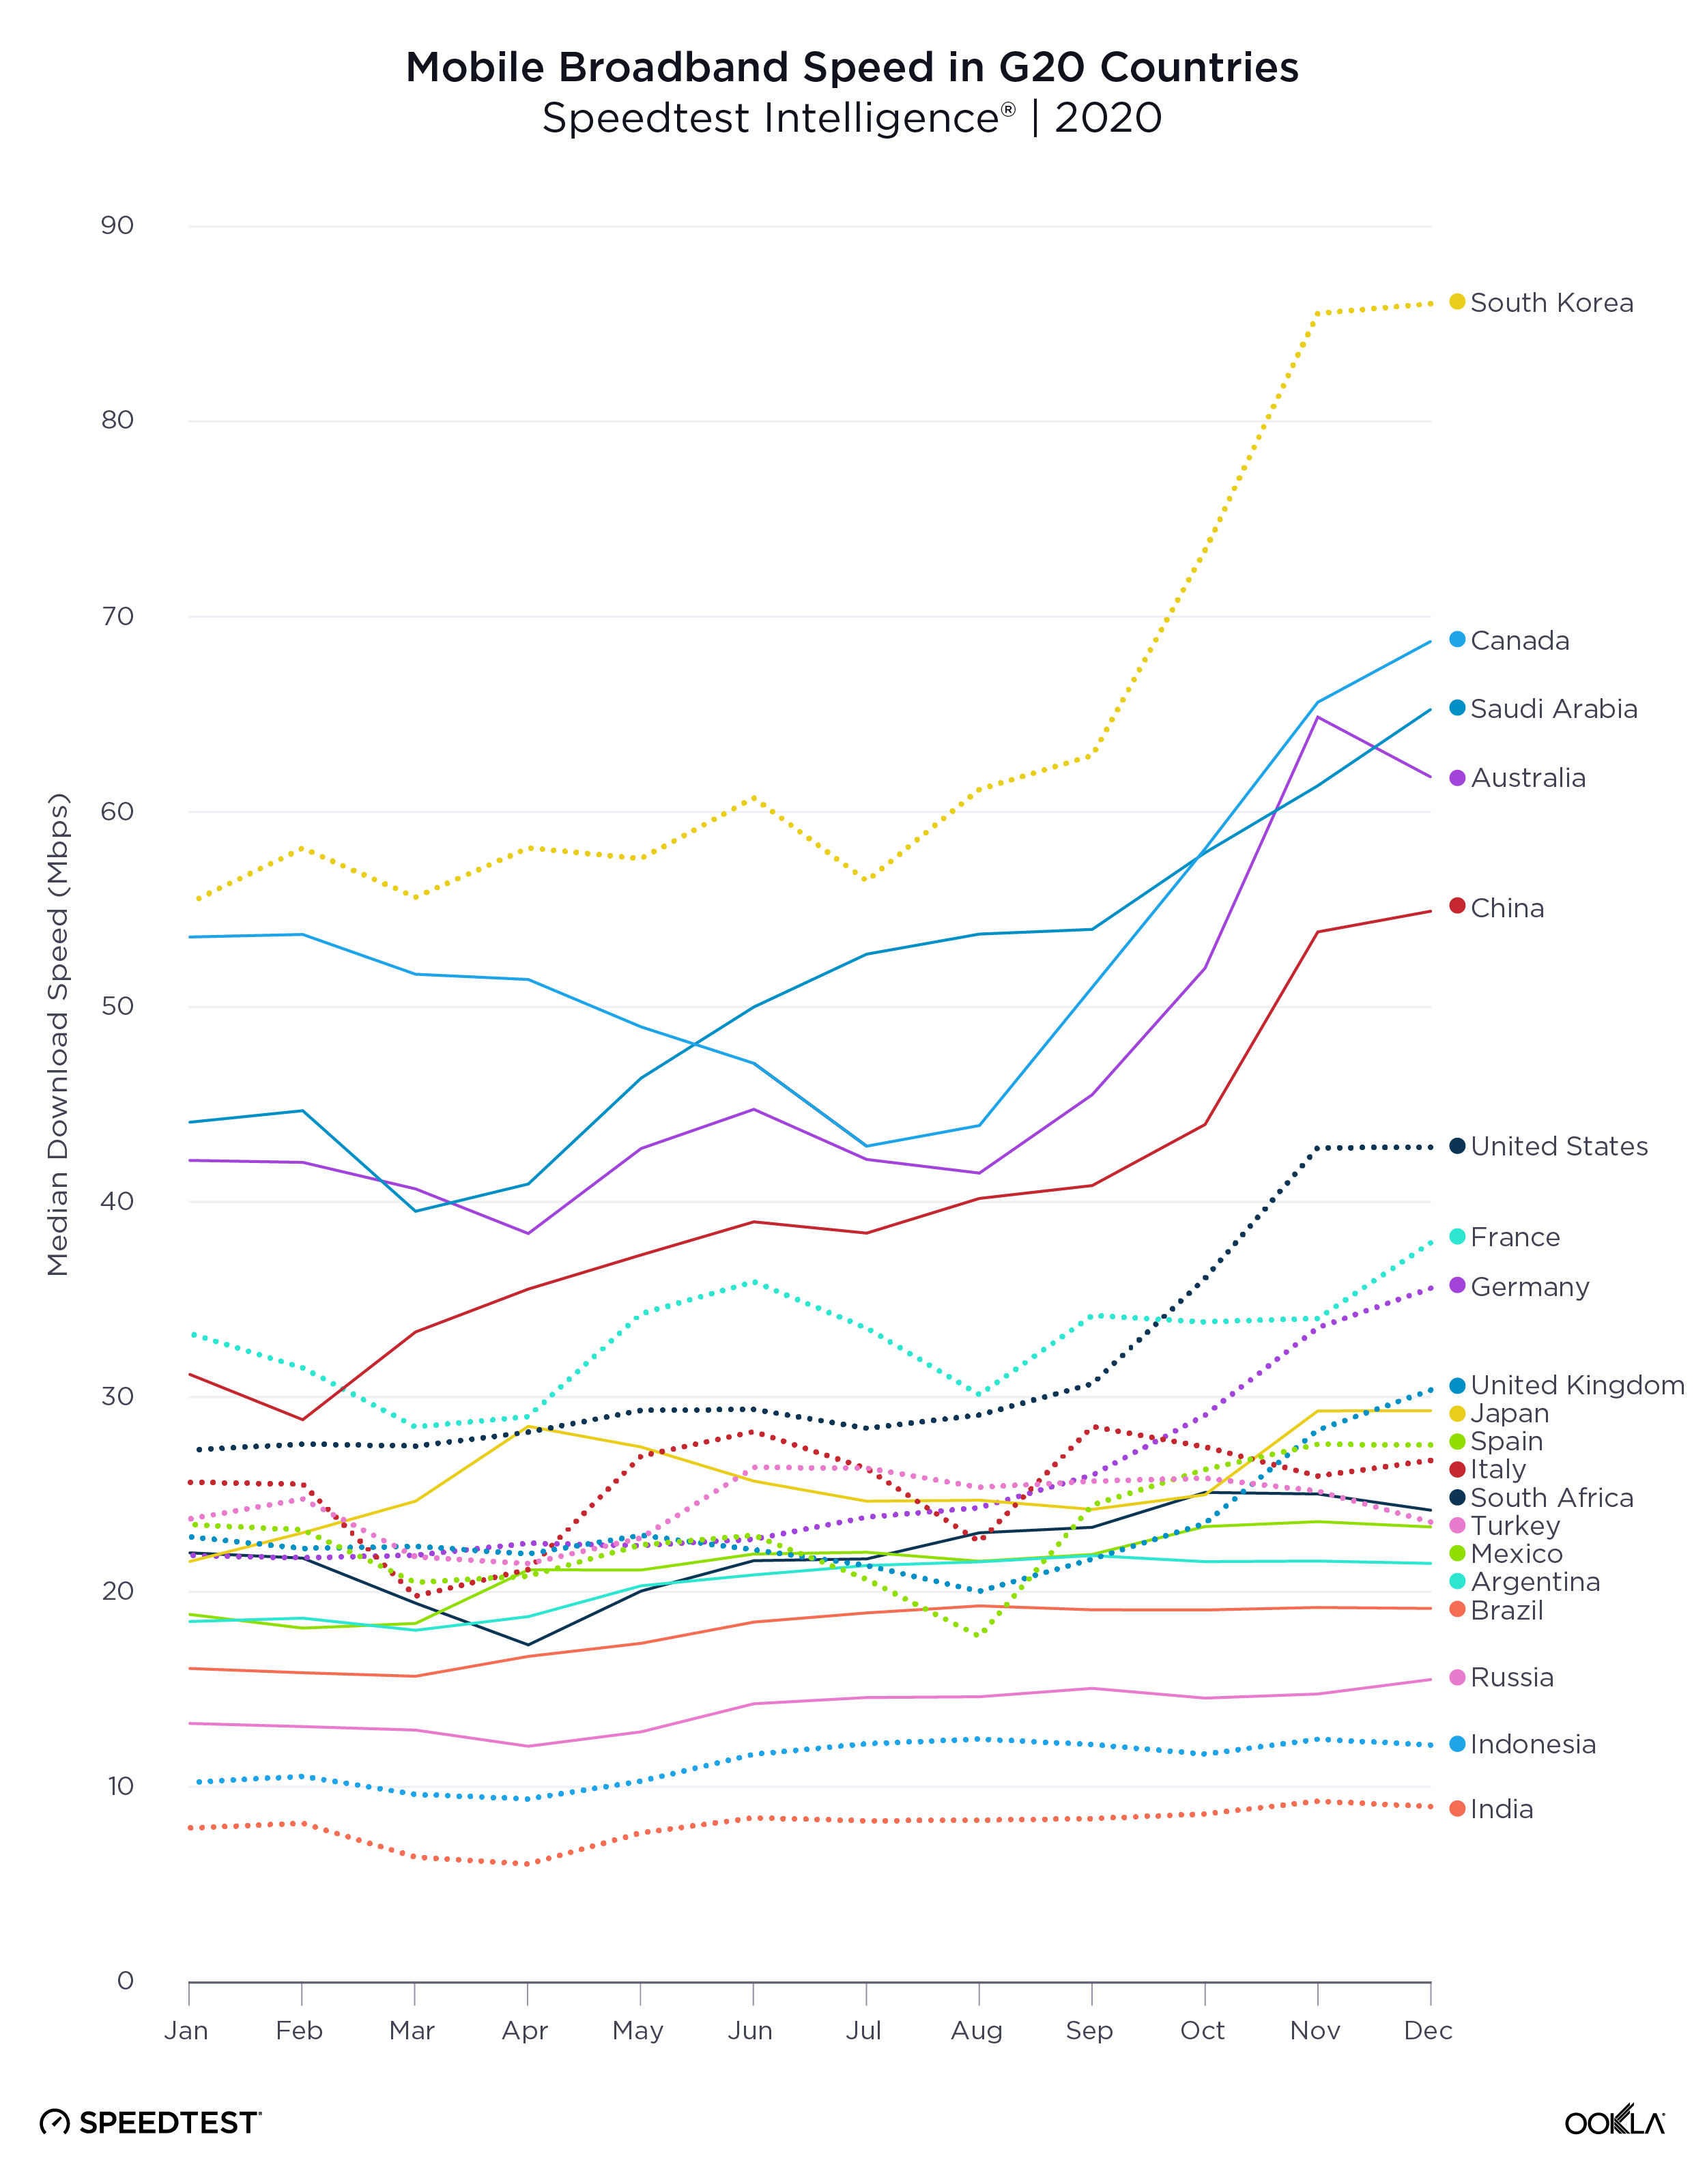
China had the fastest average mobile download speed among the world’s most populous countries in the past twelve months. However, China’s mobile download speed decreased during that time. The United States is fast catching up with China on mobile download speed.

Brazil occupied a middle ground for mobile download speed among the world’s most populous countries and showed the fastest rate of increase. India and Indonesia were at the bottom of this list. While the two nations show similar mobile download speeds to each other, India’s mobile download speed is improving much more quickly than Indonesia’s.

Fixed broadband speeds in the largest countries in the world

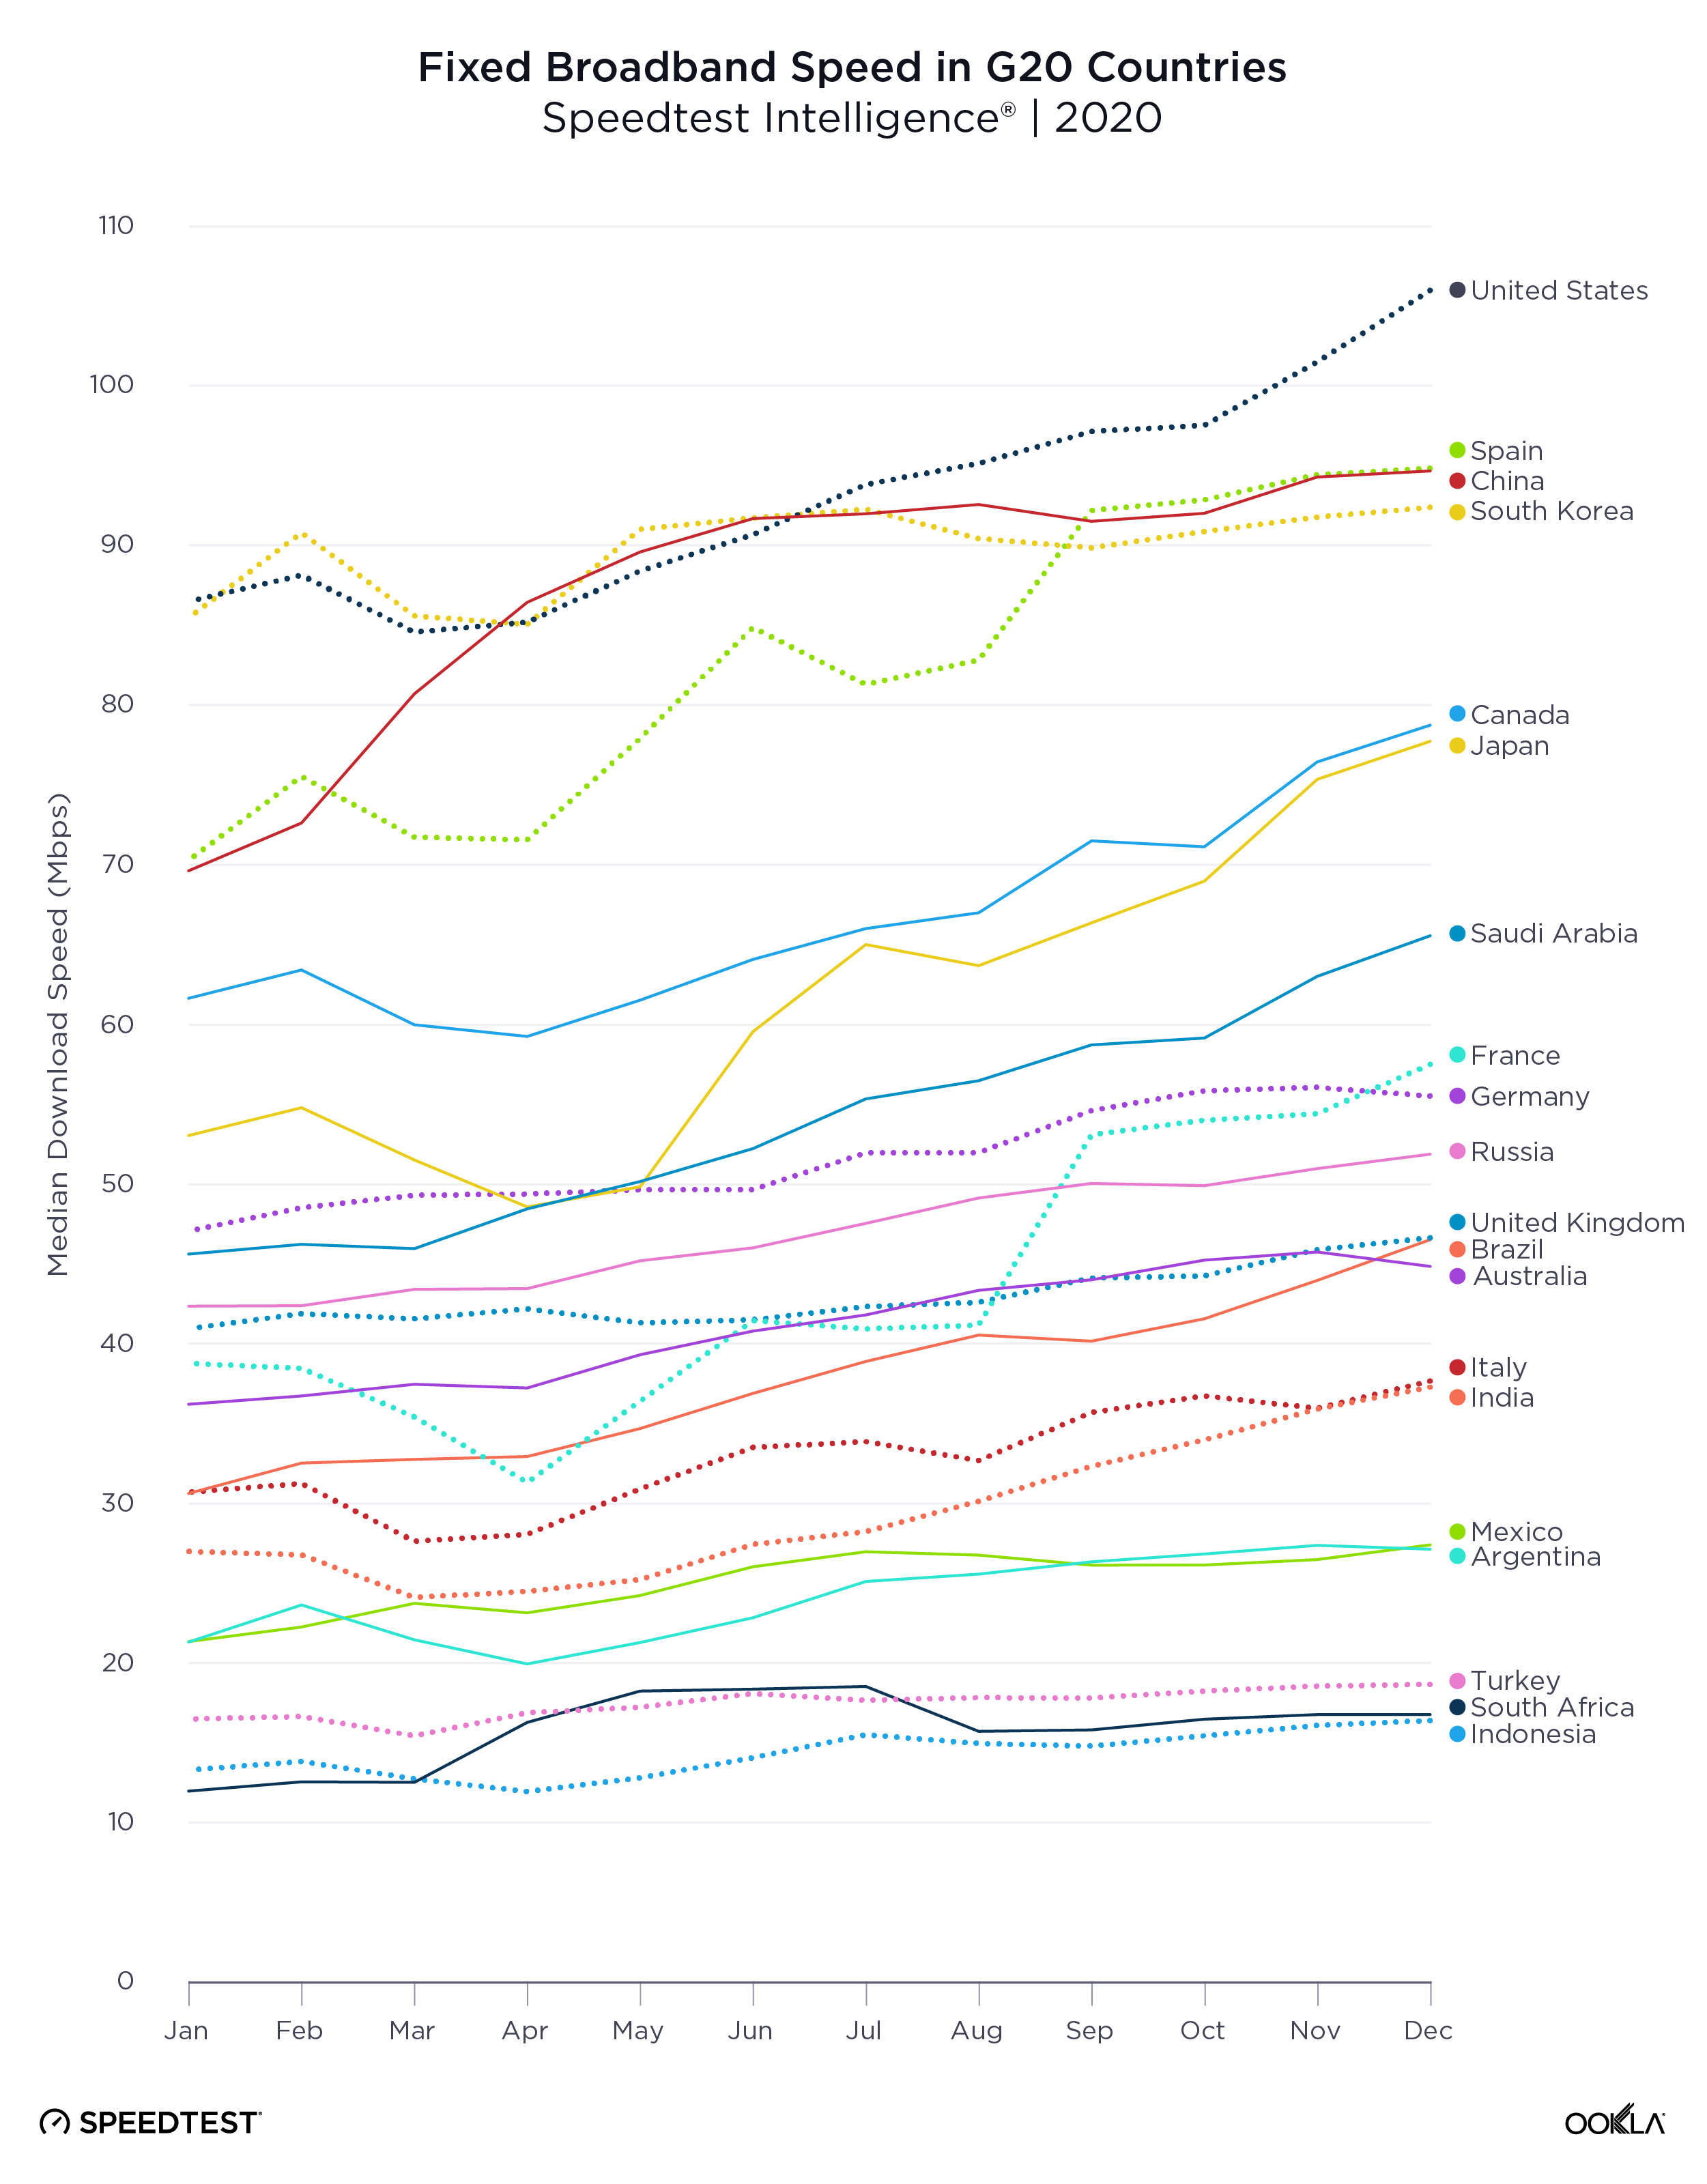
The United States showed the fastest fixed broadband download speed among the world’s most populous countries over the past year. China was second, India and Brazil nearly tie for third and Indonesia follows.

India showed the largest improvement in mean download speed over fixed broadband of the world’s five largest countries. China was second, Brazil third, the U.S. fourth and Indonesia fifth.

We’ll be back throughout 2019 to report on the state of the world’s internet as it evolves. Until then, take a Speedtest to find out how your network compares.

Ookla retains ownership of this article including all of the intellectual property rights, data, content graphs and analysis. This article may not be quoted, reproduced, distributed or published for any commercial purpose without prior consent. Members of the press and others using the findings in this article for non-commercial purposes are welcome to publicly share and link to report information with attribution to Ookla.

| September 4, 2019

In-Depth Analysis of Changes in World Internet Performance Using the Speedtest Global Index

A lot has changed in the two years since 2017 when we first began ranking mobile and fixed broadband speeds of countries around the world with the Speedtest Global IndexTM. 5G is being deployed around the world and fiber continues to make gigabit speeds a reality in more and more countries. We’ve been tracking it all and are here to report on how much speeds have increased, which countries are leading internet performance and which are falling behind, and what trends we see across continents.

World mobile speed increased 21.4% with fixed broadband up 37.4%

World-Download-Speeds-2019-OG2

Looking just at the last year, the world’s mean download speed over mobile increased 21.4% from 22.81 Mbps in July 2018 to 27.69 Mbps in July 2019. Mean upload speed over mobile increased 18.1% from 9.13 Mbps to 10.78 Mbps. The world average for download speed over fixed broadband increased 37.4% from 46.48 Mbps in July 2018 to 63.85 Mbps in July 2019. Mean upload speed over fixed broadband increased 48.9% from 22.52 Mbps to 33.53 Mbps.

Shake-ups in the country rankings for internet performance

Fastest-Countries-Mobile-2018-2019

Mobile speeds in the fastest countries have skyrocketed in the past year which has dramatically shifted the rankings. South Korea, which was not even in the top ten a year ago, saw a 165.9% increase in mean download speed over mobile during the past 12 months, in large part due to 5G. Switzerland’s mean download speed increased 23.5%. Canada’s was up 22.2%, Australia 21.2%, the Netherlands 17.3%, UAE 11.1%, Malta 10.3% and Norway 5.8%. Qatar remained in the top ten, although the country’s mean download speed over mobile actually dropped 1.4% from July 2018 to July 2019.

Individual mobile operators can make a huge difference in a country’s speeds. In 2017 we were excited to see Telenor uncap their mobile speeds, which drove Norway to the top of the Speedtest Global Index. A big part of South Korea’s mobile success in the past year is the way KT, LG U+ and SK Telecom banded together to release 5G at the same time. Switzerland has also benefited from 5G and Sunrise leads the country with 262 5G deployments across the country while Swisscomm has 52.

Fastest-Countries-Fixed-2018-2019

Fixed broadband rankings on the Speedtest Global Index have not changed as dramatically during the past 12 months as those on mobile. Singapore remains the fastest country with an increase in mean download speed over fixed broadband of 5.6%. Taiwan had the largest jump in speeds among the top 10 with a 166.5% improvement in fixed download speed between July 2018 and July 2019. Mean download speed over fixed broadband increased 52.4% in South Korea, 26.4% in Macau, 21.7% in Romania, 21.0% in Switzerland, 19.3% in the United States and 3.5% in Hong Kong.

Monaco and Andorra did not have enough tests to qualify for the Speedtest Global Index one year ago, but massive fixed broadband improvements in both countries inspired us to lower our test count threshold for inclusion and also share these smaller countries’ success stories.

Technologies paving the way: 5G and gigabit

The presence of 5G is not enough to change a market

As discussed above, 5G has the potential to rocket a country to the top of the mobile rankings on the Speedtest Global Index. In practice, we’ve seen 5G speeds that were over 1000% faster than those on LTE.

Mobile-Download-Speeds-by-Country

In reality, though, unless 5G is commercially available widely across a country and from all mobile operators (as was the case in South Korea), the change in speeds at the country level is not that significant. Though commercial 5G was launched widely across Switzerland by Sunrise and Swisscom in April 2019, the country’s mean download speed only increased 2.8% in the three months since. The average mobile download speed in the U.S. has actually declined slightly since 5G was initially deployed. This is because 5G is still only available in a very limited number of markets to consumers with 5G-capable devices.

Visit the Ookla 5G Map for the latest on 5G deployments across the globe.

Gigabit is a game-changer, if you can get it

Unlike 5G, fiber connections have been rolling out since 2007, opening up the possibility of gigabit-speed fixed broadband. That said, it’s costly and time-intensive to lay miles and miles of fiber so progress has varied widely across the globe.

Gigabit-Test---Performance_Singapore-1

Geographically small countries like Singapore have the advantage when it comes to fiber, because It’s easier and cheaper to lay fiber optic cable across the country’s small footprint. Singaporean internet service providers (ISPs) have used this advantage to go beyond mere gigabit and offer connections as fast as 10 Gbps. This is reflected both in Singapore’s dominance of the fixed rankings on the Speedtest Global Index and in the fact that 2.87% of their total Speedtest results over fixed broadband are gigabit-speed (800 Mbps or higher).

Gigabit-Test---Performance_Brazil-1

Brazil offers a good contrast for how difficult it can be for gigabit to reach the masses. While the first Brazilian ISP to offer fiber-to-the-premises (FTTP) initially did so in 2007, easy access to gigabit speeds was slow to follow. However, that may be starting to change. Between June and July 2019 we saw a large uptick in gigabit-speed results in Brazil, where the proportion of gigabit speed tests increased from 0.02% of total fixed broadband tests to 0.17%. This corresponded with a large increase in mean download speed at the country level.

Comparing world mobile and fixed broadband at a glance

We were curious to see just how different internet performance experiences were around the world, so we plotted average mobile download speed against average download speed on fixed broadband. All of the graphs below use a percentage difference from the global average, a number that changed between 2018 and 2019.

fade-Performance-vs-Global---Quadrant-All

Speed Leaders

There was not much change in the list of countries that showed above-average download speeds on both mobile and fixed broadband between July 2018 and July 2019, the “Speed Leaders.” What did change was that fixed broadband speeds increased significantly enough among the group to bring the whole pack closer to Singapore and Hong Kong. On the mobile axis, South Korea’s major increase in download speed made that country more of an outlier, pushing the boundaries of what great performance can look like.

Fixed-Focused countries

Between July 2018 and July 2019 we saw the number of countries considered to be “Fixed-Focused” (having faster download speeds over fixed broadband than the world average while their average mobile download speeds were slower than average) increase. Ireland was the only country that solidly fit this category in 2018. Thailand and Chile started near the midline for fixed speeds and below-average for mobile speeds in 2018. 2019 found both countries squarely in the Fixed-Focused category. Israel also edged into this category as their mobile download speed fell between July 2018 and 2019.

Mobile-Focused countries

The “Mobile-Focused” category saw the most movement between July 2018 and July 2019 as some countries (the UAE and Qatar) increased their fixed speeds sufficiently to join the Speed Leaders. Meanwhile, Bosnia and Herzegovina’s mobile download speed increased year-over-year to move them into the Mobile-Focused quadrant. Georgia’s mobile download speed decreased enough to move them from Mobile-Focused to Speed Laggers.

It will be interesting to see how many of these Mobile-Focused countries double down on their mobile investments and explore 5G alternatives to fixed broadband.

Speed Laggers

No country wants to be in the position of having slower than average mobile and fixed broadband speeds. We saw 57 countries in this “Speed Laggers” quadrant in July 2018 and 78 in July 2019. This increase is mostly due to our expansion of the number of countries we consider for the Speedtest Global Index based on test count. There were enough countries in this category that we’ve considered them separately by continent below.

Regional views of mobile and fixed broadband performance

Mobile-and-Fixed-Broadband-Improvement-by-Continent-02

We aggregated Speedtest results by continent to analyze mobile and fixed broadband performance by continent.

Mobile-and-Fixed-Performance-by-Continent-01

Asia had the highest percentage increase in mobile download speed followed by North America, Oceania, South America, Africa and Europe. Oceania had the fastest mean download speed in July 2019. North America placed second, Europe third, Asia fourth, South America fifth and Africa sixth.

On the fixed broadband side, South America saw the highest percentage increase in download speed. Asia came in second, Europe third, Africa fourth, North America fifth and Oceania sixth. North America had the fastest mean download speed in July 2019. Europe was second, Asia third, and Oceania fourth. As we saw with mobile, South America and Africa again ranked fifth and sixth, respectively.

A zoomed-in view of the speed quadrants separated by continent offers a more detailed view of each country’s role in these rankings.

Africa mostly lags in internet speeds

2019-Performance-vs-Global---Africa

In July 2019, all but two African countries in the Speedtest Global Index fell into the Speed Laggers category, having mobile and fixed broadband speeds that were below global averages. The exceptions were South Africa and Guinea, which both had fast enough mobile speeds to place them in the mobile-focused quadrant.

Asian markets show a wide breadth of internet performance

2019-Performance-vs-Global---Asia

Asia was the most diverse continent we examined in terms of internet performance. We saw a plurality of countries in each of the four quadrants in July 2019. Most of the Speed Leaders were in East Asia: China, Hong Kong (SAR), Japan, Macau (SAR), South Korea, and Taiwan. If we include Singapore, another Speed Leader, these are among the wealthiest nations in Asia (using GDP per capita). Two of Asia’s Fixed-Focused countries are in Southeast Asia (Malaysia and Thailand) and one is in the Middle East (Israel).

The Speed Laggers category contained countries from South Asia (including Afghanistan, India and Pakistan), Southeast Asia (Brunei, Cambodia, the Philippines and Vietnam) and the Middle East (Jordan). Mobile-Focused countries in Asia were mostly Middle Eastern, including Kuwait, Lebanon, Oman, Saudi Arabia and Turkey.

European mobile performance is mostly strong, fixed varies

2019-Performance-vs-Global---Europe

With the exception of Ireland, the European countries on the Speedtest Global Index fell into the Speed Leaders, Mobile-Focused, and Speed Laggers categories. All of the Speed Laggers (Belarus, Kazakhstan, Russia and the Ukraine) were from Eastern Europe. Countries from Southeast Europe (including Albania, Bosnia and Herzegovina, Croatia, Greece, Montenegro, Moldova, Serbia and Slovenia) and Central Europe (Austria and the Czech Republic) made up the bulk of the Mobile-Focused category.

Speed Leaders included countries from the Baltics (Estonia, Latvia and Lithuania), the Nordics (Denmark, Norway and Sweden), Central Europe (Poland and Romania), and Western Europe (including Belgium, France, Germany, the Netherlands, and Spain).

North American internet performance is sharply divided

2019-Performance-vs-Global---North-America

Canada and the U.S. are the only two North American countries in the Speed Leaders category. Panama is the only North American country under Fixed-Focused. Mexico and all of the Central American countries fall into the Speed Laggers category. There are no North American countries that are Mobile-Focused.

Each country in Oceania has a very different internet story

2019-Performance-vs-Global---Ocean

Oceania is represented in three of the four quadrants: Speed Leaders (New Zealand), Mobile-Focused (Australia) and Speed Laggers (Papua New Guinea) with Fiji straddling the divide between Speed Laggers and Mobile-Focused.

South America mostly lags in mobile and fixed internet speeds

2019-Performance-vs-Global---South-America

Most of the South American countries represented on the Speedtest Global Index are in the Speed Laggers quadrant (Argentina, Bolivia, Brazil, Colombia, Ecuador, Paraguay, Peru, Suriname and Venezuela). Chile is an exception, being part of the Fixed-Focused group, as is Uruguay which sits in Mobile-Focused.

Global internet speeds are improving on average and 5G and gigabit are compounding those advances where available. However, not all countries are benefitting equally. We’ll be interested to see how 5G continues to push mobile speeds in the next year and also whether 5G Wi-Fi becomes a game changer for fixed broadband. Remember to check the Speedtest Global Index on a monthly basis for updated country rankings. And take a Speedtest to make sure your experience is represented in your country’s averages.

Editor’s Note: This article was edited on September 10, 2019 to correct an error in the labeling on the first image. The colors in a later image were updated for consistency.

Ookla retains ownership of this article including all of the intellectual property rights, data, content graphs and analysis. This article may not be quoted, reproduced, distributed or published for any commercial purpose without prior consent. Members of the press and others using the findings in this article for non-commercial purposes are welcome to publicly share and link to report information with attribution to Ookla.

| March 13, 2020

Tracking COVID-19’s Impact on Global Internet Performance (Updated July 20)

We are no longer updating this article as internet speeds in most countries have stabilized to pre-pandemic levels. For ongoing information about internet speeds in specific countries, visit the Speedtest Global IndexTM or contact our press team.

Ookla® closely monitored the impact of COVID-19 on the performance and quality of global mobile and broadband internet networks in the early days of the pandemic. We shared regular information based on Ookla data to assist in the understanding of this unprecedented situation. You can still download the July 20, 2020 CSV here which contains all the public data we tracked in this article. If you are looking for information on internet or online service outages, please check Downdetector®.

Ookla retains ownership of this article including all of the intellectual property rights, data, content graphs and analysis. This article may not be quoted, reproduced, distributed or published for any commercial purpose without prior consent. Members of the press and others using the findings in this article for non-commercial purposes are welcome to publicly share and link to report information with attribution to Ookla.

| January 4, 2021

Slack Starts the New Year Late


2021 started with a sigh today as workers across the globe rushed back to their desks only to find that Slack was down. Users flocked to Downdetector® to report problems with Slack across the globe just after 7:00 a.m. Pacific. Issues were reported in Asia (Japan), Australia, Europe (Finland, France, Germany, Italy, the Netherlands, Poland, Russia, Spain, Sweden and the United Kingdom), North America (United States and Canada) and South America (Brazil). The most frequently reported issue was the inability to connect at all and the majority of reports came from the U.S.

Downdetector_Slack_Outage_1020

Although the spike has passed and the outage seems to be resolving itself, the service is not fully operational yet. Now might be a good time to take a breath and catch up on all that post-holiday email. The little red notification will be back on your desktop soon enough.

Downdetector data can help your team resolve service issues faster and improve customer experience when an outage occurs, which becomes all the more important during periods of high usage. Contact us here to learn how your network operations center can get faster outage detection.

Ookla retains ownership of this article including all of the intellectual property rights, data, content graphs and analysis. This article may not be quoted, reproduced, distributed or published for any commercial purpose without prior consent. Members of the press and others using the findings in this article for non-commercial purposes are welcome to publicly share and link to report information with attribution to Ookla.

| January 12, 2021

2020 Recap: How the Internet Held Up During a Global Pandemic


There was major concern last year that the internet might fail under the pressure of increased use as COVID-19 drove unparalleled waves of remote work and schooling. We watched internet performance carefully using data from Speedtest Intelligence® as conditions changed in different areas of the world. Now we’re back to assess what happened during the year as a whole.

A note on the methodology: 5G launches drove up mean internet speeds on mobile in many countries. For this reason we’ve simplified our view to include only median speeds, which are less subject to being skewed by especially fast 5G tests.

Mobile speeds dipped in many G20 countries in the spring of 2020

Mobile-Broadband-Speeds-in-G20-Countries_0121

Median download speeds over mobile in many G20 countries dropped at some point during 2020. Countries that saw month-to-month declines during the spring include: Australia, Canada, France, India, Italy, Saudi Arabia, South Korea, Spain and Turkey. China saw a decline in mobile speed in February while Japan suffered a drop in June and July. Argentina, Brazil, Indonesia, Russia and the United Kingdom showed only very minor decreases, while speeds in Germany, Mexico, South Africa and the United States remained unchanged or increased.

Despite the drops, almost all G20 countries saw higher median download speeds over mobile in December 2020 than they had in January 2020. Median download speed over mobile increased 76.3% in China during that time. Germany saw a 62.8% increase, the United States 56.9%, South Korea 55.5% and Saudi Arabia 48%. Turkey saw a 0.7% decrease in median download speed over mobile during the same period.

Despite interim dips, fixed broadband improved in all G20 countries during 2020

Fixed-Broadband-Speeds-in-G20-Countries_0121

There were notable dips in median download speeds over fixed broadband in many countries during the spring of 2020. G20 countries that saw these declines on a monthly basis include: Argentina, Canada, France, India, Indonesia, Italy, Japan, South Korea, Spain, Turkey and the United States. Brazil, China, Germany and Russia notably showed only increases in month-to-month median download speed over fixed broadband during this time. Other countries showed only very minor decreases.

Perhaps most important, all G20 countries saw higher median download speeds over fixed broadband in December 2020 than they had in January 2020. Median download speed over fixed broadband increased 51.9% in Brazil during that time. France saw a 48.3% increase, Japan 46.5%, Saudi Arabia 43.7% and South Africa 40%. South Korea saw the smallest increase in median download speed over fixed broadband over the same period at 8.1%.

We are impressed, on the whole, with how well the internet held up to the massive scale of increased use during the past year. Of course, month-by-month, country-level views are averages that might not reveal problems with specific mobile operators or internet service providers on individual days. If you want to assess how your internet connection is performing right now, take a Speedtest®. And if you are unable to connect to a specific service on the internet, check Downdetector® to see the status of that service.

Ookla retains ownership of this article including all of the intellectual property rights, data, content graphs and analysis. This article may not be quoted, reproduced, distributed or published for any commercial purpose without prior consent. Members of the press and others using the findings in this article for non-commercial purposes are welcome to publicly share and link to report information with attribution to Ookla.

| December 14, 2021

Find Out if 5G is Worth the Upgrade: A Multi-Country Analysis

The holidays are nearly here and with them the desire to treat yourself or a loved one to an upgraded phone, just because. The first question you’re likely to ask yourself as you browse new models is “To 5G or not to 5G?” Once you check the Ookla 5G Map to see if your operator has deployed 5G in your area, you’ll probably want to know if the 5G speeds are worth the extra cost. We’ve analyzed Speedtest Intelligence® data from the most popular Android and iPhone devices around the world during Q3 2021 to help you see if it’s worth the upgrade. Click a country from the list to jump down to the related analysis.

Australia | Bahrain | Canada | China
France | Japan | Saudi Arabia | South Africa
South Korea | United Arab Emirates | United Kingdom | United States
Our analysis includes data on the five 4G Android devices in each country with the largest number of results during Q3 2021 as well as the five most popular 5G-capable Android devices. We have also compared the iPhone 13 to the iPhone 11. Even the fastest device can only perform at the level of the network it’s on. For that reason, speeds for the same device vary widely from country to country in the data below. Remember that speeds can also vary within a country and the performance you see will depend on the infrastructure in your area.

Australia

5G Samsung devices more than twice as fast as most popular 4G devices in Australia

Although only a year separates the release of the Samsung Galaxy S10 series and the S20 series devices, the latter were definitely faster in Australia during Q3 2021. Even the slowest 5G-capable device on this list, the Galaxy S20+ 5G was much faster than the fastest 4G phone, the Galaxy S10+.

ookla_android_performance_australia_1121-01

iPhone 13 wallops iPhone 11 for speed in Australia

Australians who recently upgraded their iPhone 11 for an iPhone 13 would have seen a more than 4X increase in median download speed during Q3 2021. If speed is your number one concern, this upgrade is necessary.

ookla_iphone_performance_australia_1121-01

Bahrain

5G Samsung variants live up to the hype in Bahrain

Fewer 5G-capable phones made our list in Bahrain during Q3 2021 due to sample counts, but those that did roundly outperformed the most popular 4G devices. The median download speed of 5G-capable devices on this list was more than two times faster than the median for 4G devices on this list.

ookla_android_performance_bahrain_1121-01

iPhone 12 85% faster than iPhone 11 in Bahrain

There weren’t sufficient samples to analyze performance of the brand new iPhone 13 in Bahrain during Q3 2021, but median download speed on the iPhone 12 was 85.0% faster than that on the iPhone 11.

ookla_iphone_performance_bahrain_1121-01

Canada

Not all 5G Android devices offer a massive improvement in Canada

Q3 2021 data from Canada shows that 5G isn’t the only way to get a fast connection. While the fastest 5G-capable device among the top five most popular (the Samsung Galaxy S21 Ultra 5G) offered very fast median download speeds, two 4G devices (the Note10+ and the S10+) were nearly as fast as the slowest 5G-capable device on this list (the S20 Fan Edition 5G). To upgrade or not is definitely a question here of which device you are upgrading from and which you plan to upgrade to.

ookla_android_performance_canada_1121-01

iPhone 13 more than three times as fast as the iPhone 11 in Canada

Canadians looking for fast mobile performance on Apple devices will enjoy an upgrade to the iPhone 13 whose median download speed in Q3 2021 was more than three times as fast as that on the iPhone 11.

ookla_iphone_performance_canada_1121-01

China

5G offers major advantages on Android in China

There is no question as to whether consumers with one of the five most popular 4G Android devices would see faster speeds with one of the five most popular 5G Android devices. The 4G devices on this list saw median download speeds in the 22.00 to 34.00 Mbps range during Q3 2021 while the 5G-capable devices showed median download speeds between 155.87 Mbps (Xiaomi Mi 10 5G) and 280.22 Mbps (Huawei Mate 40 Pro 5G).

ookla_android_performance_china_1121-01

iPhone 13 more than ten times faster than iPhone 11 in China

China was home to the largest performance increase when comparing the iPhone 11 to the iPhone 13. Median download speed on the iPhone 13 was more than ten times faster during Q3 2021 than on the iPhone 11. Some of this difference may reflect market conditions where users in more rural areas have older phones and poorer infrastructure, but it’s still an impressive difference.

ookla_iphone_performance_china_1121-01

France

French 5G offers a decent speed boost on Android

The most popular 4G devices in France showed median download speeds between 37.67 Mbps (Samsung Galaxy S8) and 51.36 Mbps (S20 Fan Edition) during Q3 2021. These were easily topped by the 5G-capable devices which showed median download speeds of 73.73 Mbps (Xiaomi Mi 10T Pro 5G) to 92.10 Mbps (Xiaomi Mi 11 5G).

ookla_android_performance_france_1121-01

iPhone 13 more than three times faster than iPhone 11 in France

French consumers who upgraded from the iPhone 11 to the iPhone 13 during Q3 2021 would have tripled their median download speed potential on the 5G-capable iPhone 13.

ookla_iphone_performance_france_1121-01

Japan

Android 5G devices are faster in Japan, but not always fast

The most popular 4G devices in Japan during Q3 2021 were much slower than the most popular 5G-capable devices. Speedtest Intelligence showed median download speeds on 4G devices ranging from 19.75 Mbps (Xiaomi Redmi Note 9S) to 26.57 Mbps (Oppo Reno A). Even the slowest 5G-capable device on this list, the Xiaomi Mi 11 Lite 5G at 43.63 Mbps, was 56% faster than the fastest 4G devices. However, the fastest 5G-capable device on this list, the Sony Xperia 1 II 5G, was twice as fast as that at 94.85 Mbps.

ookla_android_performance_japan_1121-01

iPhone 13 more than twice as fast as iPhone 11 in Japan

In Japan, the median download speed of the iPhone 13 was more than twice as fast as that over the iPhone 11 during Q3 2021. This was one of the smallest differences in performance between the iPhone 11 and 13 that we saw in our analysis.

ookla_iphone_performance_japan_1121-01

Saudi Arabia

5G Android devices are much faster than 4G in Saudi Arabia

Median download speeds on the most popular 5G-capable devices were fast in Saudi Arabia compared to most other markets. 5G-capable speeds ranged from 174.43 Mbps for the Samsung Galaxy S20 Ultra 5G to 261.21 Mbps for the S21 Ultra 5G. 5G is definitely worth the upgrade in Saudi Arabia.

ookla_android_performance_saudi-arabia_1121-2-01

iPhone 13 was more than five times faster than the iPhone 11 in Saudi Arabia

Not only did Saudi Arabia show the second fastest median download speed over iPhone 13 during Q3 2021, the iPhone 13 was also more than five times faster than the iPhone 11.

ookla_iphone_performance_saudi-arabia_1121-01

South Africa

5G shows a small improvement over 4G on Android in South Africa

The most popular 4G devices in South Africa showed a wide range of median download speeds during Q3 2021, from 18.00 Mbps (Huawei P20 Lite) to 40.69 Mbps (Samsung Galaxy Note10+). South Africa’s median download speeds on the most popular 5G devices were among the lowest we saw, from 43.09 Mbps on the Samsung Galaxy Note20 5G to 67.09 Mbps on the S21 Ultra 5G.

ookla_android_performance_south-africa_1121-01

iPhone 12 was almost twice as fast as the iPhone 11 in South Africa

There weren’t sufficient samples in South Africa to analyze the iPhone 13, so we compared the iPhone 12 to the iPhone 11. The median download speed on the iPhone 12 was almost twice as fast as that on the iPhone 11 during Q3 2021.

ookla_iphone_performance_south-africa_1121-01

South Korea

4G Android devices in South Korea are fast, 5G even faster

The median download speeds we saw on the most popular 4G devices in South Korea during Q3 2021 rivaled the 5G speeds in South Africa with speeds ranging from 53.74 Mbps on the Samsung Galaxy Note8 to 60.41 Mbps on the S9+. However, median performance on 5G-capable devices was even faster. There was a wide variety in speeds among the most popular 5G-capable with the S10 5G showing a median download speed of 102.61 Mbps and the S21 Ultra 5G coming in at 221.18 Mbps. 5G is worth the upgrade in South Korea and consumers have a variety of high-performing devices to choose from.

ookla_android_performance_south-korea_1121-01

iPhone 12 more than three times faster than iPhone 11 in South Korea

South Korea did not have enough samples from the new iPhone 13, so we compared the iPhone 12 to the iPhone 11. Not only was the iPhone 12 more than three times faster for median download speed than the iPhone 11 during Q3 2021, South Korea’s iPhone 12 download speed beat iPhone 13 download speed in five of the countries we analyzed: Canada, France, Japan, U.K. and the U.S.

ookla_iphone_performance_south-korea_1121-01

United Arab Emirates

U.A.E. had the fastest speeds on Android 5G devices

While the median download speeds across 4G devices in the U.A.E. during Q3 2021 handily beat those of all the other countries in this analysis, the country’s 5G download speeds were even faster. We can see from this data that some of the 4G devices can perform much better when on a faster network. Even the slowest 4G device on this list, the Huawei P30 Pro, had a median download speed of 68.26 Mbps in U.A.E. compared to 30.20 Mbps in the U.K. on the same device.

ookla_android_performance_uae_1121-2-01-1

A similar story can be told for 5G devices where the U.A.E. was competing only with Saudi Arabia and South Korea for the fastest median performance on devices listed during Q3 2021. The Samsung Galaxy S21 5G showed a median download speed of 285.39 Mbps in the U.A.E. compared to 215.10 Mbps in South Korea while the Galaxy S21 Ultra 5G showed a median download speed of 269.09 Mbps in the U.A.E. and 261.21 Mbps in Saudi Arabia.

iPhone 13 more than four times faster than iPhone 11 in U.A.E.

Not only did the U.A.E. have the fastest median download speed over iPhone 13 that we saw in this analysis, the 485.59 Mbps download speed was faster than any phone in any country that we analyzed in Q3 2021. The iPhone 13 capitalized on fast 5G in the U.A.E. to have a median download speed that was more than four times faster than that of the iPhone 11.

ookla_iphone_performance_uae_1121-01

United Kingdom

5G represents a solid improvement over 4G on Android devices in the U.K.

Consumers upgrading from one of the most popular 4G devices in the United Kingdom to one of the most popular 5G-capable devices would have seen a 2-3X increase in median download speed during Q3 2021. This is in part because the 4G devices on this list were slower in the U.K. than elsewhere in the world during Q3 2021 as 4G speeds have stagnated in the U.K. For example, the Samsung Galaxy S8 showed a median download speed of 24.20 Mbps in the U.K., 37.67 Mbps in France and 46.31 Mbps in Canada. All five of the 5G-capable devices that we analyzed in both the U.S. and the U.K. were faster in the U.K. during Q3 2021.

ookla_android_performance_uk_1121-01

iPhone 13 more than five times faster than the iPhone 11 in the U.K.

Our analysis of Speedtest Intelligence data from Q3 2021 showed that the iPhone 13 had a median download speed that was more than five times faster than that on the iPhone 11. This makes the iPhone 13 very much worth the upgrade if speed is your main concern.

ookla_iphone_performance_uk_1121-01

United States

5G Android devices were twice as fast as 4G in the U.S.

The most popular 4G devices in the U.S. were about half as fast for median download speed as the most popular 5G-capable devices during Q3 2021. The Samsung Galaxy S21 Ultra 5G showed the highest median download speed among these devices at 69.78 Mbps, compared to the fastest 4G device surveyed, the Note10+ at 35.98 Mbps. That said, 5G-capable devices in the U.S. underperformed when compared to other countries, except Japan and South Africa.

ookla_android_performance_us_1121-01

iPhone 13 nearly three times as fast as the iPhone 11 in the U.S.

Data from Speedtest Intelligence reveals that median download speed on the iPhone 13 was nearly three times as fast as that on the iPhone 11 in the U.S. during Q3 2021.

ookla_iphone_performance_us_1121-01

Our analysis shows that increased speed is one of the benefits of upgrading your 4G phone to a 5G-capable one, regardless of where you live but not all countries see the same speed increases. Customers in Saudi Arabia, the U.A.E, China and South Korea will see especially good performance if upgrading an Android phone. The U.A.E., Saudi Arabia, China and Australia have especially good speeds on the iPhone 13. Whatever choice you make for your next phone, take a Speedtest® on Android or iOS to make sure your mobile operator is delivering the speeds you want to see.

Ookla retains ownership of this article including all of the intellectual property rights, data, content graphs and analysis. This article may not be quoted, reproduced, distributed or published for any commercial purpose without prior consent. Members of the press and others using the findings in this article for non-commercial purposes are welcome to publicly share and link to report information with attribution to Ookla.

| December 18, 2019

A Global Look at Mobile Modem Market Share and Device Performance

Analysts discuss the latest devices all the time, but rarely is enough attention paid to the phone’s real powerhouse — the modem. We were interested to see how market share for modem manufacturers divides up on a global level, so we investigated device data from Speedtest IntelligenceTM during Q3 2019. We also looked at how popular phones performed in different markets, including a look at 5G phones in 5G countries.

Global modem market share

Ookla_Global-Modem-Market-Share_1219-2

Speedtest data showed Qualcomm was the most common modem manufacturer in 133 countries during Q3 2019 — the highest market share was in Hong Kong with 73.6% of the devices analyzed showing Qualcomm modems. Qualcomm’s slimmest majority was in Botswana with 25.6% of devices analyzed showing Qualcomm modems.

This is not surprising as Qualcomm chipsets power many flagship devices sold around the world. In the U.S., virtually all Android OEMs use Qualcomm-powered chipsets. The latest Qualcomm Snapdragon 855+ mobile platform with Snapdragon X24 integrated LTE modem (up to 2Gbps) powers popular devices from Samsung, LG and OnePlus. It’s worth noting that Qualcomm has multi-year licensing deals with multiple OEMs based in China, namely Vivo, OPPO, Lenovo, Xiaomi and OnePlus, providing their complete modem-to-antenna solutions for optimal RF performance. This includes valuable RF Front End (RFFE) components such as power amplifiers, envelope trackers, RF switches, filters and antenna tuners.

These OEMs also have access to Qualcomm’s first and second generation 5G modems. As of right now, Qualcomm is also the only chipset manufacturer providing modem-to-antenna solutions for 5G millimeter wave (mmWave) deployments, providing all-in-one mmWave antenna modules that contain radio transceiver, RFFE and phased array antenna.

Intel was the most common modem manufacturer in 32 counties during Q3 2019. The highest percentage of devices with Intel modems was seen in Greenland at 55.6%. Intel’s slimmest majority was in South Africa with 28.6% of devices analyzed showing Intel modems. Intel’s main customer in the smartphone space is Apple. Starting in 2016, Apple began powering some iPhone devices with Intel’s flagship LTE chipsets, and since 2018, all iPhones have Intel’s cellular chipsets.

Samsung was the most common modem manufacturer in 16 countries during Q3 2019. South Korea had the highest percentage of devices with Samsung modems at 53.8%. Samsung’s slimmest majority was in Mozambique with 29.1% of devices analyzed powered by Samsung modems. Samsung’s Exynos LTE modem is seen in variants of Samsung’s Galaxy S and Note devices. Except in the Americas and China, most of Samsung’s flagship S10 and Note 10 devices around the world are powered by Samsung’s own Exynos 982x SoC (system on a chip), with an integrated LTE Category 20 modem capable of download speeds of up to 2 Gbps.

Speedtest data showed HiSilicon as the most common modem manufacturer in two countries during Q3 2019. In Costa Rica, 32.4% of devices analyzed showed HiSilicon modems, and in Namibia that number was 27.6%. HiSilicon is a semiconductor company based in Shenzhen and fully owned by Huawei. Huawei integrates its own flagship modem into its flagship P and Mate series devices. These devices have a large user base in Europe, the Middle East and Asia.

Device performance is affected by market factors

A phone’s performance is always going to depend on the conditions within its specific market. Factors affecting network performance can include: geography, cell site and population density, the amount of wireless spectrum deployed and the overall capabilities of user equipment seeded to market. Multiple factors can impact the performance of a device, including: varying degrees of RF transparency in the materials used for device chassis, variations in RF front-end and antenna design complexity and whether the baseband processor is more or less capable of handling network tasks. We used Speedtest data to analyze how three popular phones — the Apple iPhone Xs, the Huawei Mate 20 Pro and the Samsung Galaxy S10 — performed in specific markets around the world during Q3 2019. We excluded data from devices with fewer than 100 samples in a market during the period.

Mean-DL-Speeds-on-Flagship-Phones

The Samsung Galaxy S10 was the fastest of these three devices in all but five markets during Q3 2019. However, the mean download speed on the Galaxy S10 varied between 18.06 Mbps in India and 95.91 Mbps in Canada. The Huawei Mate 20 Pro showed the fastest mean download speed of these three devices in France and the U.K. during Q3 2019 and often placed second in the remaining markets on the list. Mean download speed on the Mate 20 Pro during Q3 2019 ranged from 14.57 Mbps in India to 93.66 Mbps in Canada.

Apple’s iPhone Xs was at a slight disadvantage in this comparison, as it came out in 2018 where the other devices debuted in 2019. Because the iPhone 11 was not fully seeded to markets in Q3 2019, we considered its predecessor, the iPhone Xs, in this analysis. The iPhone Xs showed the fastest mean download speed in Germany, Japan and Nigeria during Q3 2019. Mean download speeds on the iPhone Xs varied from 15.92 Mbps in India to 71.72 Mbps in Canada.

Device performance in 5G markets

5G currently offers the pinnacle of mobile performance. We looked at 5G-capable devices in markets where 5G exists to see how download speeds compare. These results include Speedtest results on all technologies, not just 5G, which means averages also reflect consumers using 5G phones with a 4G connection.

Mean-DL-Speeds-on-5G-Phones

Both the Samsung Galaxy S10 5G and the Huawei Mate 20 X 5G showed mean download speeds in excess of 200 Mbps in some markets during Q3 2019. However, there’s clearly some difference in which devices are supported by which operators, as not all operators in 5G markets are offering 5G equally (if at all). Related, the Samsung Galaxy S10 5G models sold in the U.S. and China are powered by Qualcomm’s first-generation Snapdragon X50 5G modem, while other 5G markets receive the variant powered by Samsung’s in-house Exynos 5100 5G modem.

Mobile operators continue to incentivize consumers to upgrade to newer and more capable devices to ensure a more efficient use of spectrum assets for network operators. This leads to an improved utilization of shared resources, faster overall speeds and better quality of experience.

We’re looking forward to updating these analyses as more markets adopt 5G and as newer and even faster phones are released. For more information about how our device data can help you, contact us.

Ookla retains ownership of this article including all of the intellectual property rights, data, content graphs and analysis. This article may not be quoted, reproduced, distributed or published for any commercial purpose without prior consent. Members of the press and others using the findings in this article for non-commercial purposes are welcome to publicly share and link to report information with attribution to Ookla.

| January 14, 2021

Apple has 5G! But How Fast is the iPhone 12?


Apple’s 5G-capable iPhone 12 is the latest step in the continuous cycle of new technical specifications, new network components, new (or refarmed) radio spectrums and compatible user equipment that aim to deliver enhanced 5G user experience. At Ookla®, we are fortunate to have a front-row seat to observe these advances and we were thrilled when Apple announced its first 5G devices on October 13, 2020. Given the popularity of Apple’s devices, this release marks a major milestone on the way to 5G becoming mainstream.

iPhone 12 launch drives spikes in 5G testing

The daily count of unique devices worldwide that are capable of connecting to 5G jumped dramatically when each new iPhone 12 variant launched. We saw a 138.3% increase when comparing the day the iPhone 12 5G and iPhone 12 Pro 5G were released to the mean of the previous week. On the day the iPhone 12 Mini 5G and iPhone 12 Pro Max 5G launched, there was a further 44.3% increase over that one-day spike.

Daily-Trend_5G-Capable-Devices_Year_0121-1

Pro 5G and Pro Max 5G are the most popular iPhone 12 models

We examined Speedtest® results from the launch date of each model through the end of the year to see which iPhone 12 models are the most popular in 15 major cities across the globe. We found that most Speedtest users have opted for the “Pro” models. The iPhone 12 Pro Max 5G showed the highest number of samples among iPhone models in Singapore, Dubai, Hong Kong, New York, Riyadh and Sydney. The iPhone 12 Pro 5G showed the most samples in London, Madrid, Rome, Helsinki, Zürich, Berlin, Amsterdam, Seoul and Tokyo. While the more affordable models were less popular than the Pro models across all the cities on our list, the iPhone 12 Mini saw the most adoption in Tokyo and the iPhone 12 5G saw the most adoption in Rome.

iPhone-12-Model-Popularity_0121

Seoul tops list of iPhone 12 5G speeds

We analyzed Speedtest Intelligence® data for iPhone 12 devices in the same 15 cities and found that Seoul had the fastest median speed over 5G, followed by Dubai and Riyadh. Seoul also had the fastest upload speed by a considerable margin. This is not a surprise given reports that there are more than 100K 5G base stations in South Korea. It is interesting to note that European cities are relatively close to each other in terms of median download and upload speeds. That is good news for the 5G action plan of the European Commission and their target of having uninterrupted 5G coverage on major terrestrial transport paths by 2025.

iPhone-12-5G-Median-Speeds_0121

Each of these markets utilizes its own unique approach to 5G. Today, the United States is the only market where iPhone 12 models support 5G high-bands, namely n260 and n261. This is to support existing commercial 5G deployments in the mmWave spectrum across all three Tier 1 operators.

Elsewhere on the globe mid-band (specifically the 3300-3800 MHz range in most countries) is the most common frequency range for initial 5G roll-outs. There are several reasons for this, ranging from principles of electromagnetic wave propagation to marketing strategies. High-band frequency ranges (above 24 GHz with 400-800 MHz contiguous bandwidth) can do wonders in terms of download speeds, but due to limited propagation characteristics, it can be challenging to provide a mmWave coverage layer across entire markets. In order to mitigate this well-known challenge, operators tend to rely on the lower frequency bands for coverage and selectively deploy mmWave applications in targeted areas (such as high-traffic locations).

Depending on market dynamics and spectrum availability, most providers choose non-standalone (NSA) 5G configuration with an LTE anchor. Operators with limited amounts of FR1 spectrum tend to use dynamic spectrum sharing (DSS), a feature which allows both LTE and New Radio (NR) operation on the same slice of spectrum at the same time. This feature enables a relatively easy deployment of 5G coverage layers, and is a stepping stone to standalone 5G (5G SA). In addition to these commonly observed strategies, a few operators are considering pushing the limits of digital convergence with open radio access networks (RAN).

No matter which strategy an operator chooses, one important fact about 5G does not change: access to a trio of low, mid and high bands and a strategy for rolling out 5G SA is critical. Deployment of the 5G SA core unlocks the potential of enhanced mobile broadband (eMBB), ultra-reliable low latency communication (uRLLC) and massive machine type communications (mMTC).

Operator breakdown: iPhone 12 performance in select cities

5G deployments vary greatly from country to country, depending on spectrum allocated and the particular channel bandwidths each operator has deployed. This makes comparisons between countries difficult, as these factors directly impact the peak 5G speeds achievable in that market. However, looking at four major cities, we can see that performance by operator also varies.

iPhone-12-5G-Median-Speeds_Seoul_0121

In Seoul, the fastest city for 5G on the list above, the 3.5 GHz (Band n78) is used with 80 to 100 MHz channels per operator, and B2C mmWave (which would add a whopping 800 MHz channels per operator) is on the horizon. Here, LG U+ showed the fastest median download speed over 5G on the iPhone 12 in Seoul at 625.03 Mbps. SK Telecom was second and KT third.

iPhone-12-5G-Median-Speeds_Hong-Kong_0121

The three Hong Kong mobile operators that launched commercial 5G networks on April 1, 2020 ranked fastest for iPhone 12 5G median download speed rankings in Hong Kong. China Mobile HK, the only 5G network provider in Hong Kong that has acquired 3.3 GHz (3380-3400 MHz) and 3.5 GHz (3400-3460 MHz) continuous bandwidth spectrum was the fastest of these three at 212.77 Mbps. CSL and 3 Hong Kong were a close second and third, respectively. SmarTone, which launched its 5G network a month later, was fourth.

iPhone-12-5G-Median-Speeds_Amsterdam0121

The 3.5 GHz band is not yet available in the Netherlands, but this did not slow down Dutch operators in launching their commercial 5G networks in 2020. According to Speedtest Intelligence data, KPN Mobile was comfortably at the top, with a median download speed of 211.80 Mbps over 5G using the iPhone 12 in Amsterdam during Q4 2020. T-Mobile was second and Vodafone third.

iPhone-12-5G-Median-Speeds_Madrid_0121

While Spanish operators currently benefit from the n78 band, the next step is expected to be the delayed addition of low bands (700 MHz). In Madrid, Vodafone showed the fastest median download speed over 5G using the iPhone 12 during Q4 2020 at 232.51. Orange was second fastest, Yoigo third and Movistar at fourth.

We will continue to monitor how Apple’s 5G-capable devices impact the global market. Contact us to learn more about how Speedtest Intelligence can help you understand the latest developments in your market.

Ookla retains ownership of this article including all of the intellectual property rights, data, content graphs and analysis. This article may not be quoted, reproduced, distributed or published for any commercial purpose without prior consent. Members of the press and others using the findings in this article for non-commercial purposes are welcome to publicly share and link to report information with attribution to Ookla.

| February 22, 2021

Revisiting iPhone 12 5G Performance Across the Globe


As we previously covered, the iPhone 12 is finally allowing Apple enthusiasts to connect to 5G. We’re back with fresh data to see how user adoption and new 5G rollouts have affected performance worldwide.

Unique 5G-capable device counts have leveled off

After the launch of various iPhone 12 models, the daily count of unique devices worldwide that are capable of connecting to 5G spiked significantly compared to the year as a whole. The daily trend of unique 5G-capable devices as a percentage of the whole year is dramatically higher than before the iPhone 12 models launched, but has remained relatively steady since December.
Daily-Trend_5G-Capable-Devices_Year_0221

Pro 5G and Pro Max 5G are the most popular iPhone 12 models

We looked again at Speedtest® results from the launch date of each model, this time including data through the end of January, to see which iPhone 12 models are the most popular. This time we added five additional cities for a total of 20 major cities across the globe. We still found that most Speedtest users have opted for the “Pro” models.

The iPhone 12 Pro Max 5G showed the highest number of samples among iPhone models in Bangkok, Kuwait City, Singapore, Abu Dhabi, Dubai, Riyadh, Hong Kong, New York, London, Madrid and Sydney. This was a change for both London and Madrid, which had previously had more samples from the iPhone 12 Pro 5G.

The iPhone 12 Pro 5G showed the most samples in Seoul, Zürich, Berlin, Amsterdam, Warsaw, Helsinki, Rome, Barcelona and Tokyo. While the more affordable models were less popular than the Pro models across all the cities on our list, the iPhone 12 Mini saw the most adoption in Tokyo and the iPhone 12 5G saw the most adoption in Rome and Madrid.
iPhone-12-Model-Popularity_0221

Seoul tops list of iPhone 12 5G speeds

As before, we analyzed Speedtest Intelligence® data for iPhone 12 devices in these 20 cities and found that Seoul had the fastest median speed over 5G, followed by several of the major cities of the Gulf Cooperation Council (GCC), namely Kuwait City, Abu Dhabi, Dubai and Riyadh.

It is also interesting to observe that, in the highly dynamic European market where many different network rollout approaches are possible, 5G download speeds in seven of nine European cities fell between 135-160 Mbps range on the iPhone 12. Helsinki and Warsaw were the exceptions in Europe, with 241.98 and 61.14 Mbps median download speeds, respectively.
iPhone-12-5G-Median-Speeds_0221

Operator breakdown: iPhone 12 performance in select cities

We also expanded our operator analysis to 10 cities. The following charts include median 5G speeds over iPhone 12 models of top operators with sufficient samples.

Operator rankings did not change in the four cities we previously analyzed. LG U+ in Seoul, China Mobile Hong Kong in Hong Kong and KPN Mobile in Amsterdam still had the fastest median 5G download speeds over the iPhone 12 in their local markets.
iPhone-12-5G-Median-Speeds_Seoul_0221-1

iPhone-12-5G-Median-Speeds_Hong-Kong_0221

iPhone-12-5G-Median-Speeds_Amsterdam_0221

iPhone-12-5G-Median-Speeds_Madrid_0221

Barcelona showed similar speeds by operator to those in Madrid. We could not yet determine whether Vodafone or Orange’s 5G networks were fastest for iPhone 12, but both providers had a solid lead over Movistar in both Madrid and Barcelona.
iPhone-12-5G-Median-Speeds_Barcelona_0221

United Arab Emirates was the fastest country for mobile according to the January 2021 Speedtest Global Index. As the capital and the second most populous city in the country, Abu Dhabi contributed to this average with median 5G download speeds of 396.06 Mbps on the iPhone 12 for Etisalat and 211.83 Mbps for du.
iPhone-12-5G-Median-Speeds_Abu-Dhabi_0221

In Bangkok, AIS showed the highest median 5G download speed over the iPhone 12 at 362.68 Mbps. TrueMove H followed at 242.22 Mbps. These two operators also had the highest number of Speedtest results over iPhone 12 among all operators analyzed for this article. Another popular operator in the region, DTAC, is not included in the chart due to limited iPhone 12 5G samples.
iPhone-12-5G-Median-Speeds_Bangkok_0221

Data from Speedtest Intelligence reveals that Sunrise had the fastest median 5G download speed over iPhone 12 by a considerable margin at 328.32 Mbps.
iPhone-12-5G-Median-Speeds_Zurich_0221

Telekom in Berlin comfortably had the fastest median 5G download speed over iPhone 12 at 249.16 Mbps.
iPhone-12-5G-Median-Speeds_Berlin_0221

As mentioned above, median 5G speeds over iPhone 12 lagged in Warsaw when compared with other European cities analyzed. This is likely due to the fact that the auction of 3.4-3.8 GHz bands did not take place as planned in Poland because of the pandemic. As of this analysis, Orange and T-Mobile’s 5G speeds for iPhone 12 devices were faster than Play, which trailed with 42.53 Mbps. We also saw 5G tests from Plus in Speedtest Intelligence, but the operator is not included in the above chart due to lack of iPhone 12 samples compared to other operators.
iPhone-12-5G-Median-Speeds_Warsaw_0221

We will continue to monitor how Apple’s 5G-capable devices impact the global market. Contact us to learn more about how Speedtest Intelligence can help you understand the latest developments in your market.

Ookla retains ownership of this article including all of the intellectual property rights, data, content graphs and analysis. This article may not be quoted, reproduced, distributed or published for any commercial purpose without prior consent. Members of the press and others using the findings in this article for non-commercial purposes are welcome to publicly share and link to report information with attribution to Ookla.

| August 16, 2020

Problems on the 37th Floor: Analyzing In-Building Network Performance and Coverage (Webinar)

Drive testing and walk testing are useful for capturing isolated snapshots of network performance and quality, but not efficient ways to discover where users are having problems connecting. Mobile network operators must understand where users are experiencing poor indoor network performance or a weak 5G signal to provide consumers with good quality of service. It is especially important to understand performance issues in densely populated urban areas with many tall high-rise buildings, because indoor service issues can sometimes be limited to specific floor groups.

In the upcoming Ookla® webinar, we’ll share three real-world use cases where operators in Asia can improve performance and coverage with Cell Analytics™ data on user density and traffic, indoor vs. outdoor performance and 5G network metrics.

Read on to discover how operators can monitor 5G networks and identify problem buildings and cells with crowdsourced data — and don’t miss the webinar on Wednesday, August 26 at 12:00 GMT+8 (9:30 Mumbai, 11:00 Bangkok, 12:00 Singapore/Kuala Lumpur/China, 13:00 Tokyo, 14:00 Sydney).


1. Monitor your 5G network performance and coverage as well as competitors’

As mobile network operators invest heavily in 5G, it’s critical to monitor progress and compare network coverage and performance to that of your competitors. Powered by hundreds of millions of signal measurements collected daily by Speedtest®, Cell Analytics provides intelligence about wireless service quality, RF measurements, data usage, user density, cell site locations and much more, including 5G network metrics. By tracking your own and competitors’ performance, you can understand where new 5G deployments are impacting user experience and quality of service.

5G-HK-SS-RSRP-1

3hk-5g-ss-rsrp-2

In the above example, we can see China Mobile Hong Kong provides 5G coverage over a much larger area than the 3 Hong Kong network.

2. Identify problem buildings and cells with crowdsourced data — and prioritize efforts to improve them

Cell Analytics makes it easy to identify buildings where users are experiencing issues and to prioritize which network improvements will have the most impact. By looking at user density (both indoor and outdoor), you can understand where the highest volume of users are impacted and determine which cell sites need low-cost or no-cost adjustments to improve service.

Mumbai-LTE-RSRP-1

In-Building-User-Density-Mumbai-1

In the above example, we see Nirlon Knowledge Park, a busy office park in Mumbai with very high user density, but very low LTE signal level on the Jio network. By comparing these views, Jio can discover opportunities to improve in-building performance and coverage in popular locations.

3. Analyze network performance in tall buildings, down to individual floor groups

With new z-axis views in Cell Analytics, it is possible to determine the altitudes at which users experience poor network quality or performance. By analyzing which floor groups within a building are showing network issues, you can identify good buildings for DAS or other capacity expansion.

NTTDoCoMo-LTE-Tokyo-2

In the above example, we can see that the upper floors of several buildings are experiencing poor quality on the NTT DoCoMo network in Tokyo.

To see in-depth recommendations for the operators in the above scenarios, don’t miss the webinar on August 26 at 12:00 GMT+8. If you cannot make the presentation, you can register to receive a video recording after the live event. We look forward to showing you how to leverage real-world data to make better network decisions and answering any questions you may have. Register now

Ookla retains ownership of this article including all of the intellectual property rights, data, content graphs and analysis. This article may not be quoted, reproduced, distributed or published for any commercial purpose without prior consent. Members of the press and others using the findings in this article for non-commercial purposes are welcome to publicly share and link to report information with attribution to Ookla.