| October 8, 2023

Gulf ISPs should help fiber customers upgrade and configure their Wi-Fi routers to deliver faster speeds

Gulf countries improved fiber coverage and adoption by investing in fixed infrastructure, raising entry-level speeds, and making fiber services more affordable. Their efforts paid off, as evidenced by their improved position in Ookla’s Speedtest Global Index™. However, the persistent use of legacy and underperforming Wi-Fi standards in home networks can hamper efforts to provide the best network experience to customers.

Key messages

  • Wi-Fi 4 is still prevalent in the region which limits fiber’s potential. Many customers cannot get close to headline fixed broadband speeds because of the widespread use of Wi-Fi 4. Indeed, more than one-third of Speedtest® samples during Q2 2023 were using this old Wi-Fi standard. That means that a sizable proportion of users are not utilizing broadband services to their full potential.
  • Migrating to modern Wi-Fi standards can bring significant speed gains. On average, customers who used Wi-Fi 5 had a median download speed that was more than five times higher than those on Wi-Fi 4 in Q2 2023. Likewise, the speed over Wi-Fi 6 was 1.2 times faster on average than with Wi-Fi 5. Therefore, fixed broadband subscribers in the Gulf (most of whom use fiber services) with routers that only support Wi-Fi 4 would benefit the most from a CPE (Customer Premise Equipment) upgrade.
  • ISPs should do more to ensure their customers’ routers and smartphones are configured correctly. Even if consumers in the Gulf region own modern smartphones and Wi-Fi routers, they may still unknowingly use Wi-Fi 4 due to device misconfiguration and coverage constraints. ISPs can help educate consumers about how to correctly set up their home Wi-Fi routers and offer solutions to improve their indoor connectivity in order to use the more efficient 5 GHz spectrum band.

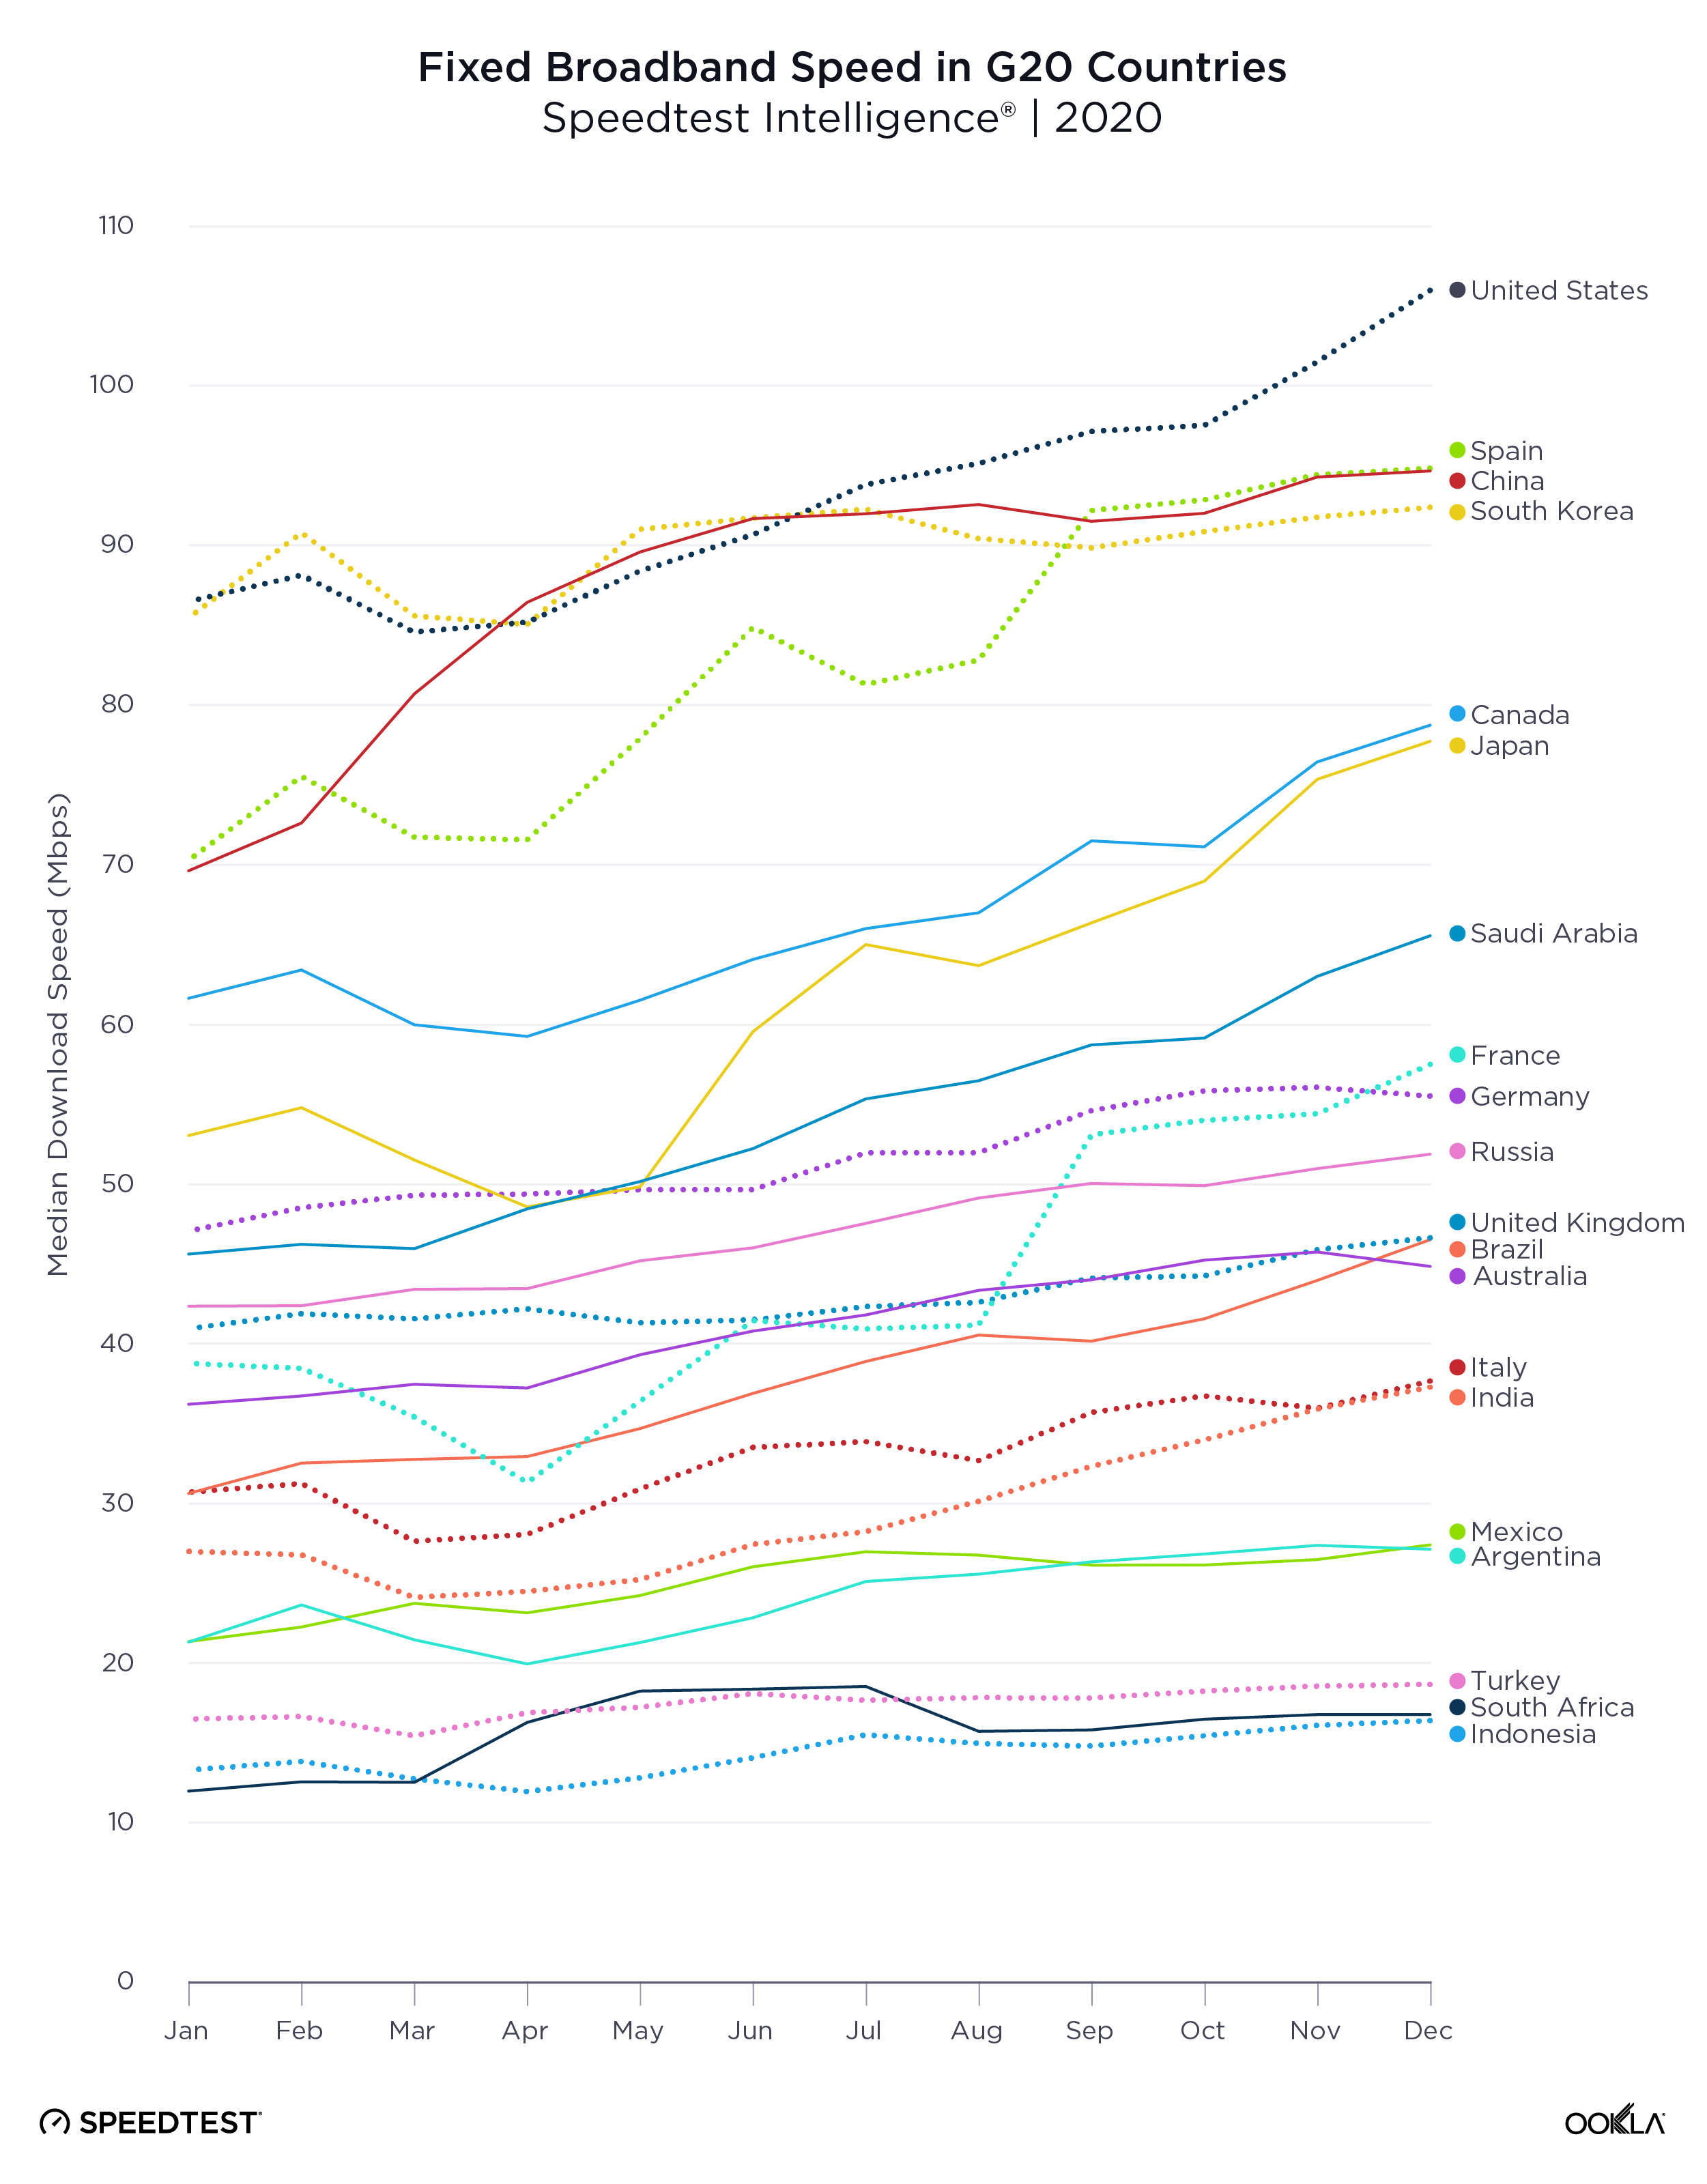
Most Gulf countries improved their global fixed broadband speed ranking since 2020

The GCC (Gulf Cooperation Council) region which comprises Bahrain, Kuwait, Oman, Qatar, Saudi Arabia, and the U.A.E. leads the Middle East in fiber coverage and adoption. Local ISPs, backed by the government, accelerated fiber roll-outs to keep pace with the demand for data services and to ensure universal access to high-speed internet as part of national broadband development strategies. According to the FTTH Council industry body, the U.A.E. topped the global rankings for fiber household coverage, reaching 98.1% in September 2022, a position it has maintained since 2016. Qatar closely followed in the second position with 97.8% coverage.

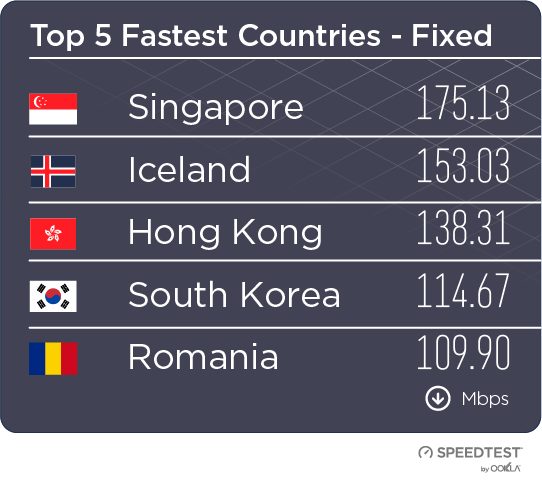
These two GCC countries ranked ahead of Singapore (96.5%), Hong Kong (91.6%), and China (89.4%). In Bahrain, meanwhile, more than 88% of households were connected to the fiber infrastructure, whereas fiber coverage exceeded 60% in Saudi Arabia and reached 52% in Oman.

According to Speedtest Intelligence®, the U.A.E. leads the Gulf region in median download speeds at 236.67 Mbps in Q2 2023, a number that doubled since Q2 2022. Bahrain saw another story of improvement, with its median download speed reaching 70.17 Mbps, an increase of 46% year-on-year since Q2 2023. ISPs also saw significant improvements in upload speeds. Fixed upload speeds increased by 61% and 40% in Oman and Qatar, respectively, reaching 29.27 Mbps and 73.21 Mbps. Users in Bahrain experienced the biggest jump in median upload speed, which doubled between Q2 2022 and Q2 2023 to 20.37 Mbps.

As a result, most Gulf countries boosted their ranking in the Ookla Speedtest Global Index™. The U.A.E was ranked second in the Speedtest Global Index™ for median download speeds over fixed broadband in June 2023. Other GCC countries improved their rankings as well but trailed the U.A.E.

The telecom regulatory regimes and policies also helped, to different degrees, stimulate competition in the market, raise minimum broadband speeds, and reduce broadband tariffs. For example, in April 2023, Bahrain’s Telecommunications Regulatory Authority (TRA) approved an offer from BNET, the wholesale fixed infrastructure provider, to double the speed of entry-level fiber packages while maintaining the same wholesale prices. In the U.A.E., Etisalat by e& and du increased minimum download speeds to 500 Mbps and offered discounts on higher-tier fiber plans in 2022. 

Wi-Fi 4 is still prevalent in the region which limits fiber’s potential

The choice of Wi-Fi standards and spectrum bands has a direct impact on connectivity quality, throughput, and network coverage. Indeed, Wi-Fi 5 (802.11ac) significantly increases the maximum theoretical throughput speed of the access point to 3.5 Gbps, compared to 600 Mbps supported by the old Wi-Fi 4 (802.11n) standard. 

Wi-Fi 6/6E (802.11ax) supports even faster maximum data rates (up to 9.6 Gbps) and lower latency than earlier generations. It also combines 2.4 GHz, 5 GHz, and 6 GHz spectrum bands and wider channels for better throughput and less interference. Note that achievable speeds in real life will be much lower than these theoretical limits because of signal attenuation, interference, and the hardware and software variety of connected devices.

The rest of the analysis focuses on the most penetrated fiber markets in the region: Bahrain, Qatar, Saudi Arabia, and the U.A.E. We used the percentage of samples that used a particular Wi-Fi standard and frequency band when connecting to the CPE as a proxy for their adoption by wired broadband customers in each country. We assume that most of the results reflect the performance of fiber services given that fiber represents the majority of fixed broadband connections in these four markets.

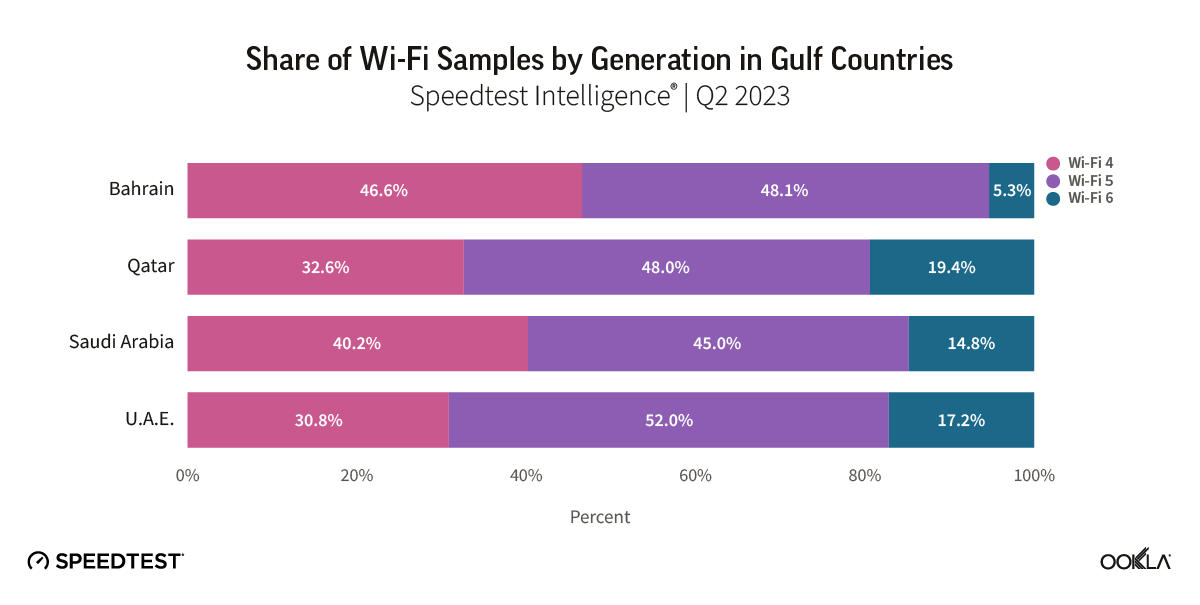
Our results show that more than one-third of test samples reported using Wi-Fi 4 to connect to the fixed CPE, but this varies considerably by country. Bahrain has the highest incidence of samples that use Wi-Fi 4 and the lowest proportion of Wi-Fi 6. Wi-Fi 4 was more prevalent in the U.A.E. than Wi-Fi 6 (30.8% compared to 17.2% in Q2 2023). This suggests that the ISPs have an opportunity to improve the network experience for nearly a third of their customer base and extend their lead in the speed leaderboard if they can address that CPE speed bottleneck.

The distribution of samples by Wi-Fi standard is largely similar between the U.A.E and Saudi Arabia. The minimum broadband speed currently offered by ISPs in Saudi Arabia is 100 Mbps, while the median download speed on fixed broadband measured by Speedtest Intelligence data was 93.85 Mbps in Q2 2023. This suggests that many customers might still be on legacy, lower-speed plans, but the more likely case is that home Wi-Fi CPEs are limiting speeds in users’ homes. Indeed, 40.2% of Speedtest samples used Wi-Fi 4 in Saudi Arabia, limiting maximum achievable speeds.

Chart of Share of Wi-Fi Samples by Generation in Gulf Countries

Migrating to modern Wi-Fi standards can bring significant speed gains

Consumer-initiated speed tests confirm that users’ experience of network speed is significantly affected by how their devices connect to Wi-Fi access points. The chart below shows the median download speed distribution by Wi-Fi standard used.

Chart of Median Download Speed by Wi-Fi Generation in Gulf Countries

Median download speeds for devices that use Wi-Fi 4 topped out at 37.18 Mbps in Bahrain, and dropped to a low of 28.47 Mbps in Saudi Arabia. Contrary to what some might think, speed improvements were far more pronounced when looking at results on Wi-Fi 4 compared to those on Wi-Fi 5, rather than comparing speeds on Wi-Fi 5 and Wi-Fi 6. Users who connected to Wi-Fi 5 had a median download speed that was more than five times higher on average than those on Wi-Fi 4. While download speeds over Wi-Fi 6 were 1.2 times faster than with Wi-Fi 5.

Wi-Fi 5 users in the UAE had the largest speed lead over Wi-Fi 4 users (6.5x). With Wi-Fi 6, median download speeds more than doubled to 251.68 Mbps for users in Qatar compared to those on Wi-Fi 5. Bahrain and Saudi Arabia were outliers, with speeds largely similar regardless of whether test samples were with Wi-Fi 5 or Wi-Fi 6. This is because these three countries have the lowest reported median download speeds (below 100 Mbps), and many users who consider upgrading from Wi-Fi 5 to Wi-Fi 6 are unlikely to see a difference in their home network performance.

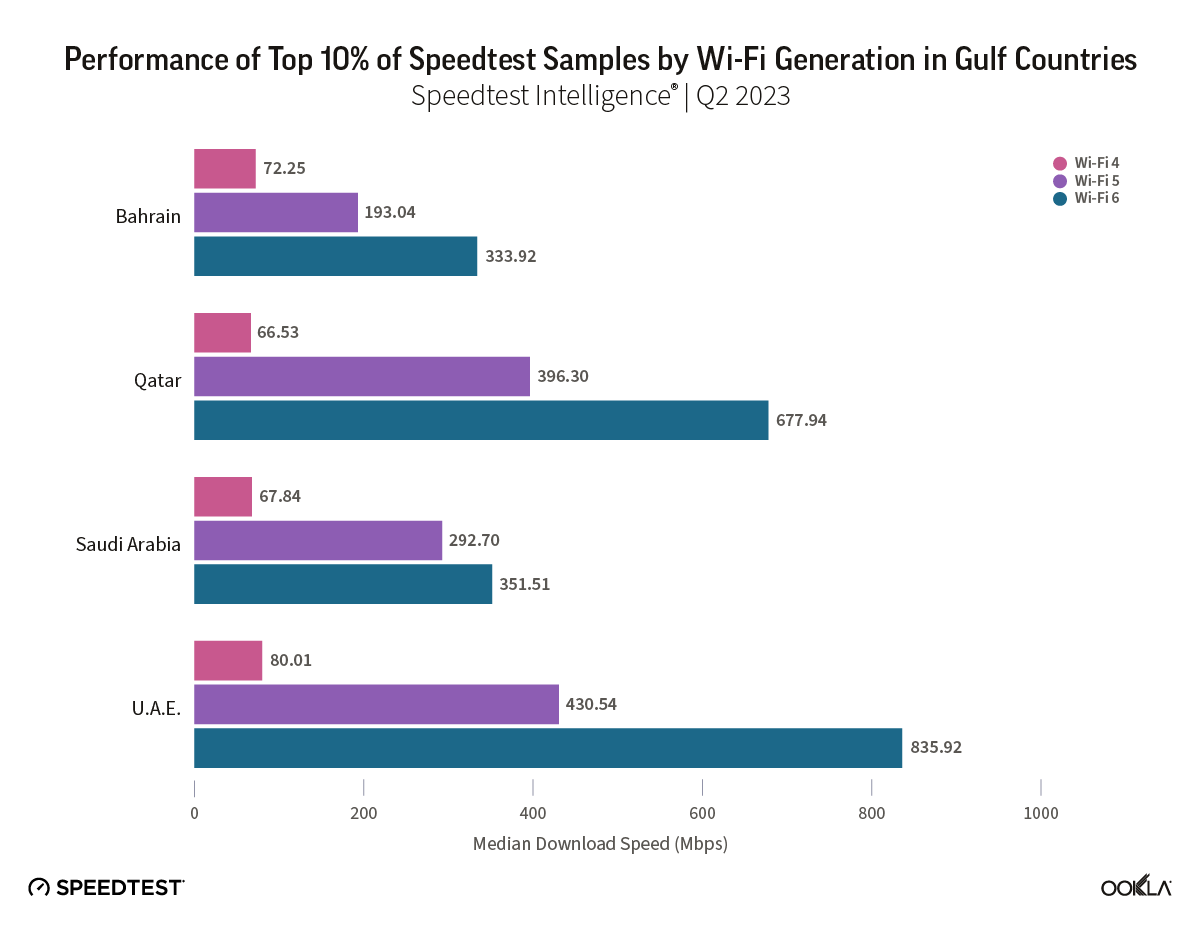
Looking at the performance of the fastest 10% samples in Q2 2023 reveals a more significant potential speed uplift for data-heavy users when using modern Wi-Fi standards. Users in the top 10% of our results experience the best performance, so it is possible to gauge from their results what speeds are achievable with each Wi-Fi standard. To that end, the median download speed of the 10th percentile results on Wi-Fi 4 users across Bahrain, Qatar, Saudi Arabia, and the U.A.E. was 71.60 Mbps, compared to 330.91 Mbps on Wi-Fi 5 and 693.48 Mbps on Wi-Fi 6. Wi-Fi 5 was 2.7x faster than Wi-Fi 4 in Bahrain and 5.9x faster in Qatar, while the speed ratios of Wi-Fi 6 to Wi-Fi 5 ranged from 1.2 in Saudi Arabia to 1.9 in the UAE.

Given the clear performance advantages of Wi-Fi 5, ISPs should encourage customers to migrate from Wi-Fi 4 to Wi-Fi 5 because it will significantly impact the end-user network experience. It’s also important to note that our data confirms that fiber broadband subscribers who continue using Wi-Fi 4 are the most penalized, especially if they subscribe to a service that is advertised as offering hundreds of megabits per second.

Chart of Performance of Top 10% of Speedtest Samples by Wi-Fi Generation in Gulf Countries

The persistent usage of legacy Wi-Fi is likely due to incorrectly configured routers

Huawei and TP-Link are the top router brands reported by Gulf users utilizing Wi-Fi 4. However, their popularity can vary vastly by market depending on the equipment bundled by ISPs with their broadband offerings, as well as the ability of consumers to use third-party routers (some ISPs allow only their own routers). Our data shows that Bahrain and Saudi Arabia have the highest proportion of samples connected to a Huawei CPE. TP-Link routers are most common in Qatar and the U.A.E.

The U.A.E. has the highest proportion of routers from D-Link, Cisco, and less popular brands used with Wi-Fi 4 (nearly 64% of samples reported using ‘other’ manufacturers). This high level of market fragmentation is likely due to users replacing routers provided by their ISP or installing refurbished routers to extend coverage indoors. Such fragmentation complicates the task of ISPs to ensure that their customers use more recent routers or that they configure them correctly to use more modern Wi-Fi standards.

Chart of Wi-Fi 4 Router Market Share by Manufacturer in Gulf Countries

Our research showed that most commercial CPEs in the region introduced since 2020 likely support Wi-Fi 5 (if not Wi-Fi 6). Further, tests also showed that most Android-based smartphones that used Wi-Fi 4 were equipped with Wi-Fi 5-capable chipsets. Therefore, many users in the region are capable of using Wi-Fi 5 but are still on Wi-Fi 4. We believe that misconfigured routers could be the primary cause of such a high prevalence of legacy Wi-Fi 4 technology among Gulf countries.

ISPs can address the factors that favor Wi-Fi 4 and 2.4 GHz spectrum usage, for example, by working more closely with device manufacturers, supporting customers to acquire newer Wi-Fi routers, and correctly configuring them, as shown in the table below. 

Factors that lead to Wi-Fi 4 usage and how ISPs can address them

Legacy equipment
  • Some fixed broadband customers are locked into long service contracts and are not eligible for router upgrades
  • ISPs may not offer newer routers to existing customers whose contracts are automatically renewed
Solutions
  • Encourage existing broadband customers to upgrade to faster fiber packages to benefit from modern Wi-Fi routers
  • Offer customers the option to replace their old Wi-Fi routers for free or for a small fee during their contract
Configuration issues
  • Routers may, by default, use older Wi-Fi standards or diactivate the 5 GHz band
  • Some routers are pre-configured to use the same network name for both the 2.4 GHz and 5 GHz bands, and some devices may not handle this well
  • Some old mobile devices latch to 2.4 GHz (which is more likely used by Wi-Fi 4) on first-run but do not switch back to 5 GHz due to firmware limitations or a hardware/software setting in the router/end-user devices
Solutions
  • Work with OEMs to push firmware and software updates to prioritize newer Wi-Fi standards and the use of 5 Ghz over 2.4 GHz
  • Educate customers about the importance of updating the router’s firmware and smartphone software
  • Preconfigure the routers to have separate names for the 2.4 GHz and the 5 GHz bands
  • Offer routers that can automatically select the optimal Wi-Fi channel and band to improve performance
Coverage and performance issues
  • Distance from CPE, physical obstruction, and interference in the crowded 2.4 GHz band
Solutions
  • Offer Wi-Fi extenders to improve indoor coverage
  • Share best practices with customers on the configuration and placement of the router

Gulf-based IPSs have managed to rapidly grow their fiber footprint and migrate their customers to faster broadband services. However, a substantial portion of subscribers may not benefit from these speed increases due to the prevailing usage of Wi-Fi 4. As many ISPs in the region already offer a minimum fiber speed of 250 Mbps, they should, as a priority, migrate existing customers with legacy Wi-Fi routers to more modern models and educate customers with newer routers on how to correctly configure them. ISPs’ efforts to introduce newer CPEs will help improve the end-user experience, boost global speed rankings in the region, and ensure that their routers are more future-proof as gigabit speeds become more widespread.

Ookla retains ownership of this article including all of the intellectual property rights, data, content graphs and analysis. This article may not be quoted, reproduced, distributed or published for any commercial purpose without prior consent. Members of the press and others using the findings in this article for non-commercial purposes are welcome to publicly share and link to report information with attribution to Ookla.

| January 24, 2018

GOOOOAL: Which World Cup Finalist Scored the Fastest Internet in their Capital City?

Whether you call it soccer or football, everyone calls the World Cup fun. We couldn’t wait for the actual match-ups in June, so we decided to pit the qualifying countries against one another to see who has the fastest internet speeds in their capital cities. The results might surprise you.

Get ready to watch Russia best Brazil and Portugal defeat Iran; meanwhile, Argentina and Nigeria and Belgium and England are preparing for penalty shoot-outs.

Using data from Speedtest Intelligence for Q3-Q4 2017, we’ve calculated which capital cities of World Cup-qualifying countries have the fastest mobile and fixed broadband speeds. We also took a peek at the fastest carriers and internet service providers (ISPs) in each capital using Speed Score, a comprehensive metric that combines measures of internet performance at all levels.

Mobile winners

Iceland’s sixth place ranking for mobile download speed in the Speedtest Global IndexTM virtually assured that Reykjavík would come out at the top of the list of fastest World Cup contenders. Canberra represents Australia well with a second place finish for mobile download speeds among World Cup capitals. And Brussels, Belgium barely surpasses Bern, Switzerland for a third place finish.

Mobile Internet Speeds
Capitals of World Cup Qualifying Countries | Q3 – Q4 2017
Country Capital City Average Download (Mbps) Average Upload (Mbps)
Iceland Reykjavík 55.49 21.53
Australia Canberra 44.24 12.60
Belgium Brussels 42.52 16.74
Switzerland Bern 42.02 17.52
South Korea Seoul 41.85 14.15
Denmark Copenhagen 41.78 18.29
Croatia Zagreb 41.16 16.40
Sweden Stockholm 40.12 12.63
Spain Madrid 38.30 14.02
Portugal Lisbon 30.60 11.39
Serbia Belgrade 30.33 12.49
France Paris 29.03 9.26
Poland Warsaw 26.94 9.84
Germany Berlin 25.83 9.51
England London 25.09 11.49
Russia Moscow 21.89 8.49
Japan Tokyo 19.89 7.10
Uruguay Montevideo 19.82 11.49
Mexico Mexico City 19.11 11.51
Peru Lima 18.33 12.90
Tunisia Tunis 18.27 8.07
Brazil Brasília 18.00 8.64
Morocco Rabat 17.32 9.76
Colombia Bogotá 16.87 9.50
Nigeria Abuja 16.17 6.76
Iran Tehran 15.05 7.04
Argentina Buenos Aires 13.77 7.70
Egypt Cairo 13.15 6.33
Panama Panama City 12.89 8.45
Saudi Arabia Riyadh 12.28 8.88
Senegal Dakar 8.85 3.81
Costa Rica San José 5.97 3.33

Looking at the group draw, Group A fares the worst with 16th place Moscow, Russia being the capital city with the fastest mobile downloads in the group. In Group B, Spain comes out on top. Australia wins Group C, Iceland takes Group D, Switzerland leads Group E and South Korea has the fastest mobile download speed in Group F. Belgium finishes first in Group G and Poland prevails in Group H, despite a 13th place finish overall.

From a regional perspective, European capitals top the rankings with all 14 European World Cup capitals sitting in the top half of the list. Latin American, Middle Eastern and African cities fare worst. Asia’s two contenders are split with Seoul boasting the fifth fastest mobile download speed among World Cup capitals and Tokyo, Japan coming in 17th.

The fastest World Cup capital in Latin America (Montevideo, Uruguay) shows a 64.3% slower mobile download speed than Reykjavík. First place among African World Cup capitals, Rabat, Morocco is 68.8% slower than Reykjavík for mobile downloads. And Tehran, Iran, the fastest World Cup capital in the Middle East, is 72.9% slower than Reykjavík.

Fastest carriers

We also looked into which carriers were fastest in each of the 32 World Cup capital cities.

With Speed Scores ranging from 8.89 in Dakar, Senegal to 46.57 in Brussels, mobile carrier Orange was fastest in four cities and tied for fastest in one. Vodafone was fastest in both Lisbon, Portugal and Madrid, Spain with comparable Speed Scores in the two locations. The rest of the cities show the diversity of fastest carriers that you might expect from a worldwide competition.

Fastest Carriers Speeds
Capitals of World Cup Qualifying Countries | Q3 – Q4 2017
Country Capital City Fastest Carrier Speed Score
Argentina Buenos Aires Personal 16.15
Australia Canberra Telstra 50.21
Belgium Brussels Orange 46.57
Brazil Brasília Claro 24.72
Colombia Bogotá Avantel 20.93
Costa Rica San José ICE 8.30
Croatia Zagreb Hrvatski Telekom 49.35
Denmark Copenhagen TDC / Telia 45.34 / 45.09
Egypt Cairo Orange 16.50
England London EE 36.83
France Paris Orange 33.15
Germany Berlin Telekom 53.54
Iceland Reykjavík Nova 64.61
Iran Tehran MTN IranCell 15.89
Japan Tokyo SoftBank 27.26
Mexico Mexico City AT&T 20.26
Morocco Rabat inwi 20.51
Nigeria Abuja MTN 29.23
Panama Panama City Cable & Wireless Panama / Movistar 14.85 / 14.80
Peru Lima Entel Peru 20.73
Poland Warsaw T-Mobile 36.07
Portugal Lisbon Vodafone 42.44
Russia Moscow MegaFon 37.06
Saudi Arabia Riyadh Zain 13.20
Senegal Dakar Orange 8.89
Serbia Belgrade Vip mobile 45.56
South Korea Seoul LG U+ 50.03
Spain Madrid Vodafone 40.17
Sweden Stockholm Telia 54.49
Switzerland Bern Sunrise / Swisscom 42.14 / 41.91
Tunisia Tunis Ooredoo / Orange 19.90 / 19.89
Uruguay Montevideo Antel 20.35

Fixed broadband winners

Given that Iceland ranks second in the world for fixed broadband download speed on the Speedtest Global Index and has the world’s highest gigabit user penetration (GUP), we’re not surprised to see Reykjavík shut out the competition by coming out on top of World Cup contenders for fixed broadband speed, too. Seoul, South Korea comes in second for fixed broadband download speed among World Cup capitals and Paris, France takes third.

Fixed Broadband Internet Speeds
Capitals of World Cup Qualifying Countries | Q3 – Q4 2017
Country Capital City Average Download (Mbps) Average Upload (Mbps)
Iceland Reykjavík 142.89 154.28
South Korea Seoul 130.75 131.96
France Paris 112.58 55.86
Sweden Stockholm 98.77 66.68
Spain Madrid 86.59 73.43
Japan Tokyo 75.88 70.46
Denmark Copenhagen 72.74 52.13
Switzerland Bern 68.82 54.44
Poland Warsaw 62.57 16.19
Portugal Lisbon 55.80 30.97
England London 52.53 16.12
Germany Berlin 46.84 9.52
Russia Moscow 45.25 42.96
Belgium Brussels 43.25 9.63
Panama Panama City 29.11 5.93
Australia Canberra 28.85 12.46
Serbia Belgrade 26.45 5.59
Croatia Zagreb 26.20 11.40
Mexico Mexico City 24.11 10.14
Uruguay Montevideo 23.02 5.82
Argentina Buenos Aires 22.03 4.26
Brazil Brasília 21.57 5.29
Saudi Arabia Riyadh 20.93 9.05
Peru Lima 18.15 3.51
Colombia Bogotá 13.43 6.48
Morocco Rabat 11.83 2.51
Iran Tehran 9.33 4.18
Costa Rica San José 8.79 4.29
Nigeria Abuja 8.07 5.27
Tunisia Tunis 7.82 4.49
Senegal Dakar 7.42 3.11
Egypt Cairo 5.61 1.92

Group A again suffers on the fixed side with leader Russia coming in 13th based on Moscow’s fixed broadband download speed. Spain’s still the front-runner of Group B. France takes Group C, Iceland wins Group D, Switzerland tops Group E, South Korea reigns over Group F, England heads up Group G and Japan starts Group H based on average download speeds over fixed broadband in their respective capitals.

European capitals again fare well, with 12 of the 14 placing in the top half of fastest World Cup capitals for fixed broadband download speed. Belgrade, Serbia and Zagreb, Croatia rank 17th and 18th, respectively. Tokyo ranks much better for fixed broadband download speed than for mobile, which puts both Asian World Cup capitals in the top six.

With the exception of Panama City, Panama, which ranks 15th, all Latin American World Cup capitals are in the bottom half of the list for download speed over fixed broadband. As are all Middle Eastern and African capital cities.

Panama City’s fixed broadband download speed is 79.6% slower than Reykjavík’s. Riyadh, Saudia Arabia boasts the title of fastest World Cup capital in the Middle East, but is still 85.4% slower for fixed broadband downloads than Reykjavík. The fastest World Cup capital in Africa — Rabat, Morocco — is 91.7% slower than Reykjavík.

Fastest providers

Comparing Speed Scores for fixed broadband across World Cup capitals, Vodafone had wins in Berlin, Germany and Lisbon and Orange took Paris and tied for first in Madrid. The rest of the fastest ISPs vary by location as listed below:

Fastest ISPs Speeds
Capitals of World Cup Qualifying Countries | Q3 – Q4 2017
Country Capital City Fastest ISP Speed Score
Argentina Buenos Aires Cablevisión Fibertel 21.72
Australia Canberra iiNet 33.23
Belgium Brussels Telenet 66.95
Brazil Brasília NET Virtua 27.30
Colombia Bogotá ETB 19.17
Costa Rica San José Cabletica 8.28
Croatia Zagreb vip 30.23
Denmark Copenhagen Fiberby 103.26
Egypt Cairo TE Data 4.84
England London Hyperoptic 117.40
France Paris Orange 107.20
Germany Berlin Vodafone 55.46
Iceland Reykjavík Nova 278.06
Iran Tehran Mobin Net 11.74
Japan Tokyo So-net 118.05
Mexico Mexico City Axtel 45.83
Morocco Rabat Maroc Telecom 9.25
Nigeria Abuja MTN 10.73
Panama Panama City Cable Onda 25.08
Peru Lima Movistar 16.64
Poland Warsaw UPC 82.72
Portugal Lisbon Vodafone 61.80
Russia Moscow MGTS 62.00
Saudi Arabia Riyadh STC 16.46
Senegal Dakar Tigo 6.42
Serbia Belgrade SBB 34.60
South Korea Seoul KT 162.45
Spain Madrid Masmovil / Orange 101.52 / 101.34
Sweden Stockholm Ownit 158.78
Switzerland Bern Fiber7 241.93
Tunisia Tunis TOPNET 7.61
Uruguay Montevideo Antel 22.01

Did your team not come out as expected? Or are you defending a tight match? Take a Speedtest on Android, iOS or on the web and we’ll check back in on scores closer to the main event.

Ookla retains ownership of this article including all of the intellectual property rights, data, content graphs and analysis. This article may not be quoted, reproduced, distributed or published for any commercial purpose without prior consent. Members of the press and others using the findings in this article for non-commercial purposes are welcome to publicly share and link to report information with attribution to Ookla.

| December 10, 2018

The World’s Internet in 2018: Faster, Modernizing and Always On

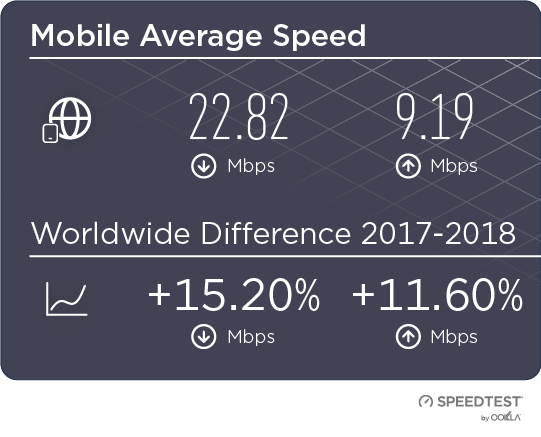
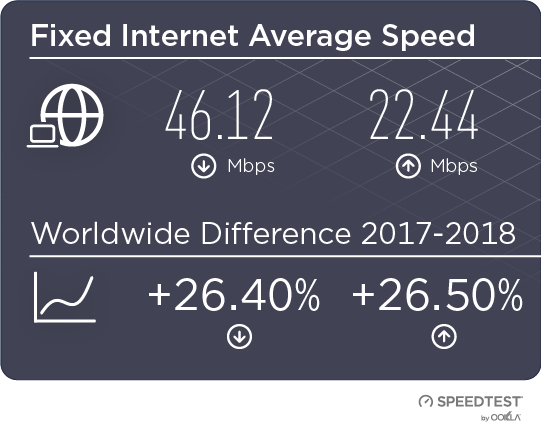
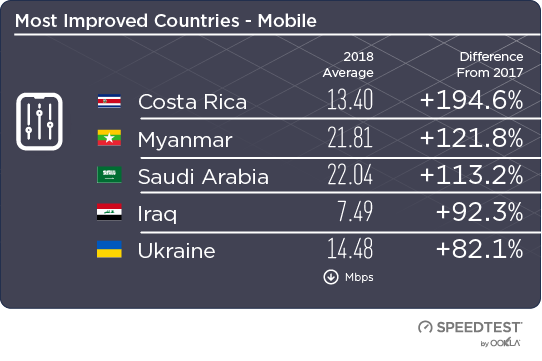
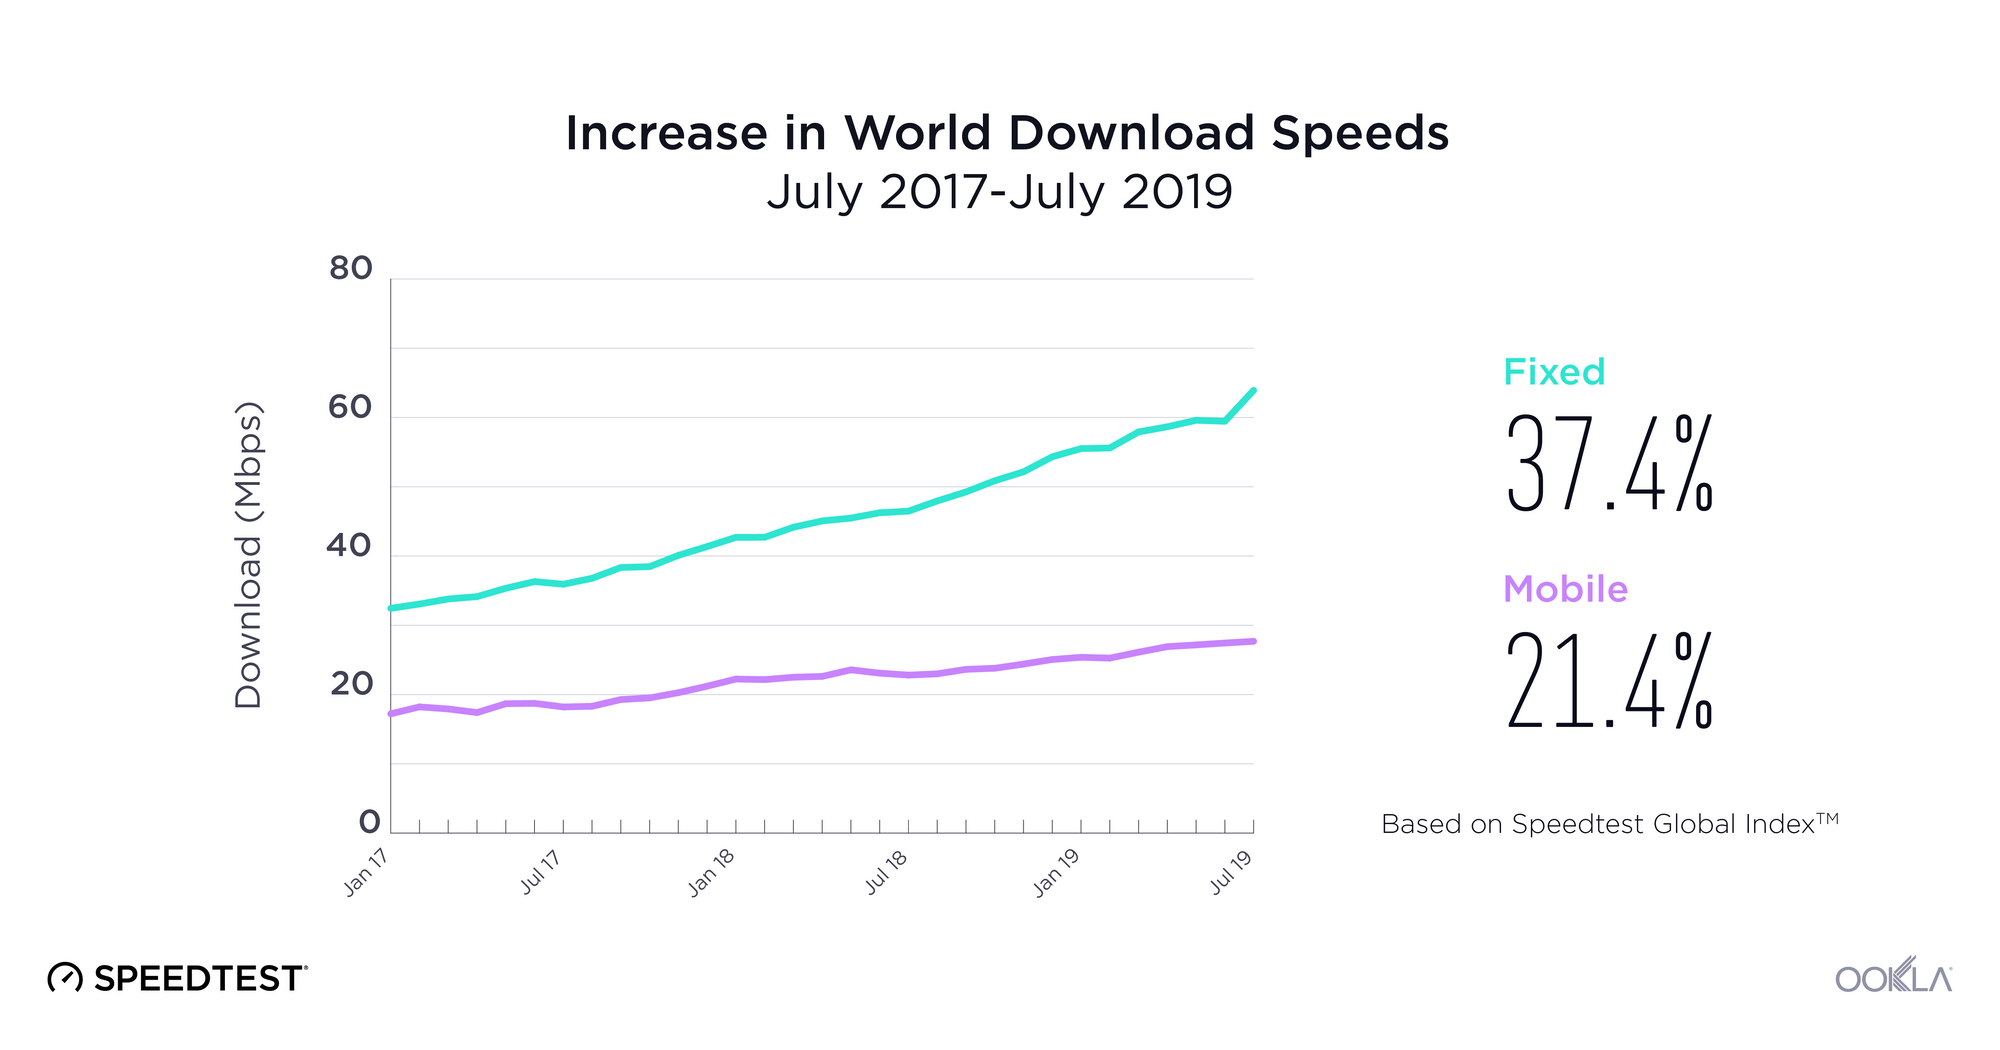
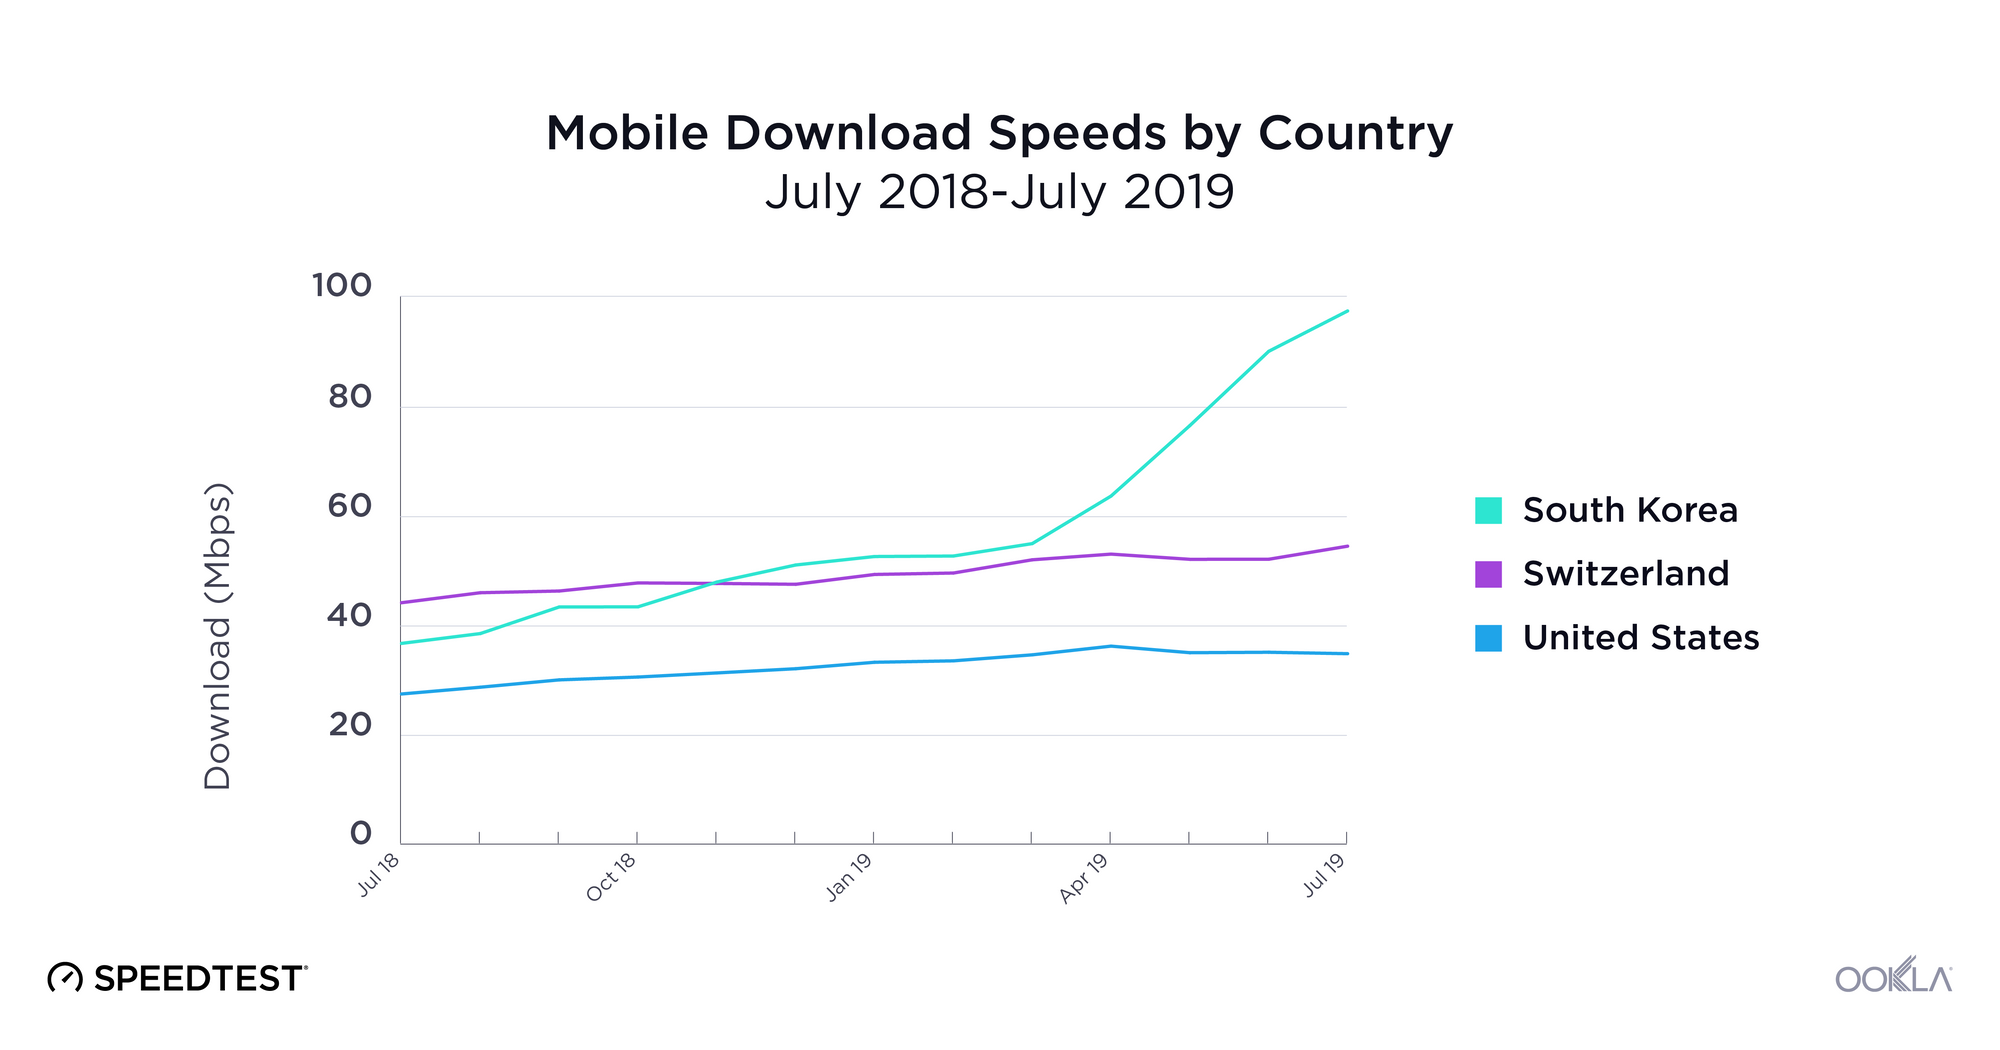
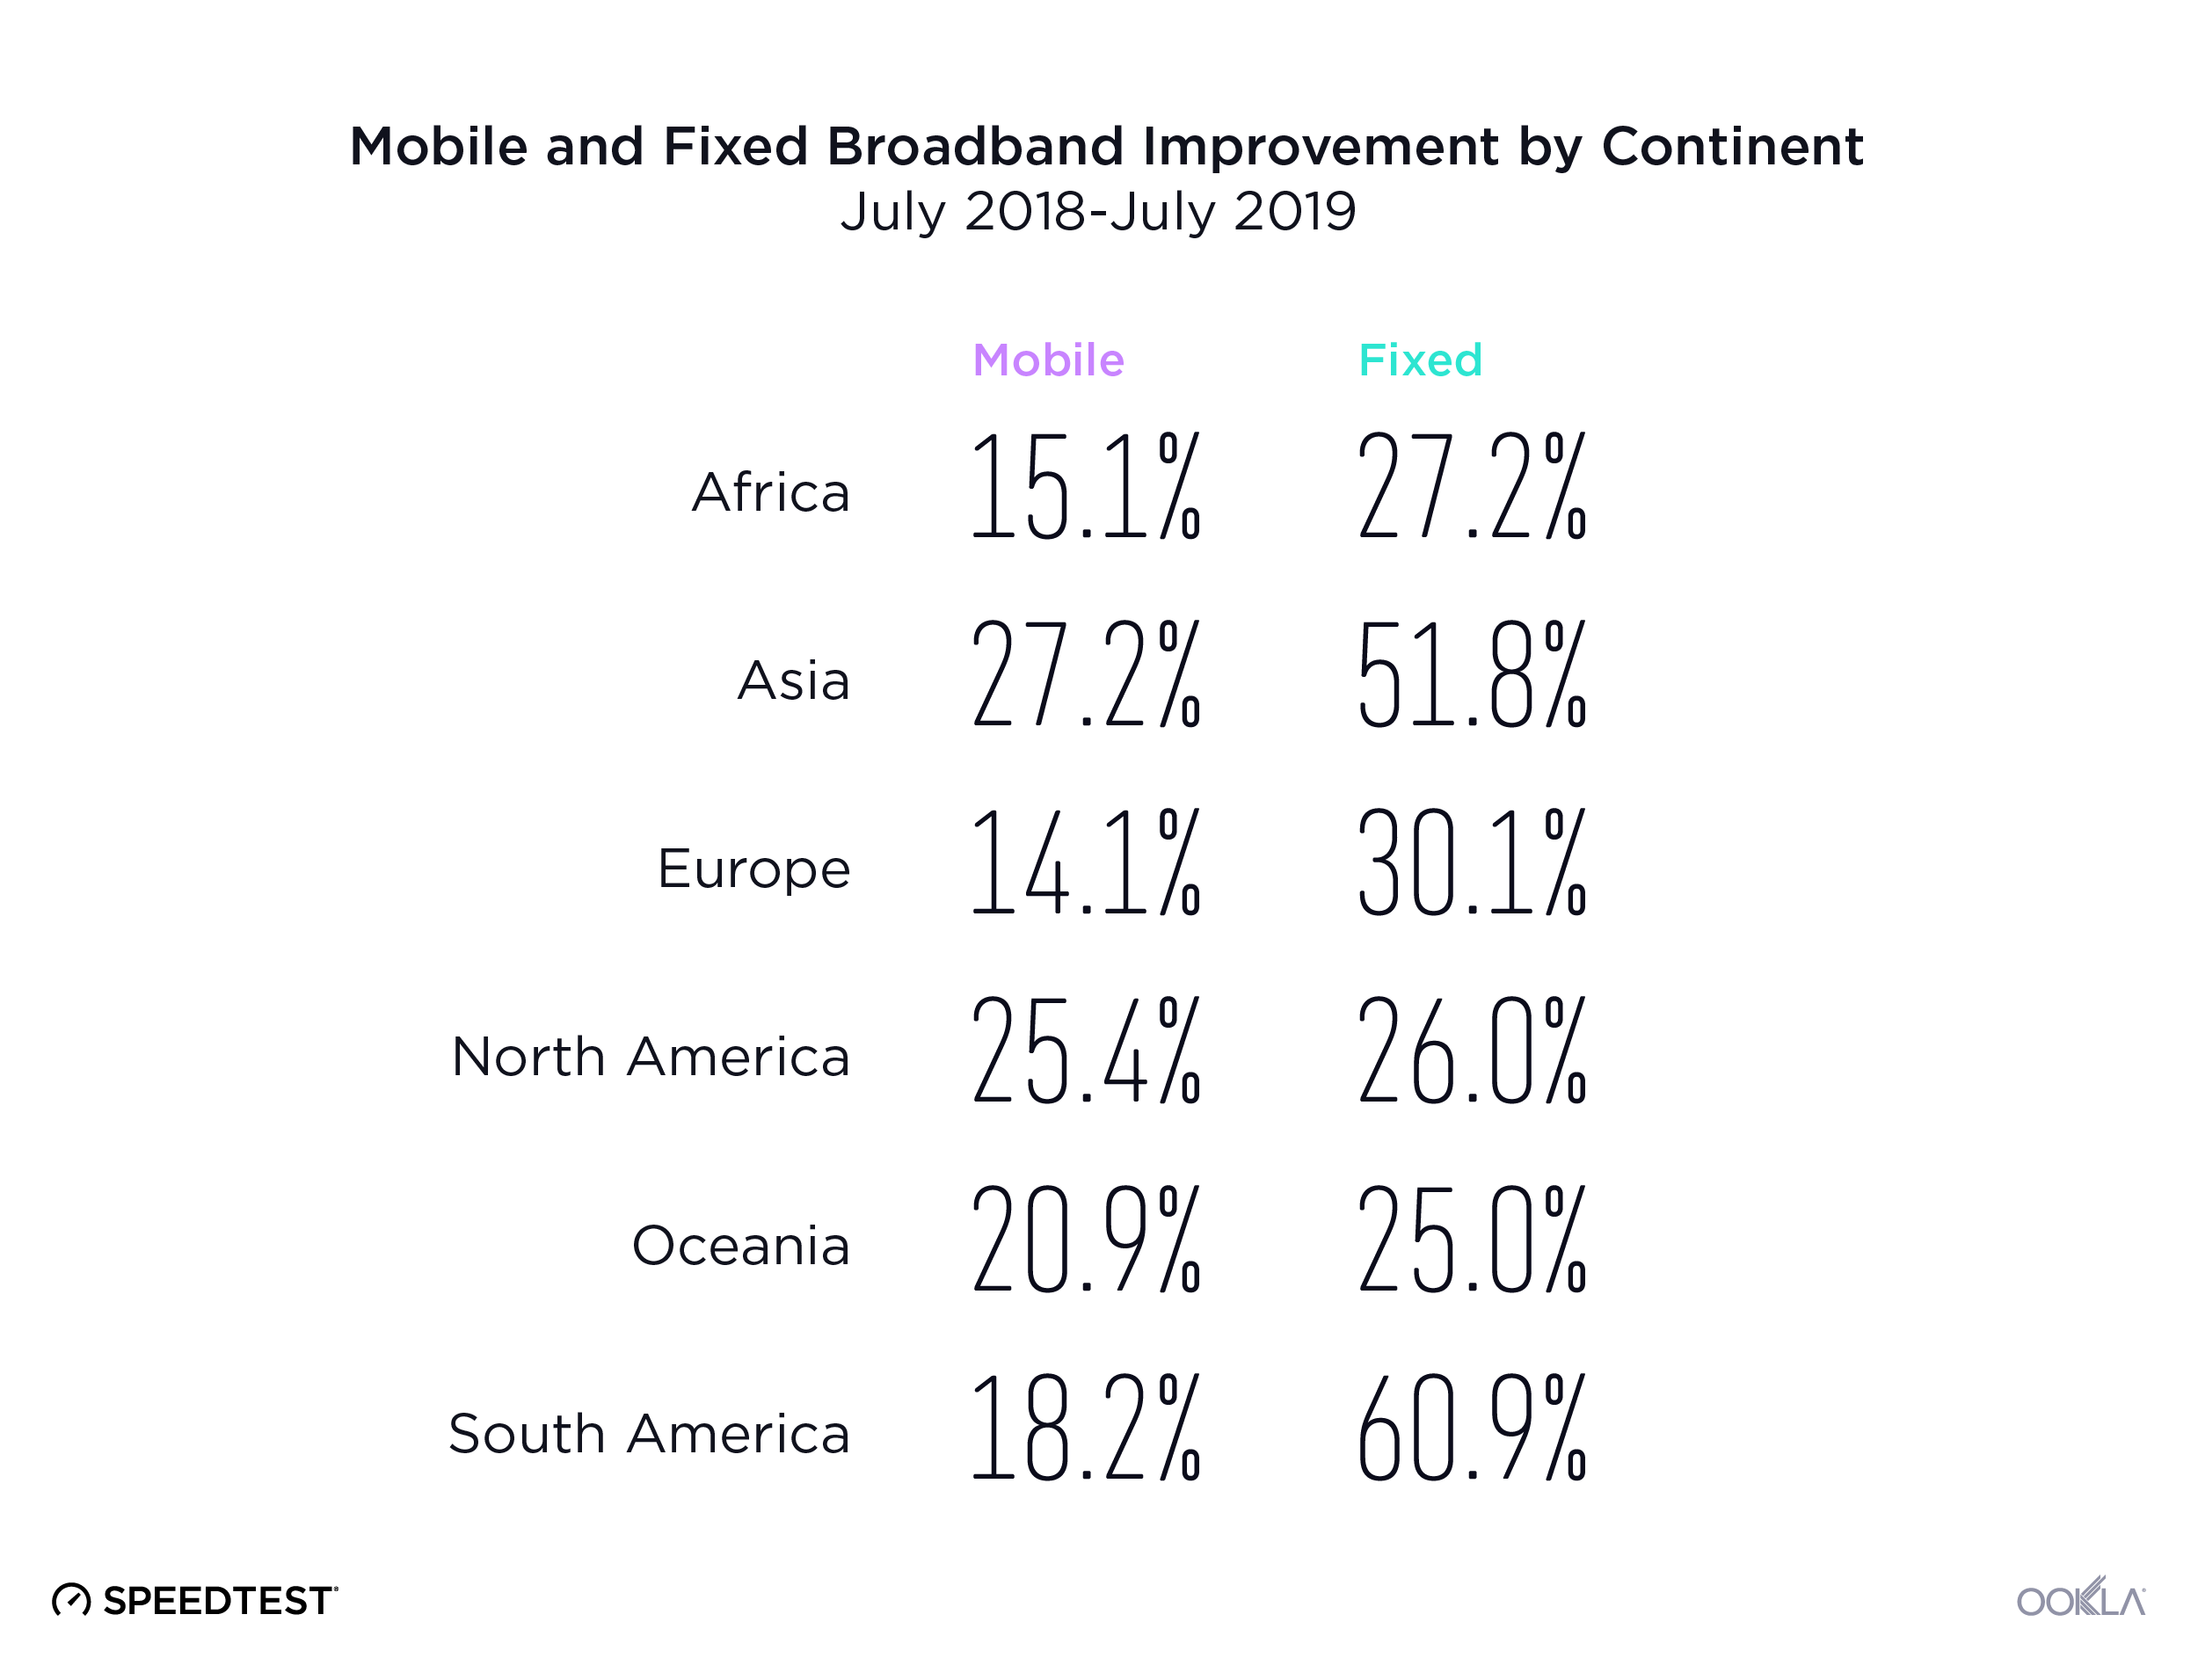
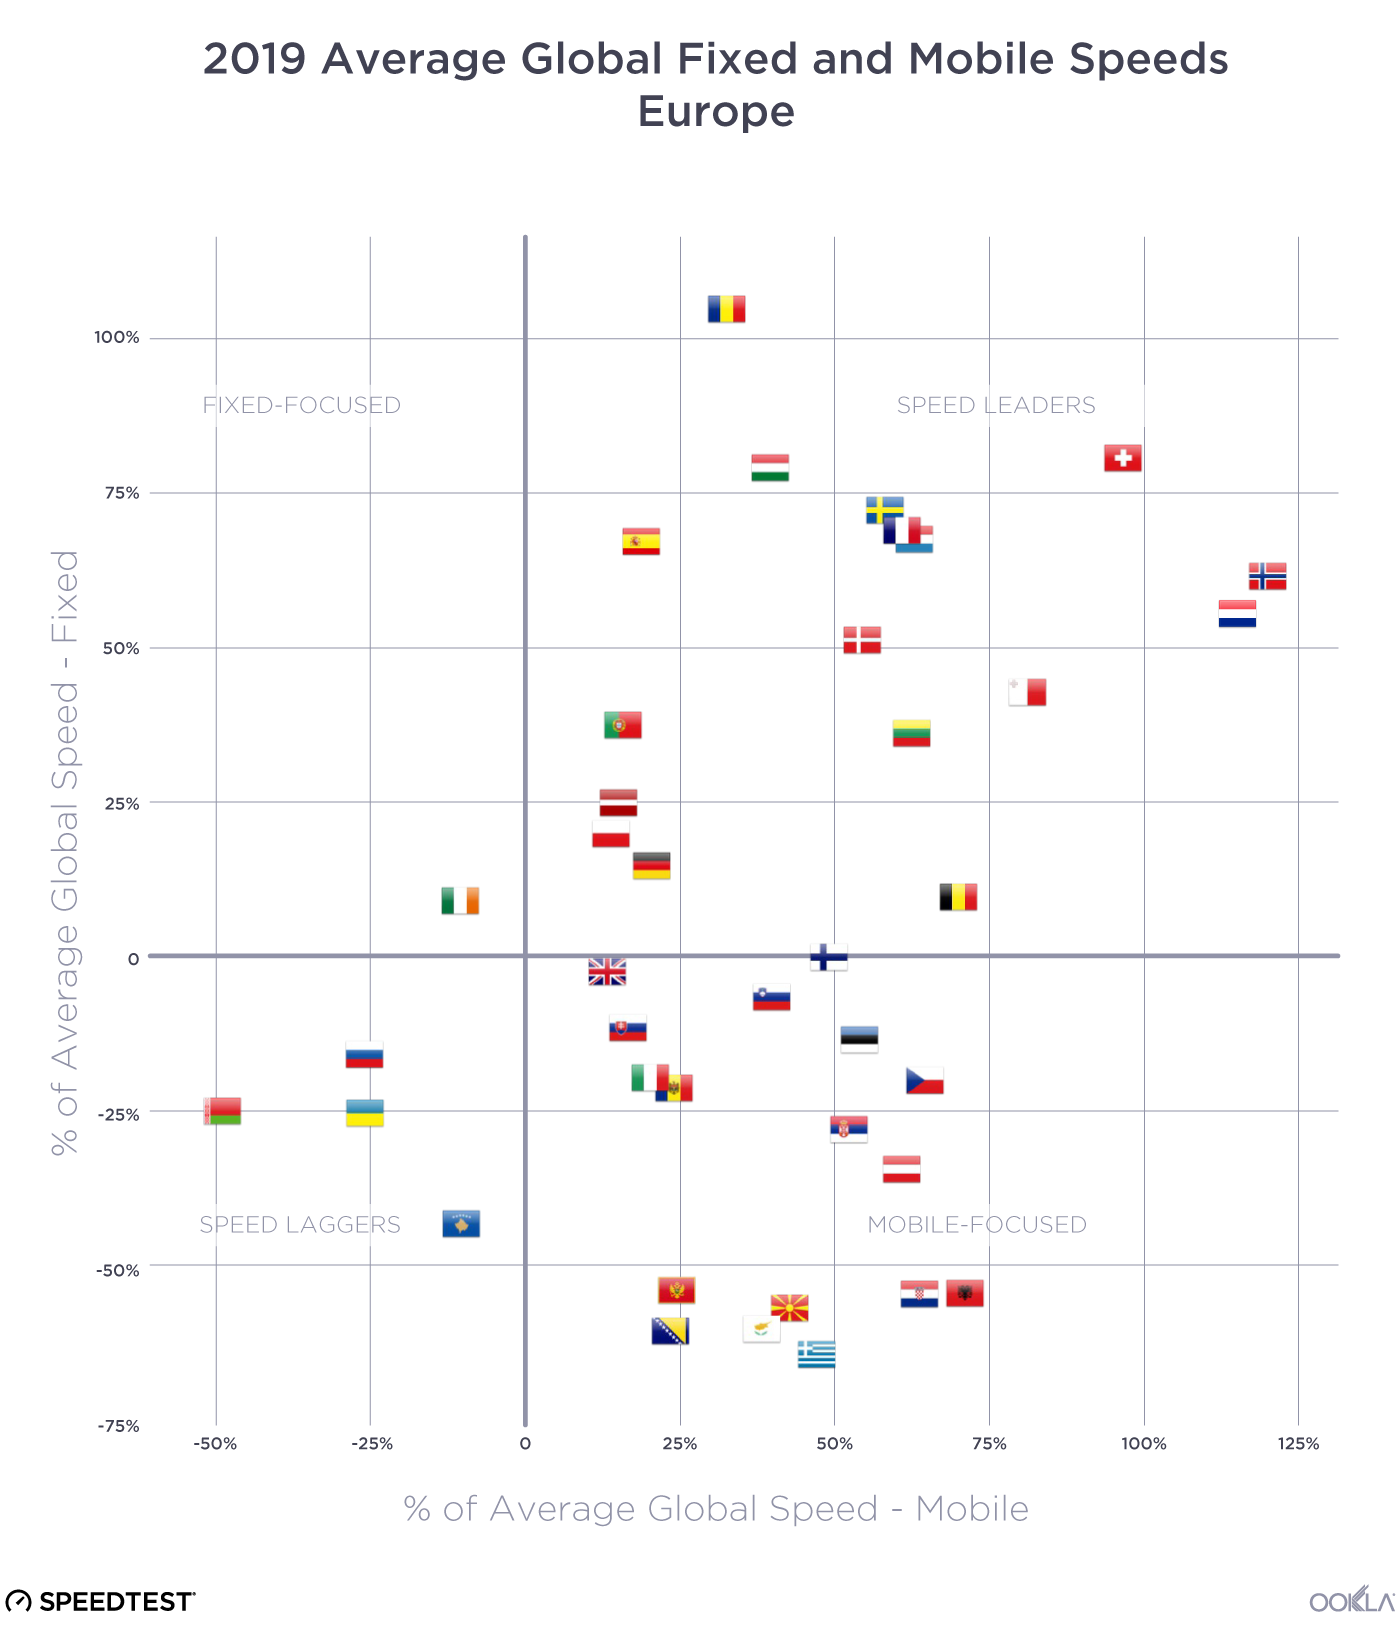
When it comes to the internet, the news is mostly good for 2018. Download and upload speeds are increasing across the globe on both mobile and fixed broadband. 5G is on the horizon and gigabit service is expanding.

We looked at data from Speedtest IntelligenceTM, Ookla’s flagship data platform, from December 2017 through November 2018, to analyze everything from global internet speeds to the world’s fastest countries to when people are online. We also investigated which parts of the world are seeing the most benefit from high speed LTE on mobile and gigabit speeds on fixed broadband.

Mobile speeds increased more than 15% in 2018

Graphic-Tables-Final-v2_mobile-average-speed-3

The world’s average mobile download speed of 22.82 Mbps increased 15.2% over the past year, while mobile upload speed increased 11.6% to reach 9.19 Mbps.

Graphic-Tables-Final-v2_android-vs-ios-1

With a mean download speed of 27.84 Mbps and a mean upload of 10.61 Mbps, worldwide speeds on iOS devices were faster than those on Android (21.35 Mbps download, 8.73 Mbps upload) in 2018. This is likely due to market factors as Android devices are more popular in emerging markets where internet speeds tend to be slower.

However, download speed on Android devices increased 19.0% and upload speed increased 15.1%, more than those on iOS (18.0% increase for download and 11.1% increase for upload), which is good news for those emerging markets.

Fixed broadband speeds increased more than 26% in 2018

Graphic-Tables-Final-v2_fixed-average

On a global level, fixed broadband speeds were nearly twice as fast as those on mobile in 2018. The world’s average download speed on fixed broadband was 46.12 Mbps, 26.4% faster than last year. Upload speed increased 26.5% to 22.44 Mbps.

All said, though, both mobile and fixed broadband speeds increased at a slower rate in 2018 than they did in 2017.

Countries with the fastest internet in 2018

Graphic-Tables-Final-v2_top-5-mobile

The countries with the fastest mean download speeds over mobile in the past 12 months were: Norway (63.19 Mbps), Iceland (58.68 Mbps), Qatar (55.17 Mbps), Singapore (54.71 Mbps) and the Netherlands (53.42 Mbps).

Graphic-Tables-Final-v2_top-5-fixed

Singapore showed the world’s fastest mean download speeds over fixed broadband during the past twelve months at 175.13 Mbps. Next fastest were Iceland (153.03 Mbps), Hong Kong (138.31 Mbps), South Korea (114.67 Mbps) and Romania (109.90 Mbps).

To keep up with month-to-month internet speeds at a global level, visit the Speedtest Global Index.

Most improved countries for 2018 internet speeds

Graphic-Tables-Final-v2_most-improved-mobile

Costa Rica saw the largest increase in mobile download speed over the past year at 194.6%. Myanmar was second with 121.8%, Saudi Arabia third (113.2%), Iraq fourth (92.3%) and the Ukraine fifth (82.1%).

The countries with the largest improvements in upload speeds were Bangladesh (179.2%), the Ukraine (172.5%), Costa Rica (163.4%), Myanmar (146.9%) and Iraq (126.7%).

Graphic-Tables-Final-v2_most-improved-fixed

Paraguay saw the biggest increase in mean download speed over fixed broadband in the world over the past year at 268.6%. Guyana was second with 113.5%, Libya third (108.0%), Malaysia fourth (89.5%) and Laos fifth (76.2%).

Libya showed the most improvement in mean upload speed over fixed broadband during the past twelve months at 176.4%. Guyana was second with 116.1%, Malaysia third (95.2%), Belize fourth (88.9%) and Iraq fifth (76.8%).

4G is increasing mobile speeds

2017-2018-LTE-growth

When we looked specifically at Speedtest results on 4G, we saw that mean download speeds increased in most countries. Costa Rica was most improved for 4G download speed as was the case with overall download speed on mobile increasing 184.3% year over year. Saudi Arabia was second at 110.2% and Myanmar third at 78.0%.

Most encouragingly, we saw the number of Speedtest results over 4G increase in all but 15 countries. This could indicate that 4G availability is expanding. Tanzania saw the greatest increase with 355.0% more tests over 4G in 2018 than in 2017. Malta was second at 267.2% and Algeria third at 143.7%. We can see this expansion on the map above as 4G results fill in areas of the globe that were previously blank.

Gigabit coverage is expanding globally

gigabit-fade-1

Gigabit is in the news as ISPs across the globe expand their high-speed networks. We looked at Speedtest results on fixed broadband in excess of 750 Mbps to see which cities are benefitting most. Comparing locations with 100 or more gigabit-speed results in 2017 with those in 2018, that expansion becomes obvious. In 2017, 60 countries met our gigabit test threshold. In 2018, 16 additional countries joined our gigabit list. We’re also seeing that more cities around the world now have access to gigabit speeds.

Also exciting is that cities which already had gigabit in 2017 saw increases in the number of gigabit-speed results in 2018 as ISPs continue to build out infrastructure across cities. Many cities saw their first real gigabit expansion in 2018. For example, we saw the number of gigabit tests in New Delhi increase from 119 gigabit speed results in 2017 to 20,239 in 2018, that’s a mind-boggling 16,908% increase. Chennai, India saw a 7,481% increase (from 763 to 57,840) and Cormeilles-en-Parisis, France jumped 6,480%. Huge leaps in the number of gigabit-speed results were also seen in Gdańsk, Poland (6,338%); Rome, Italy (4,909%); Lancashire, United Kingdom (3,962%); Ota, Japan (3,240%); São Paulo, Brazil (2,947%); Hangzhou, China (2,669%) and Turda, Romania (2,636%).

When people are online

point-3-sec-final-1

The internet is always on, but we were surprised to see how consistently and steeply usage fell off on both mobile and fixed broadband after 9 pm local time. Normalizing the time of day for Speedtest results from around the globe, we found that usage bottoms out at 4 am and then climbs steeply again until 10 am. From there, the internet gets gradually busier until that night time drop off.

Internet in the world’s largest countries

The world’s five most populous countries are notably absent from the lists of fastest and most improved countries on mobile and fixed broadband. China, India, the U.S., Indonesia and Brazil represent about 46% of the world’s population, which makes their internet speeds worth noting nonetheless.

Internet Speeds in the World’s Largest Countries
Speedtest Data | December 2017-November 2018
Country Mean Mobile Download Speed (Mbps) % Improvement in Mobile Speed Mean Fixed Download Speed (Mbps) % Improvement in Fixed Speed
China 30.96 -5.8% 76.03 42.5%
India 9.11 15.2% 23.00 50.4%
United States 28.50 22.3% 92.77 37.3%
Indonesia 10.39 5.3% 14.89 18.3%
Brazil 18.65 29.3% 22.95 39.4%

Mobile internet speeds in the world’s largest countries

China had the fastest average mobile download speed among the world’s most populous countries in the past twelve months. However, China’s mobile download speed decreased during that time. The United States is fast catching up with China on mobile download speed.

Brazil occupied a middle ground for mobile download speed among the world’s most populous countries and showed the fastest rate of increase. India and Indonesia were at the bottom of this list. While the two nations show similar mobile download speeds to each other, India’s mobile download speed is improving much more quickly than Indonesia’s.

Fixed broadband speeds in the largest countries in the world

The United States showed the fastest fixed broadband download speed among the world’s most populous countries over the past year. China was second, India and Brazil nearly tie for third and Indonesia follows.

India showed the largest improvement in mean download speed over fixed broadband of the world’s five largest countries. China was second, Brazil third, the U.S. fourth and Indonesia fifth.

We’ll be back throughout 2019 to report on the state of the world’s internet as it evolves. Until then, take a Speedtest to find out how your network compares.

Ookla retains ownership of this article including all of the intellectual property rights, data, content graphs and analysis. This article may not be quoted, reproduced, distributed or published for any commercial purpose without prior consent. Members of the press and others using the findings in this article for non-commercial purposes are welcome to publicly share and link to report information with attribution to Ookla.

| September 4, 2019

In-Depth Analysis of Changes in World Internet Performance Using the Speedtest Global Index

A lot has changed in the two years since 2017 when we first began ranking mobile and fixed broadband speeds of countries around the world with the Speedtest Global IndexTM. 5G is being deployed around the world and fiber continues to make gigabit speeds a reality in more and more countries. We’ve been tracking it all and are here to report on how much speeds have increased, which countries are leading internet performance and which are falling behind, and what trends we see across continents.

World mobile speed increased 21.4% with fixed broadband up 37.4%

World-Download-Speeds-2019-OG2

Looking just at the last year, the world’s mean download speed over mobile increased 21.4% from 22.81 Mbps in July 2018 to 27.69 Mbps in July 2019. Mean upload speed over mobile increased 18.1% from 9.13 Mbps to 10.78 Mbps. The world average for download speed over fixed broadband increased 37.4% from 46.48 Mbps in July 2018 to 63.85 Mbps in July 2019. Mean upload speed over fixed broadband increased 48.9% from 22.52 Mbps to 33.53 Mbps.

Shake-ups in the country rankings for internet performance

Fastest-Countries-Mobile-2018-2019

Mobile speeds in the fastest countries have skyrocketed in the past year which has dramatically shifted the rankings. South Korea, which was not even in the top ten a year ago, saw a 165.9% increase in mean download speed over mobile during the past 12 months, in large part due to 5G. Switzerland’s mean download speed increased 23.5%. Canada’s was up 22.2%, Australia 21.2%, the Netherlands 17.3%, UAE 11.1%, Malta 10.3% and Norway 5.8%. Qatar remained in the top ten, although the country’s mean download speed over mobile actually dropped 1.4% from July 2018 to July 2019.

Individual mobile operators can make a huge difference in a country’s speeds. In 2017 we were excited to see Telenor uncap their mobile speeds, which drove Norway to the top of the Speedtest Global Index. A big part of South Korea’s mobile success in the past year is the way KT, LG U+ and SK Telecom banded together to release 5G at the same time. Switzerland has also benefited from 5G and Sunrise leads the country with 262 5G deployments across the country while Swisscomm has 52.

Fastest-Countries-Fixed-2018-2019

Fixed broadband rankings on the Speedtest Global Index have not changed as dramatically during the past 12 months as those on mobile. Singapore remains the fastest country with an increase in mean download speed over fixed broadband of 5.6%. Taiwan had the largest jump in speeds among the top 10 with a 166.5% improvement in fixed download speed between July 2018 and July 2019. Mean download speed over fixed broadband increased 52.4% in South Korea, 26.4% in Macau, 21.7% in Romania, 21.0% in Switzerland, 19.3% in the United States and 3.5% in Hong Kong.

Monaco and Andorra did not have enough tests to qualify for the Speedtest Global Index one year ago, but massive fixed broadband improvements in both countries inspired us to lower our test count threshold for inclusion and also share these smaller countries’ success stories.

Technologies paving the way: 5G and gigabit

The presence of 5G is not enough to change a market

As discussed above, 5G has the potential to rocket a country to the top of the mobile rankings on the Speedtest Global Index. In practice, we’ve seen 5G speeds that were over 1000% faster than those on LTE.

Mobile-Download-Speeds-by-Country

In reality, though, unless 5G is commercially available widely across a country and from all mobile operators (as was the case in South Korea), the change in speeds at the country level is not that significant. Though commercial 5G was launched widely across Switzerland by Sunrise and Swisscom in April 2019, the country’s mean download speed only increased 2.8% in the three months since. The average mobile download speed in the U.S. has actually declined slightly since 5G was initially deployed. This is because 5G is still only available in a very limited number of markets to consumers with 5G-capable devices.

Visit the Ookla 5G Map for the latest on 5G deployments across the globe.

Gigabit is a game-changer, if you can get it

Unlike 5G, fiber connections have been rolling out since 2007, opening up the possibility of gigabit-speed fixed broadband. That said, it’s costly and time-intensive to lay miles and miles of fiber so progress has varied widely across the globe.

Gigabit-Test---Performance_Singapore-1

Geographically small countries like Singapore have the advantage when it comes to fiber, because It’s easier and cheaper to lay fiber optic cable across the country’s small footprint. Singaporean internet service providers (ISPs) have used this advantage to go beyond mere gigabit and offer connections as fast as 10 Gbps. This is reflected both in Singapore’s dominance of the fixed rankings on the Speedtest Global Index and in the fact that 2.87% of their total Speedtest results over fixed broadband are gigabit-speed (800 Mbps or higher).

Gigabit-Test---Performance_Brazil-1

Brazil offers a good contrast for how difficult it can be for gigabit to reach the masses. While the first Brazilian ISP to offer fiber-to-the-premises (FTTP) initially did so in 2007, easy access to gigabit speeds was slow to follow. However, that may be starting to change. Between June and July 2019 we saw a large uptick in gigabit-speed results in Brazil, where the proportion of gigabit speed tests increased from 0.02% of total fixed broadband tests to 0.17%. This corresponded with a large increase in mean download speed at the country level.

Comparing world mobile and fixed broadband at a glance

We were curious to see just how different internet performance experiences were around the world, so we plotted average mobile download speed against average download speed on fixed broadband. All of the graphs below use a percentage difference from the global average, a number that changed between 2018 and 2019.

fade-Performance-vs-Global---Quadrant-All

Speed Leaders

There was not much change in the list of countries that showed above-average download speeds on both mobile and fixed broadband between July 2018 and July 2019, the “Speed Leaders.” What did change was that fixed broadband speeds increased significantly enough among the group to bring the whole pack closer to Singapore and Hong Kong. On the mobile axis, South Korea’s major increase in download speed made that country more of an outlier, pushing the boundaries of what great performance can look like.

Fixed-Focused countries

Between July 2018 and July 2019 we saw the number of countries considered to be “Fixed-Focused” (having faster download speeds over fixed broadband than the world average while their average mobile download speeds were slower than average) increase. Ireland was the only country that solidly fit this category in 2018. Thailand and Chile started near the midline for fixed speeds and below-average for mobile speeds in 2018. 2019 found both countries squarely in the Fixed-Focused category. Israel also edged into this category as their mobile download speed fell between July 2018 and 2019.

Mobile-Focused countries

The “Mobile-Focused” category saw the most movement between July 2018 and July 2019 as some countries (the UAE and Qatar) increased their fixed speeds sufficiently to join the Speed Leaders. Meanwhile, Bosnia and Herzegovina’s mobile download speed increased year-over-year to move them into the Mobile-Focused quadrant. Georgia’s mobile download speed decreased enough to move them from Mobile-Focused to Speed Laggers.

It will be interesting to see how many of these Mobile-Focused countries double down on their mobile investments and explore 5G alternatives to fixed broadband.

Speed Laggers

No country wants to be in the position of having slower than average mobile and fixed broadband speeds. We saw 57 countries in this “Speed Laggers” quadrant in July 2018 and 78 in July 2019. This increase is mostly due to our expansion of the number of countries we consider for the Speedtest Global Index based on test count. There were enough countries in this category that we’ve considered them separately by continent below.

Regional views of mobile and fixed broadband performance

Mobile-and-Fixed-Broadband-Improvement-by-Continent-02

We aggregated Speedtest results by continent to analyze mobile and fixed broadband performance by continent.

Mobile-and-Fixed-Performance-by-Continent-01

Asia had the highest percentage increase in mobile download speed followed by North America, Oceania, South America, Africa and Europe. Oceania had the fastest mean download speed in July 2019. North America placed second, Europe third, Asia fourth, South America fifth and Africa sixth.

On the fixed broadband side, South America saw the highest percentage increase in download speed. Asia came in second, Europe third, Africa fourth, North America fifth and Oceania sixth. North America had the fastest mean download speed in July 2019. Europe was second, Asia third, and Oceania fourth. As we saw with mobile, South America and Africa again ranked fifth and sixth, respectively.

A zoomed-in view of the speed quadrants separated by continent offers a more detailed view of each country’s role in these rankings.

Africa mostly lags in internet speeds

2019-Performance-vs-Global---Africa

In July 2019, all but two African countries in the Speedtest Global Index fell into the Speed Laggers category, having mobile and fixed broadband speeds that were below global averages. The exceptions were South Africa and Guinea, which both had fast enough mobile speeds to place them in the mobile-focused quadrant.

Asian markets show a wide breadth of internet performance

2019-Performance-vs-Global---Asia

Asia was the most diverse continent we examined in terms of internet performance. We saw a plurality of countries in each of the four quadrants in July 2019. Most of the Speed Leaders were in East Asia: China, Hong Kong (SAR), Japan, Macau (SAR), South Korea, and Taiwan. If we include Singapore, another Speed Leader, these are among the wealthiest nations in Asia (using GDP per capita). Two of Asia’s Fixed-Focused countries are in Southeast Asia (Malaysia and Thailand) and one is in the Middle East (Israel).

The Speed Laggers category contained countries from South Asia (including Afghanistan, India and Pakistan), Southeast Asia (Brunei, Cambodia, the Philippines and Vietnam) and the Middle East (Jordan). Mobile-Focused countries in Asia were mostly Middle Eastern, including Kuwait, Lebanon, Oman, Saudi Arabia and Turkey.

European mobile performance is mostly strong, fixed varies

2019-Performance-vs-Global---Europe

With the exception of Ireland, the European countries on the Speedtest Global Index fell into the Speed Leaders, Mobile-Focused, and Speed Laggers categories. All of the Speed Laggers (Belarus, Kazakhstan, Russia and the Ukraine) were from Eastern Europe. Countries from Southeast Europe (including Albania, Bosnia and Herzegovina, Croatia, Greece, Montenegro, Moldova, Serbia and Slovenia) and Central Europe (Austria and the Czech Republic) made up the bulk of the Mobile-Focused category.

Speed Leaders included countries from the Baltics (Estonia, Latvia and Lithuania), the Nordics (Denmark, Norway and Sweden), Central Europe (Poland and Romania), and Western Europe (including Belgium, France, Germany, the Netherlands, and Spain).

North American internet performance is sharply divided

2019-Performance-vs-Global---North-America

Canada and the U.S. are the only two North American countries in the Speed Leaders category. Panama is the only North American country under Fixed-Focused. Mexico and all of the Central American countries fall into the Speed Laggers category. There are no North American countries that are Mobile-Focused.

Each country in Oceania has a very different internet story

2019-Performance-vs-Global---Ocean

Oceania is represented in three of the four quadrants: Speed Leaders (New Zealand), Mobile-Focused (Australia) and Speed Laggers (Papua New Guinea) with Fiji straddling the divide between Speed Laggers and Mobile-Focused.

South America mostly lags in mobile and fixed internet speeds

2019-Performance-vs-Global---South-America

Most of the South American countries represented on the Speedtest Global Index are in the Speed Laggers quadrant (Argentina, Bolivia, Brazil, Colombia, Ecuador, Paraguay, Peru, Suriname and Venezuela). Chile is an exception, being part of the Fixed-Focused group, as is Uruguay which sits in Mobile-Focused.

Global internet speeds are improving on average and 5G and gigabit are compounding those advances where available. However, not all countries are benefitting equally. We’ll be interested to see how 5G continues to push mobile speeds in the next year and also whether 5G Wi-Fi becomes a game changer for fixed broadband. Remember to check the Speedtest Global Index on a monthly basis for updated country rankings. And take a Speedtest to make sure your experience is represented in your country’s averages.

Editor’s Note: This article was edited on September 10, 2019 to correct an error in the labeling on the first image. The colors in a later image were updated for consistency.

Ookla retains ownership of this article including all of the intellectual property rights, data, content graphs and analysis. This article may not be quoted, reproduced, distributed or published for any commercial purpose without prior consent. Members of the press and others using the findings in this article for non-commercial purposes are welcome to publicly share and link to report information with attribution to Ookla.

| March 13, 2020

Tracking COVID-19’s Impact on Global Internet Performance (Updated July 20)

We are no longer updating this article as internet speeds in most countries have stabilized to pre-pandemic levels. For ongoing information about internet speeds in specific countries, visit the Speedtest Global IndexTM or contact our press team.

Ookla® closely monitored the impact of COVID-19 on the performance and quality of global mobile and broadband internet networks in the early days of the pandemic. We shared regular information based on Ookla data to assist in the understanding of this unprecedented situation. You can still download the July 20, 2020 CSV here which contains all the public data we tracked in this article. If you are looking for information on internet or online service outages, please check Downdetector®.

Ookla retains ownership of this article including all of the intellectual property rights, data, content graphs and analysis. This article may not be quoted, reproduced, distributed or published for any commercial purpose without prior consent. Members of the press and others using the findings in this article for non-commercial purposes are welcome to publicly share and link to report information with attribution to Ookla.

| January 12, 2021

2020 Recap: How the Internet Held Up During a Global Pandemic


There was major concern last year that the internet might fail under the pressure of increased use as COVID-19 drove unparalleled waves of remote work and schooling. We watched internet performance carefully using data from Speedtest Intelligence® as conditions changed in different areas of the world. Now we’re back to assess what happened during the year as a whole.

A note on the methodology: 5G launches drove up mean internet speeds on mobile in many countries. For this reason we’ve simplified our view to include only median speeds, which are less subject to being skewed by especially fast 5G tests.

Mobile speeds dipped in many G20 countries in the spring of 2020

Mobile-Broadband-Speeds-in-G20-Countries_0121

Median download speeds over mobile in many G20 countries dropped at some point during 2020. Countries that saw month-to-month declines during the spring include: Australia, Canada, France, India, Italy, Saudi Arabia, South Korea, Spain and Turkey. China saw a decline in mobile speed in February while Japan suffered a drop in June and July. Argentina, Brazil, Indonesia, Russia and the United Kingdom showed only very minor decreases, while speeds in Germany, Mexico, South Africa and the United States remained unchanged or increased.

Despite the drops, almost all G20 countries saw higher median download speeds over mobile in December 2020 than they had in January 2020. Median download speed over mobile increased 76.3% in China during that time. Germany saw a 62.8% increase, the United States 56.9%, South Korea 55.5% and Saudi Arabia 48%. Turkey saw a 0.7% decrease in median download speed over mobile during the same period.

Despite interim dips, fixed broadband improved in all G20 countries during 2020

Fixed-Broadband-Speeds-in-G20-Countries_0121

There were notable dips in median download speeds over fixed broadband in many countries during the spring of 2020. G20 countries that saw these declines on a monthly basis include: Argentina, Canada, France, India, Indonesia, Italy, Japan, South Korea, Spain, Turkey and the United States. Brazil, China, Germany and Russia notably showed only increases in month-to-month median download speed over fixed broadband during this time. Other countries showed only very minor decreases.

Perhaps most important, all G20 countries saw higher median download speeds over fixed broadband in December 2020 than they had in January 2020. Median download speed over fixed broadband increased 51.9% in Brazil during that time. France saw a 48.3% increase, Japan 46.5%, Saudi Arabia 43.7% and South Africa 40%. South Korea saw the smallest increase in median download speed over fixed broadband over the same period at 8.1%.

We are impressed, on the whole, with how well the internet held up to the massive scale of increased use during the past year. Of course, month-by-month, country-level views are averages that might not reveal problems with specific mobile operators or internet service providers on individual days. If you want to assess how your internet connection is performing right now, take a Speedtest®. And if you are unable to connect to a specific service on the internet, check Downdetector® to see the status of that service.

Ookla retains ownership of this article including all of the intellectual property rights, data, content graphs and analysis. This article may not be quoted, reproduced, distributed or published for any commercial purpose without prior consent. Members of the press and others using the findings in this article for non-commercial purposes are welcome to publicly share and link to report information with attribution to Ookla.

| December 14, 2021

Find Out if 5G is Worth the Upgrade: A Multi-Country Analysis

The holidays are nearly here and with them the desire to treat yourself or a loved one to an upgraded phone, just because. The first question you’re likely to ask yourself as you browse new models is “To 5G or not to 5G?” Once you check the Ookla 5G Map to see if your operator has deployed 5G in your area, you’ll probably want to know if the 5G speeds are worth the extra cost. We’ve analyzed Speedtest Intelligence® data from the most popular Android and iPhone devices around the world during Q3 2021 to help you see if it’s worth the upgrade. Click a country from the list to jump down to the related analysis.

Australia | Bahrain | Canada | China
France | Japan | Saudi Arabia | South Africa
South Korea | United Arab Emirates | United Kingdom | United States
Our analysis includes data on the five 4G Android devices in each country with the largest number of results during Q3 2021 as well as the five most popular 5G-capable Android devices. We have also compared the iPhone 13 to the iPhone 11. Even the fastest device can only perform at the level of the network it’s on. For that reason, speeds for the same device vary widely from country to country in the data below. Remember that speeds can also vary within a country and the performance you see will depend on the infrastructure in your area.

Australia

5G Samsung devices more than twice as fast as most popular 4G devices in Australia

Although only a year separates the release of the Samsung Galaxy S10 series and the S20 series devices, the latter were definitely faster in Australia during Q3 2021. Even the slowest 5G-capable device on this list, the Galaxy S20+ 5G was much faster than the fastest 4G phone, the Galaxy S10+.

ookla_android_performance_australia_1121-01

iPhone 13 wallops iPhone 11 for speed in Australia

Australians who recently upgraded their iPhone 11 for an iPhone 13 would have seen a more than 4X increase in median download speed during Q3 2021. If speed is your number one concern, this upgrade is necessary.

ookla_iphone_performance_australia_1121-01

Bahrain

5G Samsung variants live up to the hype in Bahrain

Fewer 5G-capable phones made our list in Bahrain during Q3 2021 due to sample counts, but those that did roundly outperformed the most popular 4G devices. The median download speed of 5G-capable devices on this list was more than two times faster than the median for 4G devices on this list.

ookla_android_performance_bahrain_1121-01

iPhone 12 85% faster than iPhone 11 in Bahrain

There weren’t sufficient samples to analyze performance of the brand new iPhone 13 in Bahrain during Q3 2021, but median download speed on the iPhone 12 was 85.0% faster than that on the iPhone 11.

ookla_iphone_performance_bahrain_1121-01

Canada

Not all 5G Android devices offer a massive improvement in Canada

Q3 2021 data from Canada shows that 5G isn’t the only way to get a fast connection. While the fastest 5G-capable device among the top five most popular (the Samsung Galaxy S21 Ultra 5G) offered very fast median download speeds, two 4G devices (the Note10+ and the S10+) were nearly as fast as the slowest 5G-capable device on this list (the S20 Fan Edition 5G). To upgrade or not is definitely a question here of which device you are upgrading from and which you plan to upgrade to.

ookla_android_performance_canada_1121-01

iPhone 13 more than three times as fast as the iPhone 11 in Canada

Canadians looking for fast mobile performance on Apple devices will enjoy an upgrade to the iPhone 13 whose median download speed in Q3 2021 was more than three times as fast as that on the iPhone 11.

ookla_iphone_performance_canada_1121-01

China

5G offers major advantages on Android in China

There is no question as to whether consumers with one of the five most popular 4G Android devices would see faster speeds with one of the five most popular 5G Android devices. The 4G devices on this list saw median download speeds in the 22.00 to 34.00 Mbps range during Q3 2021 while the 5G-capable devices showed median download speeds between 155.87 Mbps (Xiaomi Mi 10 5G) and 280.22 Mbps (Huawei Mate 40 Pro 5G).

ookla_android_performance_china_1121-01

iPhone 13 more than ten times faster than iPhone 11 in China

China was home to the largest performance increase when comparing the iPhone 11 to the iPhone 13. Median download speed on the iPhone 13 was more than ten times faster during Q3 2021 than on the iPhone 11. Some of this difference may reflect market conditions where users in more rural areas have older phones and poorer infrastructure, but it’s still an impressive difference.

ookla_iphone_performance_china_1121-01

France

French 5G offers a decent speed boost on Android

The most popular 4G devices in France showed median download speeds between 37.67 Mbps (Samsung Galaxy S8) and 51.36 Mbps (S20 Fan Edition) during Q3 2021. These were easily topped by the 5G-capable devices which showed median download speeds of 73.73 Mbps (Xiaomi Mi 10T Pro 5G) to 92.10 Mbps (Xiaomi Mi 11 5G).

ookla_android_performance_france_1121-01

iPhone 13 more than three times faster than iPhone 11 in France

French consumers who upgraded from the iPhone 11 to the iPhone 13 during Q3 2021 would have tripled their median download speed potential on the 5G-capable iPhone 13.

ookla_iphone_performance_france_1121-01

Japan

Android 5G devices are faster in Japan, but not always fast

The most popular 4G devices in Japan during Q3 2021 were much slower than the most popular 5G-capable devices. Speedtest Intelligence showed median download speeds on 4G devices ranging from 19.75 Mbps (Xiaomi Redmi Note 9S) to 26.57 Mbps (Oppo Reno A). Even the slowest 5G-capable device on this list, the Xiaomi Mi 11 Lite 5G at 43.63 Mbps, was 56% faster than the fastest 4G devices. However, the fastest 5G-capable device on this list, the Sony Xperia 1 II 5G, was twice as fast as that at 94.85 Mbps.

ookla_android_performance_japan_1121-01

iPhone 13 more than twice as fast as iPhone 11 in Japan

In Japan, the median download speed of the iPhone 13 was more than twice as fast as that over the iPhone 11 during Q3 2021. This was one of the smallest differences in performance between the iPhone 11 and 13 that we saw in our analysis.

ookla_iphone_performance_japan_1121-01

Saudi Arabia

5G Android devices are much faster than 4G in Saudi Arabia

Median download speeds on the most popular 5G-capable devices were fast in Saudi Arabia compared to most other markets. 5G-capable speeds ranged from 174.43 Mbps for the Samsung Galaxy S20 Ultra 5G to 261.21 Mbps for the S21 Ultra 5G. 5G is definitely worth the upgrade in Saudi Arabia.

ookla_android_performance_saudi-arabia_1121-2-01

iPhone 13 was more than five times faster than the iPhone 11 in Saudi Arabia

Not only did Saudi Arabia show the second fastest median download speed over iPhone 13 during Q3 2021, the iPhone 13 was also more than five times faster than the iPhone 11.

ookla_iphone_performance_saudi-arabia_1121-01

South Africa

5G shows a small improvement over 4G on Android in South Africa

The most popular 4G devices in South Africa showed a wide range of median download speeds during Q3 2021, from 18.00 Mbps (Huawei P20 Lite) to 40.69 Mbps (Samsung Galaxy Note10+). South Africa’s median download speeds on the most popular 5G devices were among the lowest we saw, from 43.09 Mbps on the Samsung Galaxy Note20 5G to 67.09 Mbps on the S21 Ultra 5G.

ookla_android_performance_south-africa_1121-01

iPhone 12 was almost twice as fast as the iPhone 11 in South Africa

There weren’t sufficient samples in South Africa to analyze the iPhone 13, so we compared the iPhone 12 to the iPhone 11. The median download speed on the iPhone 12 was almost twice as fast as that on the iPhone 11 during Q3 2021.

ookla_iphone_performance_south-africa_1121-01

South Korea

4G Android devices in South Korea are fast, 5G even faster

The median download speeds we saw on the most popular 4G devices in South Korea during Q3 2021 rivaled the 5G speeds in South Africa with speeds ranging from 53.74 Mbps on the Samsung Galaxy Note8 to 60.41 Mbps on the S9+. However, median performance on 5G-capable devices was even faster. There was a wide variety in speeds among the most popular 5G-capable with the S10 5G showing a median download speed of 102.61 Mbps and the S21 Ultra 5G coming in at 221.18 Mbps. 5G is worth the upgrade in South Korea and consumers have a variety of high-performing devices to choose from.

ookla_android_performance_south-korea_1121-01

iPhone 12 more than three times faster than iPhone 11 in South Korea

South Korea did not have enough samples from the new iPhone 13, so we compared the iPhone 12 to the iPhone 11. Not only was the iPhone 12 more than three times faster for median download speed than the iPhone 11 during Q3 2021, South Korea’s iPhone 12 download speed beat iPhone 13 download speed in five of the countries we analyzed: Canada, France, Japan, U.K. and the U.S.

ookla_iphone_performance_south-korea_1121-01

United Arab Emirates

U.A.E. had the fastest speeds on Android 5G devices

While the median download speeds across 4G devices in the U.A.E. during Q3 2021 handily beat those of all the other countries in this analysis, the country’s 5G download speeds were even faster. We can see from this data that some of the 4G devices can perform much better when on a faster network. Even the slowest 4G device on this list, the Huawei P30 Pro, had a median download speed of 68.26 Mbps in U.A.E. compared to 30.20 Mbps in the U.K. on the same device.

ookla_android_performance_uae_1121-2-01-1

A similar story can be told for 5G devices where the U.A.E. was competing only with Saudi Arabia and South Korea for the fastest median performance on devices listed during Q3 2021. The Samsung Galaxy S21 5G showed a median download speed of 285.39 Mbps in the U.A.E. compared to 215.10 Mbps in South Korea while the Galaxy S21 Ultra 5G showed a median download speed of 269.09 Mbps in the U.A.E. and 261.21 Mbps in Saudi Arabia.

iPhone 13 more than four times faster than iPhone 11 in U.A.E.

Not only did the U.A.E. have the fastest median download speed over iPhone 13 that we saw in this analysis, the 485.59 Mbps download speed was faster than any phone in any country that we analyzed in Q3 2021. The iPhone 13 capitalized on fast 5G in the U.A.E. to have a median download speed that was more than four times faster than that of the iPhone 11.

ookla_iphone_performance_uae_1121-01

United Kingdom

5G represents a solid improvement over 4G on Android devices in the U.K.

Consumers upgrading from one of the most popular 4G devices in the United Kingdom to one of the most popular 5G-capable devices would have seen a 2-3X increase in median download speed during Q3 2021. This is in part because the 4G devices on this list were slower in the U.K. than elsewhere in the world during Q3 2021 as 4G speeds have stagnated in the U.K. For example, the Samsung Galaxy S8 showed a median download speed of 24.20 Mbps in the U.K., 37.67 Mbps in France and 46.31 Mbps in Canada. All five of the 5G-capable devices that we analyzed in both the U.S. and the U.K. were faster in the U.K. during Q3 2021.

ookla_android_performance_uk_1121-01

iPhone 13 more than five times faster than the iPhone 11 in the U.K.

Our analysis of Speedtest Intelligence data from Q3 2021 showed that the iPhone 13 had a median download speed that was more than five times faster than that on the iPhone 11. This makes the iPhone 13 very much worth the upgrade if speed is your main concern.

ookla_iphone_performance_uk_1121-01

United States

5G Android devices were twice as fast as 4G in the U.S.

The most popular 4G devices in the U.S. were about half as fast for median download speed as the most popular 5G-capable devices during Q3 2021. The Samsung Galaxy S21 Ultra 5G showed the highest median download speed among these devices at 69.78 Mbps, compared to the fastest 4G device surveyed, the Note10+ at 35.98 Mbps. That said, 5G-capable devices in the U.S. underperformed when compared to other countries, except Japan and South Africa.

ookla_android_performance_us_1121-01

iPhone 13 nearly three times as fast as the iPhone 11 in the U.S.

Data from Speedtest Intelligence reveals that median download speed on the iPhone 13 was nearly three times as fast as that on the iPhone 11 in the U.S. during Q3 2021.

ookla_iphone_performance_us_1121-01

Our analysis shows that increased speed is one of the benefits of upgrading your 4G phone to a 5G-capable one, regardless of where you live but not all countries see the same speed increases. Customers in Saudi Arabia, the U.A.E, China and South Korea will see especially good performance if upgrading an Android phone. The U.A.E., Saudi Arabia, China and Australia have especially good speeds on the iPhone 13. Whatever choice you make for your next phone, take a Speedtest® on Android or iOS to make sure your mobile operator is delivering the speeds you want to see.

Ookla retains ownership of this article including all of the intellectual property rights, data, content graphs and analysis. This article may not be quoted, reproduced, distributed or published for any commercial purpose without prior consent. Members of the press and others using the findings in this article for non-commercial purposes are welcome to publicly share and link to report information with attribution to Ookla.

| September 20, 2021

How CST Makes Evidence-Based, Data-Driven Spectrum Policy Decisions Supported by Ookla Analysis [Case Study]

The Kingdom of Saudi Arabia’s (KSA) Vision 2030 program has laid out national goals to create a thriving digital economy in the coming decade. High-speed, widely accessible mobile networks are central to that digital transformation. KSA’s telecommunications regulator, the Communications, Space & Technology Commission (CST), enables the nation’s communications infrastructure while assuring that services meet specific standards of accessibility, performance, fairness, and value. CST has developed a three-year spectrum roadmap to establish the country as a world leader in radio communication — while supporting soaring consumer data consumption and future wireless technologies that will fuel economic growth.

While developing its ambitious spectrum outlook, CST conducted extensive trials and technical analysis, leveraging data from Ookla® and other sources. As a result of this spectrum outlook, its collaborative regulation with other national stakeholders and other key policies and initiatives, CST was recently designated as a fifth-generation (G5) regulator by the International Telecommunications Union (ITU) — the highest level of regulatory maturity.

Situation

CST has a strategic vision to embrace digitalization as a central anchor for the country, connecting its constituents to economic opportunities and reshaping the national approach to connectivity. In previous years, Saudi Arabia’s spectrum was split evenly between three operators. However, to enable technologies like 5G, satellite broadband, and Wi-Fi 6e, a progressive spectrum policy was needed to meet the growing demand for wireless proliferation.

In advance of its upcoming spectrum auction, CST needed data to inform the development of its spectrum strategy, including intelligence on similar spectrum policies in other global markets. CST committed to a new, evidence-based approach to spectrum assignment drawing from technology trials and consultations with network operators, device and chipset manufacturers, infrastructure providers, end users, and network data providers, including Ookla. Most notably, CST needed data to expand its analysis of spectrum usage, performance of various bands and existing network infrastructure to see where investments had been made within certain bands (e.g., extra capacity in specific bands in urban areas and coverage of rural areas using adequate bands).

Read the full case study

Ookla retains ownership of this article including all of the intellectual property rights, data, content graphs and analysis. This article may not be quoted, reproduced, distributed or published for any commercial purpose without prior consent. Members of the press and others using the findings in this article for non-commercial purposes are welcome to publicly share and link to report information with attribution to Ookla.

| September 11, 2022

5G Supporting Digital Transformation of the Hajj Experience

This year’s Hajj, held July 7-12, marked an important proof point in the development of Saudi Arabia’s 5G networks and their ability to support increasing numbers of pilgrims, in line with the Saudi Vision 2030 goals. It was the first Hajj to welcome international pilgrims back to Mecca following COVID-19, with one million domestic and international guests allowed to attend. It was also the first stress-test of the nation’s 5G networks, which launched in October 2019. 5G networks are also becoming a central point of innovation for digital services to support the Hajj pilgrim’s experience.

5G network densification driving Saudi Arabia’s performance gains

The first commercial 5G network launched in Saudi Arabia in October 2019. Thanks to early allocation of key spectrum bands for 5G use and strong investment from network operators, Saudi Arabia has rapidly climbed Ookla’s Speedtest Global Index™, moving from 46th place in January 2019 with a median download speed of 22.14 Mbps to 8th place in July 2022 at 96.23 Mbps.

Stc led in terms of 5G base stations (based on reported data), with 6,506 nationally as of December 2021, representing a density of ~5,400 people per 5G base station, putting it on par with operators such as NTT DoCoMo and Deutsche Telekom. According to Speedtest Intelligence®, 5G Availability in the market (the percentage of users with 5G-capable devices who spent a majority of time connected to 5G networks) hit 25% at the end of 2021, supported by the network densification efforts of the nation’s three mobile network operators.

The Saudi Communications, Space & Technology Commission (CST) announced full ICT readiness for the Hajj in late June. Operators have sought to densify their networks around Mecca and locations specific to the Hajj, with over 5,900 mobile towers operational, including 2,600 5G towers, 41% more than in 2021, according to CST. Given the million pilgrims in attendance in 2022, this equates to a maximum density of 385 people per base station (assuming operators have located equipment on each tower). Operators have also installed over 11,000 Wi-Fi access points, with pilgrims offered two hours of free access per day.

Hajj represents a unique challenge for mobile networks

Hajj takes place over a set number of days each year, in specific locations in and around the city of Mecca. It represents a unique demand on telecom networks, considering the number of visitors and their movement and congregation around various locations integral to the pilgrimage. For example, the journey from Mina to Arafat is 13 km and is undertaken by foot, while pilgrims also congregate in locations such as the Masjid al-Haram mosque in Mecca on the final day.

Pilgrims attending the Hajj typically use mobile networks to keep in touch with family and relatives at home and to document their pilgrimage. With a million people in attendance, the build up to the Hajj and ensuring sufficient network infrastructure is in place has become a major project. The CST works with network operators in the region to ensure sufficient network coverage and capacity before Hajj, while also monitoring performance metrics during Hajj. CST also developed business continuity and recovery plans to ensure the continuity of telecom and ICT services for pilgrims.

5G performance during Hajj 2022

Speedtest Intelligence® data shows that the introduction of 5G has massively boosted network performance in Saudi Arabia. In addition, despite the large number of pilgrims and resultant demand for capacity, the level of network densification at Hajj locations has driven increased performance over and above national levels. During this year’s Hajj, mean download speeds across all technologies in Saudi Arabia clocked in at 187.22 Mbps, while the mean upload speed was 23.89 Mbps. By contrast, the speeds recorded in Medina city were faster, with a mean download speed of 229.33 Mbps and a mean upload speed of 47.68 Mbps.

chart comparing 5G performance during Hajj, 2019 vs. 2022

Operator performance at Hajj locations can vary based on both the network infrastructure deployed and the level of congestion on each network. Speedtest Intelligence data during Hajj 2022 (7-12 July), for the city of Medina showed that stc achieved a median 5G download speed of 470.00 Mbps during Hajj 2022, ahead of Zain with 375.20 Mbps. Mobily led for median 5G upload performance with 40.18 Mps. In Mecca, there was no statistically significant lead for any operator in terms of median 5G download speeds, with Mobily recording 453.00 Mbps and stc 393.73 Mbps, while Mobily led on median 5G upload speed with 54.77 Mbps.

maps of 5G performance of Medina and Mecca during Hajj 2022

The impressive network speeds available in these locations are helping drive increased data use. Ericsson’s Mobility report estimates that global data traffic per user was on average 395 MB per day during 2021, while in GCC States the average was 723 MB. CST reported that daily internet consumption during the Hajj averaged 851 MB per user, an uplift of 142% compared to the average of 352 MB consumed in 2019. Beyond voice calls, video and social media apps including YouTube, TikTok, Facebook, Snapchat, and Instagram were the most heavily used.

The growth in video calls and social media video use necessitates sufficient network capacity to support an optimal video user experience. Speedtest Intelligence data shows that the adaptive average bitrate supported by 5G networks in the country was 3.97 Mbps in July, up from 3.57 Mbps in December 2021. Supporting a higher bitrate allows networks to serve higher definition video content. As a result, 77.2% of users recorded an adaptive primary video resolution of at least 720p, which is generally considered high definition. Mobily and Zain performed similarly in July, recording an adaptive average bitrate of 4.43 Mbps and 4.42 Mbps respectively.

Chart showing adaptive average bitrate in Saudi Arabia by operators

Mobile networks driving digitization of Hajj services

For several years, Saudi Arabia’s Ministry of Hajj and Umrah has sought to improve the experience and safety of pilgrims visiting the country. Prior to this, managing the Hajj application process, as well as logistics, accommodation, and other important services such as healthcare provision had been a largely manual process, and given the scale of Hajj, subject to errors and delays. The Pilgrim Experience Program was launched in 2019, following a study involving thousands of Muslims worldwide to define their expectations and needs. It seeks to enable new innovations (many supported by mobile network connectivity) designed to enhance the pilgrim’s experience during the Hajj and Umrah (pilgrimage outside of Hajj). Key developments include:

Hajj Smart ID. 2021 saw the introduction of electronic “Hajj cards,” allowing contactless access to all religious sites, accommodation, and transport. These digital passes aimed to facilitate the movement of pilgrims to and from Mecca, reducing waiting times for transport between Mecca and the Holy Sites, while also minimizing the need for human contact (an imperative during the COVID-19 pandemic). This initiative was expanded in 2022 with the introduction of the Hajj Smart ID, enabling pilgrims, Hajj staff, and organizers to access medical services, location data, as well as coordination and communication with the rest of a pilgrim’s group.

Digital Healthcare Services. Healthcare for pilgrims attending Hajj has been a major focus, given the strenuous nature of the pilgrimage and the high temperatures pilgrims are exposed to. The smart bracelet initiative, introduced in 2021, provided pilgrims with a connected wearable health device, which included their personal data as well as health status. The bracelet monitored blood oxygen levels and heart rate in real-time, allowing pilgrims to seek emergency medical or security assistance services. This year, the Saudi Minister of Health launched a “Holodoctor” service in partnership with stc, using 5G connectivity to offer pilgrims medical services via 3D video conference, including inspection, diagnosis, and the disbursement of medicines.

Crowd management. The “Tafweej” program focuses on crowd management for the Hajj, a vital task in light of problems in the past caused by overcrowding which led to fatalities. Organizers have sought to group pilgrims together and schedule movements of these groups using an electronic system that monitors traffic flow at key sites. During 2022’s Hajj, CITC and GPH (General Presidency of Haramain) trialed an indoor smart navigation system to help pilgrims and operations teams navigate the Grand Mosque more efficiently. Stc has also looked to introduce Augmented Reality (AR) services to support this effort, providing virtual guides for Tawaf (the part of Hajj involving circumambulation of the Ka’bah), as well as providing directions and information about the Grand Mosque (Mecca Haram). Saudi Arabia’s Vision’s 2030 goal is to support 30 million pilgrims annually, a huge increase over current levels, and will rely on further innovations built on top of the nation’s rapidly developing 5G networks. Click here to find out more about how Ookla’s Speedtest Intelligence data can offer competitive network insights and support targeted network investment decisions.

Ookla retains ownership of this article including all of the intellectual property rights, data, content graphs and analysis. This article may not be quoted, reproduced, distributed or published for any commercial purpose without prior consent. Members of the press and others using the findings in this article for non-commercial purposes are welcome to publicly share and link to report information with attribution to Ookla.

| November 30, 2022

A Gigabit Society Requires a Data-Driven Regulatory Approach: Key Takeaways From Ookla's Southeastern Europe Regulatory Summit

Ookla®, in partnership with Ibis Solutions, hosted the inaugural Southeast Europe Regulatory Summit on November 4, 2022 in Belgrade, Serbia with participants from across Europe and a guest speaker from Saudi Arabia. The summit examined how crowdsourced data can support regulators and drive effective policymaking while reflecting on the regional telecommunication landscape, its challenges, opportunities, and how to ensure consumers have good quality of experience (QoE).

Key Takeaways

  • Spectrum is key when it comes to 5G. CST shared how data-driven, evidence-based policy decisions enabled a 5G rollout.
  • The European Commission’s goal of gigabit connectivity is one of the driving forces behind the rollout of fiber networks. So far, the progress is mixed across the region in terms of fiber network rollout and adoption.
  • Good quality data and sharing best practices is essential for effective policymaking. Crowdsourced data helps measure progress and assess real service performance experienced by end users.

A data-driven approach to 5G rollouts will bear fruit

The majority of countries across southeast Europe have launched 5G, including Croatia, Cyprus, Greece, Montenegro, North Macedonia, Romania, and Slovenia. However, Serbia, Albania, and Bosnia and Herzegovina are still yet to auction dedicated 5G spectrum.

Chart of 5G performance and availability across southern Europe

Within Southeast Europe, 5G Availability (the proportion of users of 5G capable devices who spend the majority of their time on 5G networks) reached almost 50% in Cyprus. Yet, four out of seven countries had 5G Availability below 10% in Q3 2022. 5G performance depends heavily on the 5G spectrum holding. As a rule of thumb, the larger the share of the C-Band spectrum, the faster the 5G download speed, while access to low-band spectrum has an impact on 5G Availability. 

Therefore, having a spectrum roadmap is key to ensuring effective spectrum assignment. Salem Askar, a Senior Specialist in the  QoS Department at CST (Communication, Space and Technology Commission), shared how data-driven decision-making informed the development of its spectrum strategy. This resulted in Saudi Arabia improving its mobile performance, and its ranking in the Ookla’s Global Index – from 105th place in September 2017 to 10th place in October 2022.

CST committed to a new, evidence-based approach to spectrum assignment drawing from technology trials and consultations with network operators, device and chipset manufacturers, infrastructure providers, end users, and network data providers, including Ookla. Most notably, CST needed data to expand its analysis of spectrum usage, the performance of various bands, and existing network infrastructure to see where investments had been made within certain bands (e.g., extra capacity in specific bands in urban areas and coverage of rural areas using adequate bands). If you would like to find out more, read this case study. Looking ahead, CST properties revolve around the improvement of citizens’ lives by giving them access to minimum speeds of 100 Mbps, releasing more spectrum for 5G and beyond. 

However, spectrum is just one part of the 5G puzzle. Konstantinos Masselos, President of Hellenic Telecommunications and Post Commission and BEREC Vice Chair 2022, shared that BEREC’s focus extends beyond 5G spectrum allocation. That includes following up on developments for a number of relevant issues covering the whole 5G ecosystem (i.e., end user, interoperability, new business models and value chains, privacy, Quality of Service (QoS), roaming, roll out, security, state aid) and identifying regulatory challenges. A key focus area is sustainability and how to make networks not only faster but also more energy efficient and environmentally friendly. BEREC’s work on 5G aims to contribute to the maximum benefit for end users in terms of availability, pricing, quality, security, and other choices.

Regulatory incentives propel the move to fiber

Chart of fixed performance and FTTH/B subscription percentage of households across southern Europe

The demand for gigabit-capable broadband access increased over the past few years, mainly due to the increasing number of people working from home and the growth in service availability. According to Speedtest Intelligence®, Romania had the fastest 5G speeds in Q3 2022, with a median fixed download speed of 131.96 Mbps and 94.29 Mbps upload speed. These speeds are not a surprise given that Romania has one of the highest Fiber to the Home/ Building (FTTP/B) penetration rates across the region — nearly 54% of households — which is partially driven by government-backed fixed infrastructure projects such as RoNet, and the special attention given to rural and disadvantaged areas. Slovenia is also progressing well in terms of access to fiber, thanks to the Slovenian government’s introduction of a next-generation broadband network development plan, which is in line with the EU’s ‘gigabit society’ plan. It is aiming to provide internet access to all households in rural or urban areas with at least 100 Mbps that can be upgradable to gigabit speed. Serbia’s growth in FTTP/B connections is gaining pace as well, with Yettel’s entry into the fixed segment in November 2021 resulting in increased market competition. Pavle Mijuskovic, Deputy Executive Director, the Department for Electronic Communication Networks and Services (EKIP) of Montenegro shared that (FTTH/B) networks covered around 70% of households, while the real subscriptions are much lower — only about 45% of households. The need to close the gap in rural areas is something that Montenegro focuses on now. Mr. Mijuskovic also highlighted that widespread fiber rollout necessitated a change in the way infrastructure is deployed: putting cables underground at lower power grades and reusing the post or street lights to deliver fiber to households. 

During the panel session, Mr. Masselos shared his view that “development of broadband to the home is a very important topic,” with regulatory actions in place to achieve a target of all homes across the EU to have ‘gigabit connectivity’ by 2030. He brought attention to the fact that in Greece there is a significant gap between fiber rollout and adoption. Despite improvements in Fiber to the Premise (FTTP) coverage, which stood at roughly 20% of households in 2021 (an increase from 7% in 2019) the actual take-up is in the low single-digit partially because of the higher cost of fiber subscription. Greece is also looking to promote open wholesale networks to increase coverage and prevent overbuilding of fiber networks. With regards to FTTH deployment and adoption, Mr. Masselos emphasized the need to formulate policies that will encourage investment and will also support the demand side so that fiber infrastructure is accessible and economically viable in the long term. In addition to being available, services over FTTH/FTTP must also be competitively priced.

The power of data in understanding a digital divide 

The vast majority of operators in the region plan to retire copper networks and migrate their DSL users over to FTTH/P. As such, fiber investment will remain a priority for telcos and will often be supported by subsidies, EU funding, and co-investment. At the European level, the policy goal is for every European household to have access to high-speed internet coverage by 2025 and gigabit connectivity by 2030. Regulators, alongside BEREC and the European Commission, work to promote connectivity and enable access to high-speed networks. Therefore, it’s vital to understand the real service performance as experienced by end users. Bryan Darr, Vice President, Smart Communities at Ookla shared how crowdsourced data can be used by governments to help them measure progress.Map of Fixed broadband Speedtest results in central Serbia

Darr shared a snapshot of fixed network performance in Central Serbia by layering the speeds with the fastest speeds on top, providing evidence of where broadband speeds are being met and where they are not (see map above). Whereas fiber penetration is increasing across Serbia, there are still areas where users do not experience speeds beyond 25 Mbps (red dots on the map). What our data reveals is that good performance tends to be centered in urban and metropolitan areas. Similarly, the OECD report “Bridging Digital Divides in G20 Countries” found that in rural areas of the EU and G-20 countries, fixed broadband download speeds are close to 50% slower than speeds in cities and urban hubs. 

Map of mobile performance, coverage, and signal measurement near Novi Sad, Serbia – Ookla Cell Analytics

Similarly, using Ookla Cell Analytics data we can identify poor coverage areas and assist with network planning to optimize mobile network connectivity and performance. It all starts with understanding service availability, including signal strength (RSRP), signal quality (RSRQ), and areas of high demand. Customer throughput depends on capacity; even though there might be a high signal strength and good network quality, the actual speed is determined by network capacity which depends on the number of devices within this location. 

Good quality data and sharing best practices is the best tool in the regulator’s arsenal

Mr. Masselos shared that good quality data is a necessity for efficient policymaking and EETT has done work in this space already. For example, by looking at broadband prices versus performance and QoS across Greece and other countries, “we see these comparisons cannot be one dimensional, but two dimensional. I feel we need to do more of these types of analyses and develop relevant methodologies.” Mr. Askar of CST echoed this sentiment by saying that to achieve goals regulators ought to bring knowledge from different parts of the world. Pavle Mijušković of EKIP stressed that to overcome the digital divide there is a need to use a combination of all available technologies to provide services. Furthermore, he suggested the improvement of capacities and capabilities will help drive digital transformation and strengthen the digital awareness of society.

Ookla’s Co-Founder and CEO Doug Suttles summed up the event by saying that a hidden benefit Ookla can provide is to “figure out the best practices, as relationships with operators in 150 countries help a lot on that. Having regulators exchange knowledge on how to create better connectivity for cost-effectiveness, is vital to our industry.” Our event partner, Ibis Solutions, a software products vendor in the southeast Europe region, also underlined the potential of Ookla metrics for regulatory agencies such as public portals with new features. Vladimir Rakić, Software Development Director at Ibis Solutions summarized the summit by saying “attending regulatory agencies recognized how crowd metrics could help address massive outages or network performance issues that further result in a huge amount of user complaints.”

Ookla’s mission is to measure, understand, and help improve connected experiences. Events such as this regulatory summit help with the cross-pollination of ideas and best practices. Telecom regulators who attend Ookla’s future summits will also be able to facilitate discourse on related topics, challenges, ideas on elevating the subscriber experience in their respective regions, and how to improve their country’s rank on the Speedtest Global Index™. If you are a regulator looking to make more data-driven, evidence-based policy decisions, inquire here

Ookla retains ownership of this article including all of the intellectual property rights, data, content graphs and analysis. This article may not be quoted, reproduced, distributed or published for any commercial purpose without prior consent. Members of the press and others using the findings in this article for non-commercial purposes are welcome to publicly share and link to report information with attribution to Ookla.